DOI:
10.1039/C4RA04864D
(Paper)
RSC Adv., 2014,
4, 33022-33028
Controllable functionalized carbon fabric for high-performance all-carbon-based supercapacitors†
Received
23rd May 2014
, Accepted 15th July 2014
First published on 15th July 2014
Abstract
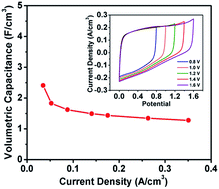
Research is currently being carried out to develop high-performance solid-state supercapacitors (SCs) with high energy density. One effective method to improve the energy density of the solid-state SC devices is enlarging their operating voltage. Organic electrolytes and asymmetric structure have been employed in supercapacitors to increase their operating voltage. However, they usually suffer from high cost, high toxicity, poor ionic conductivity and complicated manufacturing processes. Herein, a simple oxidation and annealing method is introduced to fabricate functionalized carbon fabric (FCF) electrodes. The as-prepared FCF electrode exhibits a high areal capacitance of 155.8 mF cm−2 and 143.4 mF cm−2 at negative potential and positive potential, respectively. Furthermore, a high-performance and flexible solid-state supercapacitor with high operating voltage (1.6 V) is successfully developed using functionalized carbon fabric as both positive and negative electrode. The FCF-based device has a high capacitance of 134.8 F cm−2 (or 2.41 F cm−3). The maximum volumetric energy density and volumetric power density are 0.83 mW h cm−3 and 1.58 W cm−3, respectively, which are higher than most previously reported CF-based SCs. The proposed FCF electrodes demonstrate exciting possibilities of developing high-performance solid-state supercapacitors with high operating voltage for efficient energy storage.
1. Introduction
Owing to the enormous energy consumption of the world, efficient energy storage is becoming a key issue for modern society.1–4 Supercapacitors (SCs), as the state-of-the-art energy storage devices, have drawn extensive attention because of their novel features such as high power density, fast charge–discharge rate, and stable cycling life.5–9 Compared to the SCs with liquid electrolytes, the solid-state SCs using polymer gel electrolytes represent a promising strategy towards safe, flexible, light-weight and environmental benign energy storage devices.9–15
Energy density is a very important parameter for an energy storage component. To meet the increasing energy demand for the next generation wearable and flexible electronic devices, it is essential to fabricate high energy density SCs with good flexibility.16–18 The energy density (E) of SCs, which can be calculated by the equation E = 1/2CV (ref. 2 and 6) is related to the capacitance (C) and the operating voltage (V) of the device. An effective method to extend the operating voltage is to use organic electrolytes such as tetraethylammonium tetrafluoroborate or lithium perchlorate.19 Nevertheless, most of the organic electrolytes are toxic and expensive and have poor ionic conductivity. A promising alternative is to use aqueous/solid-state electrolytes which have good ionic conductivity and environmental benignancy, and enlarge the operating voltage by constructing an asymmetric system with positive and negative electrodes.13,14,20,21 However, most of the asymmetric SCs (ASCs) are fabricated by complicated techniques because different materials have to be deposited on the electrodes to construct the asymmetric system. Moreover, to take the advantage of the largest operating window, the mass ratio of the positive electrode material and negative electrode material has to be carefully designed in order to balance the charges between the two electrodes.13,21 Thus, the development of simple, low-cost, and green SCs with large operating window is urgently demanded.
It has been reported that functional groups attachment is an effective method to enhance the energy storage capacity of carbon-based capacitors.22–29 The attached functional groups could enhance the performance of both positive and negative electrodes depending on the increasing hydrophilicity of carbon-based materials and reversible redox reactions of different functional groups.27–31 The amount of functional groups could affect the conductivity and capacitance of the carbon-based supercapacitors. Hence, we anticipate that after optimizing the amount of functional groups, a SC with a large operating window could be fabricated by virtue of the redox reactions at positive potential and negative potential.
In this study, carbon fabric (CF) is chosen as the carbon-based electrode because it is mechanical stable, low cost, flexible, wearable and compatible with large area applications. In order to expand the operating window of SCs, we fabricated an electrode based on faradic reactions of different types of functional group on the functionalized carbon fabric (FCF). The FCF was prepared by a simple oxidation and annealing method. This method could optimize the conductivity and capacitance of a carbon fabric, resulting in the carbon fabric with stable electrochemical properties at both negative potential (between −0.8 V and 0 V) and positive potential (between 0 V and 0.8 V). A maximum areal capacitance of 155.8 mF cm−2 and 143.4 mF cm−2 has been obtained for the electrode at negative potential and positive potential respectively. These unique features endow the potential of functionalized carbon fabric as a promising electrode for high-performance SCs. What's more, we demonstrated a flexible solid-state SC device based on FCF electrodes. The whole device (including electrodes, separator and electrolyte) shows a high areal capacitance of 134.8 F cm−2 (or 2.41 F cm−3). The maximum volumetric energy density and volumetric power density is 0.83 mW h cm−3 and 1.58 W cm−3, respectively, which are higher than most reported CF-based SCs.9,11,12,14,36,38 The FCF-based SC exhibits a tremendous potential as an energy storage component for the wearable and portable electronic systems.
2. Results and discussion
Fig. 1 illustrates the preparation process of FCF electrodes. The CFs were cleaned with acetone, ethanol and deionized water for several times, and then the CFs were functionalized by an anodic electrochemical corrosion method. The electrochemical corrosion was conducted by applying a potential of 2.2 V for 20 min in 1 M H2SO4 in a three-electrode cell with CF as the working electrode, a graphite rod as the counter electrode and an Ag/AgCl electrode as the reference electrode. After that, the FCFs were annealed in a furnace in air atmosphere at different temperatures (100 °C, 200 °C and 300 °C) for 3 hours to adjust the amount and type of functional groups. Fig. 2a and c and S1† are the scanning electron microscopy (SEM) images of pure CF (PCF), FCF annealed at 200 °C, and FCF without annealing respectively. Fig. 2b and d are the high resolution TEM images of pure CF and FCF annealed at 200 °C collected at the edge of each carbon fiber respectively. According to the SEM and TEM images, the structure of CFs does not have obvious change after the oxidation and annealing processes. In order to analyze the annealing process on the FCF, thermal gravimetric analysis (TGA) and differential scanning calorimetry (DSC) were performed (Fig. 3a). The TGA measurement curve shows that the mass of the sample decreases as it is heated from ∼25 °C to 300 °C. The weight loss should be due to the removal of water and the detachment of functional groups on the sample. The steep slope of the TGA curve at ∼200 °C indicates that a large amount of functional groups are detached at this temperature. The peaks observed in the DSC curve confirm the weight changes are caused by evaporation and chemical reactions. The types of functional group on CFs annealed at different temperatures were characterized by Fourier transform infrared spectroscopy (FTIR, Fig. 3b). The sample without annealing was denoted as UA. All spectra have a broad peak at 3430 cm−1 corresponding to –OH groups either in H2O or grafted on FCF surfaces. The peak at 1120 cm−1 and 1720 cm−1 is related to the C–O and C
O stretching respectively.24 According to the FTIR results, carbonyl (〉C
O), hydroxyl (〉COH) and carboxylic (–COOH) functional groups exist on all the FCFs. To investigate the structural changes in FCFs annealed at different temperatures, the Raman spectroscopy was performed. The Raman spectra of FCFs in Fig. 3c show two strong peaks at 1350 cm−1 and 1580 cm−1, which correspond to the D band (vibration of carbon atoms with dangling bonds) and G band (vibration of sp2-bonded carbon atoms) of CF respectively.24 With the increase of annealing temperature, the intensity of G band rises and the D band intensity decreases significantly. Fig. 3d exhibits that the ratio of G band to D band increases with the annealing temperature, elucidating the hybridization of bonded carbons is changed from sp3 (with insulating or semi-conducting properties) to sp2 (with high-conducting properties) at high temperatures. This indicates the detachment of functional group at high annealing temperature could increase the conductivity of FCF. In order to further analyze the surface elemental composition, chemical states and the functional group quantitative change, we performed X-ray photoelectron spectroscopy (XPS, Fig. 4) measurements. The XPS spectra (Fig. S2†) reveal that the FCFs are composed of C, O and trace amount of S which may be due to residual H2SO4. Fig. 4a shows the C 1s peaks of the FCFs.33,35 O 1s peaks are shown in Fig. 4b. These two figures show that with increasing annealing temperature, the intensity of C–C bond increases and the amount of oxygen decreases. In Fig. 4c, the high-resolution C 1s peak scan of 200 °C-annealed FCF could be deconvolved into four peaks that C–C (284.6 eV) signals are clearly predominant with C–O (286.2 eV), C
O (287.6 eV) and O–C
O (289 eV) further proving the existence of carbonyl, carboxyl and hydroxyl. It should be noted that with increasing annealing temperature (from ∼25 °C to 300 °C), the O to C ratio obtained from XPS (Fig. 4d) decreases from 106.1% to 19.8% indicating the amount of functional groups on FCF electrode were reduced gradually.
 |
| Fig. 1 Schematic diagram of the fabrication procedure of FCF electrodes. | |
 |
| Fig. 2 (a) SEM image of pure carbon fabric (inset is the low resolution image). (b) High resolution TEM image of pure carbon fabric. (c) SEM image of carbon fabric after etching and annealing at 200 °C (inset is the low resolution image). (d) High resolution TEM image of carbon fabric after etching and annealing at 200 °C. | |
 |
| Fig. 3 (a) TGA & DSC curves with temperature from room temperature to 450 °C. (b) FTIR spectra of FCFs annealed at different temperatures. (c) Raman spectra of FCF annealed at different temperatures. (d) Correlation between the ratio of G band to D band and the annealing temperature of FCF. | |
 |
| Fig. 4 XPS spectra of FCF under different annealing conditions: (a) high resolution scans of C 1s. (b) High resolution scans of O 1s and (c) high resolution scan of C 1s of 200 °C-annealed FCF. (d) The O to C ratio of the FCF electrode under different annealing temperatures. | |
To evaluate the electrochemical properties of FCF electrodes, we performed the cyclic voltammetry (CV) and galvanostatic charge–discharge (GCD) measurements in a three-electrode cell with a 0.5 M Na2SO4 aqueous electrolyte, a graphite rod as the counter electrode and an Ag/AgCl electrode as the reference electrode. The operating window is between 0 and 0.8 V and between −0.8 and 0 V. Fig. 5a and b show the CV curves of 200 °C-annealed FCF electrode, UA electrode, PCF electrode and KOH activated CF electrode. The CV area of 200 °C-annealed FCF is much larger than that of the UA FCF, PCF and KOH activated CF, demonstrating that the simple oxidation and annealing method is a promising technique to fabricate a high performance FCF electrode. The capacitance of the electrode at positive and negative potential is mainly attributed to the following Faradaic reactions of
C
O,
COH and –COOH:34
|
–COOH ⇔ –COO + H+ + e−
| (2) |
 |
| Fig. 5 CV curves of PCF, UA FCF, 200 °C-annealed FCF and KOH activated CF electrodes in 0.5 M Na2SO4 at the scan rate of 100 mV s−1 in an operating window of (a) 0–0.8 V (b) −0.8 to 0 V. | |
Fig. 6a and c present the typical CV curves of the FCF electrodes with different annealing temperatures (100 °C, 200 °C and 300 °C) at a scan rate of 100 mV s−1. Fig. S4a and S4c† show the CV curves of 200 °C-annealed FCF electrode with the scan rates from 10 mV s−1 to 200 mV s−1. The curves exhibit a roughly rectangular shape approximately symmetrical about the zero-current line at different scan rates, implying a good capacitive behavior. The CV scans at scan rates from 10 mV s−1 to 200 mV s−1 for the 100 °C annealed FCF electrode and 300 °C annealed FCF electrodes are shown in Fig. S3a, c and S5a, c† respectively. It is worth to note that the 200 °C-annealed electrode shows the best performance at both positive potential and negative potential, indicating that the oxidation and annealing method could optimize the amount of the three functional groups simultaneously. To investigate the capacitance and rate capability of FCF electrodes, the GCD measurement was performed (Fig. S3b, S3d, S4b, S4d and S5b, S5d†). The areal capacitance of the electrodes was calculated through the following equation:
where
I is the discharge current, Δ
t is the discharge time, Δ
E is the potential window during the discharge process (after IR drop), and
S is the effective area of the electrode (∼1 cm
−2). According to
Fig. 6b and d, at a current density of 3 mA cm
−2, the 200 °C-annealed FCF has a large areal capacitance of 143.4 mF cm
−2 and 155.8 F cm
−2 in the potential range from 0 to 0.8 V and from −0.8 to 0 V respectively which is 181% and 170% higher than that of the 100 °C-annealed FCF and 568% and 258% higher than that of the 300 °C-annealed FCF. These values are comparable to the previous results of electrodes with carbon fabric coated with metal oxides or metal nitrides reported in the literature.
12,14,36,38 The largest capacitance of 200 °C-annealed FCF should be attributed to the balance between the conductivity and the amount of functional groups. For the samples annealed at 100 °C, their capacitances may mainly be limited by the poor conductivity of the electrodes. According to Table S1,
† a large amount of
![[double bond splayed left]](https://www.rsc.org/images/entities/char_e009.gif)
COH is attached on the 100 °C-annealed FCF. The
![[double bond splayed left]](https://www.rsc.org/images/entities/char_e009.gif)
COH could exist on the basal plane and edge plane of the carbon electrode surface. Due to the low stability of
![[double bond splayed left]](https://www.rsc.org/images/entities/char_e009.gif)
COH on the basal plane, it could be largely detached at 200 °C, causing the electrons to transfer from σ bond to π bond, hence increasing the conductivity and thus the capacitance.
32,33 As the annealing temperature further increases to 300 °C, a lot of functional groups are detached from the CFs, causing a great reduction of Faradic reactions at the electrodes, resulting in low capacitance. As shown in Table S1,
† the amount ratio of the three functional groups is changing with the annealing temperature. From 200 °C to 300 °C, the amount ratio of –COOH and
![[double bond splayed left]](https://www.rsc.org/images/entities/char_e009.gif)
COH is decreasing, and the areal capacitance of 300 °C-annealed FCF at positive potential is decreasing faster than the capacitance at negative potential (
Fig. 6b and d). As a result, we speculate that the –COOH and
![[double bond splayed left]](https://www.rsc.org/images/entities/char_e009.gif)
COH functional groups have more contribution to the capacitance at positive potential, and the
![[double bond splayed left]](https://www.rsc.org/images/entities/char_e009.gif)
C
![[double bond, length as m-dash]](https://www.rsc.org/images/entities/char_e001.gif)
O has more contribution to the capacitance at negative potential. As depicted in
Fig. 6b and d, when the discharge current density is increased from 3 mA cm
−2 to 20 mA cm
−2, the 200 °C-annealed FCF retains 91.63% of its capacitance for the positive potential and 88.5% for the negative potential, indicating a good rate capability of the FCF. These results convincingly show that after annealing at 200 °C, the amount and the type of functional groups on the FCF just balance the conductivity and capacitance of the electrode.
 |
| Fig. 6 CV curves of 100 °C, 200 °C, and 300 °C-annealed FCF electrodes in 0.5 M Na2SO4 at the scan rate of 100 mV s−1 in an operating window of (a) 0–0.8 V (c) −0.8 to 0 V. Areal capacitance of FCF electrodes annealed at 100 °C, 200 °C and 300 °C in the operating window of (b) 0–0.8 V and (d) −0.8 to 0 V. | |
Fig. 7a and b depict that the 200 °C-annealed FCF electrodes exhibit similar performance at both positive potential and negative potential without any further treatment. It is thus expected that the operating voltage can be expanded to 1.6 V when these electrodes are assembled into a device with the positive electrode and the negative electrode having the same area ratio. In view of this, a solid-state SC device was fabricated using two 200 °C-annealed FCF electrodes. As the functional groups (carbonyl, hydroxyl and carboxylic) are unstable in KOH medium,34 LiCl/PVA is chosen as a solid-state electrolyte to enhance the stability of SCs.36,37
 |
| Fig. 7 (a) CV curves of 200 °C-annealed FCF electrode in 0.5 M Na2SO4 at a scan rate of 100 mV s−1. (b) Comparison of areal capacitance of 200 °C-annealed FCF electrode in 0.5 M Na2SO4 at 0–0.8 V and −0.8 to 0 V. (c) CV curves of solid-state SC with 200 °C-annealed FCFs in LiCl/PVA electrolyte at different operating voltages with the scan rate of 100 mV s−1 (d) galvanostatic charge–discharge curves of the solid-state SC device with 200 °C-annealed FCFs at different operation voltages under a current density of 5 mA cm−2. | |
The CV curves and GCD curves of the SC device were carefully conducted from 0.8 V to 1.6 V (Fig. 7c and d). The device shows stable electrochemical properties at the operating voltage of 1.6 V. Electrochemical impedance spectroscopy (EIS) and cycle life measurements were also conducted to examine the performance of the device. The CV curves of the solid-state SC with scan rate from 20 mV s−1 to 500 mV s−1 under the working voltage between 0 and 1.6 V are shown in Fig. 8a. These CV curves retain rectangular shape with increasing scan rates confirming again a nearly ideal capacitive behavior. The areal capacitance of the solid-state SC (Fig. 8b) is obtained through the GCD curves under different current densities (shown in Fig. S6†). The whole device (including electrodes, separator and electrolyte) with a volume of ∼0.056 cm3 exhibits the highest areal capacitance of 134.8 mF cm−2 (or 2.4 F cm−3) at a current density of 2 mA cm−2 (or 0.036 A cm−3), which is higher than the latest reported in the literatures about carbon fabric based symmetric SCs (SSCs) or ACSs under the same current density such as exfoliated carbon fabric based SSCs (25 mF cm−2),9 MnO2//Fe2O3 based ASCs (1.5 F cm−3)38 and VOx//VN ASCs (1.3 F cm−3).14 Moreover, the SC device shows good rate capacitance, with 70% of areal capacitance retained when the discharge current density increases from 3 mA cm−2 to 20 mA cm−2. Fig. 8c shows the Nyquist plot of the solid-state SC in the frequency region from 1 mHz to 1 MHz measured at equilibrium open circuit potential with 10 mV amplitude. The straight line nearly parallel to the imaginary axis demonstrated the ideal capacitive behavior of the device, and the equivalent series resistance (ESR) of solid-state SC was as small as 4 Ω cm−2 (inset in Fig. 8c). The outstanding performance of the device should be attributed to the following reasons: (i) the FCF electrode has porous channels, providing effective electrolyte transport and active-site accessibility; (ii) the functional groups were attached directly on the highly conducting carbon fiber fabric, promoting faster electron transport and more efficient current collection; (iii) the charges between positive electrode and negative electrode are perfectly balanced giving the largest electrochemical performance of the solid-state SC device.
 |
| Fig. 8 Performance of the solid-state SC device with 200 °C-annealed FCF electrodes in LiCl/PVA electrolyte (a) CV curves at different scan rates. (b) Areal capacitance as a function of current density. (c) Nyquist plot. (d) CV curves of solid-state SC in flat, bent and twisted states at a scan rate of 200 mV s−1. Insets are the device pictures under test conditions. (e) Cycle performance and Coulombic efficiency of the solid-state device at 5 mA cm−2 over 5000 cycles. (f) Ragone plot of the studied SC devices with other reported values for comparison. Inset shows a single SC device powers a LED (1.2 V). | |
In order to demonstrate the good performance of the solid-state SC device for energy storage in flexible electronic system, the stability of the device under various bending conditions was performed. The CV curves under flat, bent and twisted conditions are shown in Fig. 8d. By virtue of the good flexibility, the SC could be arbitrarily bent and twisted without affecting the device performance. Considering the long-term stability, the cycling performance of the SC device was conducted in the 1.6 V operating voltage, at a current density of 5 mA cm−2 for 5000 cycles (Fig. 8e). A total capacitance of the device still remains nearly 90%, and the coulombic efficiency defined as the discharging time divided by charging time ratio remains about 100%, indicating the good long-term stability of the SC. As an energy storage component, the energy density and power density are equally important to evaluate the performance of SCs. The relationship between the volumetric energy density and power density is shown in Fig. 8f.
As compared with previous results, the FCF-based SC device has a considerable energy density and power density which is higher than the values reported for many other carbon fabric based solid-state SCs.9,11,14,38 The highest volumetric energy density of the studied SC device, calculated based on the volume of the whole device is 0.83 mW h cm−3 which is higher than the H-ZnO@MnO2 based SSC (0.04 mW h cm−3),11 activated carbon cloth based SSCs (0.05 mW h cm−3),9 VOx//VN based ASC (0.61 mW h cm−3)14 and MnO2//Fe2O3 based ASC (0.55mW h cm−3)38 (see Table S2 for detailed comparison†). More importantly, the FCF-SC also exhibits a remarkable power density of 1.59 W cm−3, indicating good power output ability. For application consideration, we use a single SC device to light a light-emitting-diode (LED). After charging at 10 mA cm−2 to 1.6 V, the SC device at bent condition could light up a LED for over 5 min, revealing the potential of the FCF device in energy storage.
3. Experimental section
3.1. Preparation of functionalized carbon fabric
At first, the carbon fiber fabrics (2 cm × 0.7 cm × 0.025 cm) were cleaned with acetone, ethanol and deionized water for several times and dried at room temperature. Then the cleaned CFs were functionalized via an electrochemical corrosion method using a solution of 1 M H2SO4. A typical three-electrode configuration measurement was conducted with CF as the working electrode, a graphite rod as the counter electrode and an Ag/AgCl electrode as the reference electrode. A constant voltage of 2.2 V was kept for 20 min during the corrosion process. The samples were cleaned with deionized water after corrosion. Then the CFs were annealed in air atmosphere for three hours using a furnace. The annealing temperatures were 100 °C, 200 °C and 300 °C.
3.2. Preparation of KOH activated CF
The KOH activated CF was prepared based on the reported procedures.39 CF and KOH were mixed at room temperature with the KOH/CF weight ratio being 10/1. The KOH and CF mixture was then put into a tube furnace with argon flowing and heated at 800 °C for 1 hour. After the heat treatment, the CF were cleaned with 5 M HCL and deionized water for several times.
3.3. Fabrication of solid-state SCs
The LiCl/PVA gel was prepared by mixing 12.5 g of LiCl, 6 g of PVA and 60 mL of deionized water. The whole mixture was heated to 85 °C under stirring until the solution became clear. Two pieces of 200 °C-annealed FCF were immersed into LiCl/PVA gel for 5 min, and then sandwiched with a separator (NKK TF40, 40 μm) in the middle. Then the device were clipped tightly (to decrease the contact resistance between electrodes) by two glass sheets to narrow the space between two electrodes and dried in an oven at 40 °C for 12 h.
3.4. Material characterization and electrochemical measurement
The morphology and structure of the samples were characterized by field-emission scanning electron microscopy (FE-SEM, FEI Nova 450 Nano). The analysis of the FCF surface properties was conducted by TGA & DSC (Netzch STA 449C, Jupiter), Fourier transform infrared absorption spectra (FTIR, Nicolet Avatar 360), X-ray photoelectron spectroscopy (XPS, PHI 5600) and Raman spectroscopy (HORIBA HR800). The cyclic voltammetry (CV) and galvanostatic charge–discharge measurements were investigated using a standard electrode cell with a conventional three-electrode configuration by CHI 660D electrochemical workstation. The electrochemical impedance spectroscopy (EIS) was measured by an Autolab PGSTAT302N with a frequency from 1 mHz to 1 MHz with a potential amplitude of 10 mV. The cycle life was tested by a battery test system (LAND, CT2001A).
4. Conclusions
In summary, we have developed a high performance FCF electrode with large operating window through a simple oxidation and annealing method. The oxidation and annealing method provides a simple and low-cost strategy to fabricate high-performance carbon-based SCs depending on the redox reactions of different functional groups. The as-prepared FCF electrodes have been further assembled into a flexible solid-state SC device. This stable and flexible SC device shows a high electrochemical performance with a maximum energy density of 0.83 mW h cm−3 at a current density of 2 mA cm−2 and a maximum power density of 1.59 W cm−3 at a current density of 20 mA cm−2. This study demonstrates a promising pathway to development of high-performance SCs based on optimized FCF electrodes for efficient energy storage and flexible electronics applications.
Acknowledgements
Authors H. Y. Jin and Z. H. Peng contributed equally to this work. The authors would like to thank Xu Xiao, Tianqi Li, Bin Yao and Jun Zhou for their helpful advice and technical assistance.
Notes and references
- B. E. Conway, Electrochemical Supercapacitor: Scientific Fundamentals and Technological Applications, Kluwer Academic/Plenum, New York, 1999 Search PubMed.
- P. Simon and Y. Gogotsi, Nat. Mater., 2008, 7, 845–854 CrossRef CAS PubMed.
- X. Li, J. Liu, Y. Zhang, Y. Li, H. Liu, X. Meng, J. Yang, D. Geng, D. Wang, R. Li and X. Sun, J. Power Sources, 2012, 197, 238–245 CrossRef CAS PubMed.
- X. Li, D. Geng, Y. Zhang, X. Meng, R. Li and X. Sun, Electrochem. Commun., 2011, 13, 822–825 CrossRef CAS PubMed.
- J. R. Miller and P. Simon, Science, 2008, 321, 651–652 CrossRef CAS PubMed.
- M. F. El-Kady, V. Strong, S. Dubin and R. B. Kaner, Science, 2012, 335, 1326–1330 CrossRef CAS PubMed.
- Y. Gogotsi and P. Simon, Science, 2011, 334, 917–918 CrossRef CAS PubMed.
- J. Lin, C. Zhang, Z. Yan, Y. Zhu, Z. Peng, R. H. Hauge, D. Natelson and J. M. Tour, Nano Lett., 2013, 13, 72–78 CrossRef CAS PubMed.
- G. Wang, H. Wang, X. Lu, Y. Ling, M. Yu, T. Zhai, Y. Tong and Y. Li, Adv. Mater., 2014, 26, 2676–2682 CrossRef CAS PubMed.
- X. Xiao, T. Li, P. Yang, Y. Gao, H. Jin, W. Ni, W. Zhan, X. Zhang, Y. Cao, J. Zhong, L. Gong, W. C. Yen, W. Mai, J. Chen, K. Huo, Y. L. Chueh, Z. L. Wang and J. Zhou, ACS Nano, 2012, 6, 9200–9206 CrossRef CAS PubMed.
- P. Yang, X. Xiao, Y. Li, Y. Ding, P. Qiang, X. Tan, W. Mai, Z. Lin, W. Wu, T. Li, H. Jin, P. Liu, J. Zhou, C. P. Wong and Z. L. Wang, ACS Nano, 2013, 7, 2617–2626 CrossRef CAS PubMed.
- L. Yuan, X. H. Lu, X. Xiao, T. Zhai, J. Dai, F. Zhang, B. Hu, X. Wang, L. Gong, J. Chen, C. Hu, Y. Tong, J. Zhou and Z. L. Wang, ACS Nano, 2012, 6, 656–661 CrossRef CAS PubMed.
- X. Xiao, T. Ding, L. Yuan, Y. Shen, Q. Zhong, X. Zhang, Y. Cao, B. Hu, T. Zhai, L. Gong, J. Chen, Y. Tong, J. Zhou and Z. L. Wang, Adv. Energy Mater., 2012, 2, 1328–1332 CrossRef CAS.
- X. Lu, M. Yu, T. Zhai, G. Wang, S. Xie, T. Liu, C. Liang, Y. Tong and Y. Li, Nano Lett., 2013, 13, 2628–2633 CrossRef CAS PubMed.
- X. Xiao, X. Peng, H. Jin, T. Li, C. Zhang, B. Gao, B. Hu, K. Huo and J. Zhou, Adv. Mater., 2013, 25, 5091–5097 CrossRef CAS PubMed.
- M. R. Lukatskaya, O. Mashtalir, C. E. Ren, Y. Dallagnese, P. Rozier, P. L. Taberna, M. Naguib, P. Simon, M. W. Barsoum and Y. Gogotsi, Science, 2013, 341, 1502–1505 CrossRef CAS PubMed.
- M. F. El-Kady and R. B. Kaner, Nat. Commun., 2013, 4, 1475 CrossRef PubMed.
- D. Pech, M. Brunet, H. Durou, P. Huang, V. Mochalin, Y. Gogotsi, P. L. Taberna and P. Simon, Nat. Nanotechnol., 2010, 5, 651–654 CrossRef CAS PubMed.
- E. Frackowiak, Phys. Chem. Chem. Phys., 2007, 9, 1774–1785 RSC.
- J. Yan, Z. Fan, W. Sun, G. Ning, T. Wei, Q. Zhang, R. Zhang, L. Zhi and F. Wei, Adv. Funct. Mater., 2012, 22, 2632–2641 CrossRef CAS.
- L. F. Chen, Z. H. Huang, H. W. Liang, Q. F. Guan and S. H. Yu, Adv. Mater., 2013, 25, 4746–4752 CrossRef CAS PubMed.
- M. Seredych, D. Hulicova-Jurcakova, G. Q. Lu and T. J. Bandosz, Carbon, 2008, 46, 1475–1488 CrossRef CAS PubMed.
- K. Okajima, K. Ohta and M. Sudoh, Electrochim. Acta, 2005, 50, 2227–2231 CrossRef CAS PubMed.
- J. Shen, A. Liu, Y. Tu, G. Foo, C. Yeo, M. B. Chan-Park, R. Jiang and Y. Chen, Energy Environ. Sci., 2011, 4, 4220–4229 CAS.
- S. L. Candelaria, B. B. Garcia, D. Liu and G. Cao, J. Mater. Chem., 2012, 22, 9884–9889 RSC.
- R. Borgohain, J. Li, J. P. Selegue and Y. T. Cheng, J. Phys. Chem. C, 2012, 116, 15068–15075 CAS.
- G. Lota, J. Tyczkowski, R. Kapica, K. Lota and E. Frackowiak, J. Power Sources, 2010, 195, 7535–7539 CrossRef CAS PubMed.
- J. Yan, Q. Wang, T. Wei, L. Jiang, M. Zhang, X. Jing and Z. Fan, ACS Nano, 2014, 8, 4720–4729 CrossRef CAS PubMed.
- X. Xiao, T. Li and Z. Peng, et al., Nano Energy, 2014, 6, 1–9 CrossRef CAS PubMed.
- Y. R. Nian and H. Teng, J. Electrochem. Soc., 2002, 149, A1008–A1014 CrossRef CAS PubMed.
- Q. Cheng, J. Tang, J. Ma, H. Zhang, N. Shinya and L. C. Qin, J. Phys. Chem. C, 2011, 115, 23584–23590 CAS.
- T. S. Sreeprasad and V. Berry, Small, 2013, 9, 341–350 CrossRef CAS PubMed.
- S. H. Yu, D. E. Conte, S. Baek, D. C. Lee, S. K. Park, K. J. Lee, Y. Piao, Y. E. Sung and N. Pinna, Adv. Funct. Mater., 2013, 23, 4293–4305 CrossRef CAS.
- E. Frackowiak and F. Béguin, Carbon, 2001, 39, 937–950 CrossRef CAS.
- C. E. Banks, T. J. Davies, G. G. Wildgoose and R. G. Compton, Chem. Commun., 2005, 829–841 RSC.
- G. Wang, X. Lu, Y. Ling, T. Zhai, H. Wang, Y. Tong and Y. Li, ACS Nano, 2012, 6, 10296–10302 CrossRef CAS PubMed.
- X. Lu, G. Wang, T. Zhai, M. Yu, S. Xie, Y. Ling, C. Liang, Y. Tong and Y. Li, Nano Lett., 2012, 12, 5376–5381 CrossRef CAS PubMed.
- P. Yang, Y. Ding, Z. Lin, Z. Chen, Y. Li, P. Qiang, M. Ebrahimi, W. Mai, C. P. Wong and Z. L. Wang, Nano Lett., 2014, 14, 731–736 CrossRef CAS PubMed.
- V. Barranco, et al., J. Phys. Chem. C, 2010, 114, 10302–10307 CAS.
Footnote |
† Electronic supplementary information (ESI) available. See DOI: 10.1039/c4ra04864d |
|
This journal is © The Royal Society of Chemistry 2014 |
Click here to see how this site uses Cookies. View our privacy policy here.