Generation of oxygen vacancies in visible light activated one-dimensional iodine TiO2 photocatalysts

Wenjuan Liab, Robert Liangbc, Anming Hubd, Zhaohui Huanga and Y. Norman Zhou*bc
aSchool of Materials Science and Technology, China University of Geosciences, Beijing 100083, P.R. China
bDepartment of Mechanical and Mechatronics, University of Waterloo, Waterloo N2L 3G1, Ontario, Canada. E-mail: nzhou@uwaterloo.ca; Tel: +1-519-888-4567 ext. 36095
cWaterloo Institute for Nanotechnology, University of Waterloo, Waterloo, ON N2L 3G1, Ontario, Canada
dMechanical, Aerospace, & Biomedical Engineering Department, University of Tennessee – Knoxville, Knoxville, TN 37996-2210, USA

Received 20th May 2014 , Accepted 6th August 2014

First published on 6th August 2014


Abstract

A facile and efficient way of generating oxygen vacancies in visible light activated one-dimensional iodine doped TiO2 photocatalysts was first reported in this work. A two-step hydrothermal synthesis was used to synthesize TiO2 nanomaterials modified by iodic acid (HIO3) as a dopant. Detailed analysis was conducted to illustrate the intrinsic doping/reaction mechanisms of iodic acid in the modification of the TiO2 matrix. The phase and structure evolution were deduced from X-ray diffraction (XRD), Raman, and scanning electron microscopy (SEM). X-ray photoelectron spectroscopy (XPS) was conducted to analyze the generation of oxygen vacancies and the formation of I–O–Ti bonds in the TiO2 lattice. Multi-valences of iodine, due to the reduction of iodic acid, facilitated the generation of oxygen vacancies and 3d state Ti3+ species in the TiO2 lattice. The visible light absorption and enhanced photocatalytic activity of the TiO2 nanomaterials were attributed to existing oxygen vacancies, iodine multi-valences in I–O–Ti bonds, and 3d state Ti3+ sites in the TiO2 lattice. The photocatalytic degradation efficiency under visible light (λ > 400 nm) followed a pseudo first-order kinetic model. Rutile nanowires using a two-step synthesis method produced the highest methylene blue (10 mg L−1) degradation rate constant, Kap, of 7.92 × 10⁻³ min−1 compared to other synthesized nanomaterials. The Kap value obtained was an order of magnitude greater than commercial P25 (3.87 × 10⁻⁴ min−1) and pristine TiO2 nanowires (4.18 × 10⁻⁴ min−1). The iodine doped TiO2 photocatalysts can be used in TiO2/light irradiation advanced oxidation processes (AOPs) in water treatment using sunlight or a visible light source, rather than an ultraviolet irradiation source.

1. Introduction

Since the discovery of photoelectrochemical splitting of water on n-TiO2 electrodes,1 semiconductor-based TiO2 materials have been investigated extensively as photocatalysts for solar energy conversion,2–4 photoelectrochemical processes,5,6 and environmental applications.7,8 TiO2 nanomaterials are regarded as good photocatalysts because of their chemical and thermal stability, availability, nontoxicity, and biocompatibility.1–3 TiO2 photocatalysts are able to degrade environmental pollutants in the ultraviolet wavelength range effectively; however, the energy efficiency of these photocatalysts is low using solar light because only 3–5% of solar energy exists in the ultraviolet range. Another drawback of TiO2 photocatalysts are the high recombination rates of photo-induced electron–hole pairs that further reduce their efficiency. In order to completely utilize solar energy, it is of great importance to develop photocatalysts that are able to generate electron–hole pairs via visible light excitation.

Over the past few decades, research work has been done aiming at expanding photoabsorption to the visible light region and enhancing the photocatalytic activities of TiO2 by doping either non-metal (N,9–11 C,12–14 S,15 I,16–19) or metal atoms (Fe,20 Ag,21 Mo,22 Cu,23 Au[thin space (1/6-em)]24). Among these modifications, non-metal doped TiO2 materials exhibit promising visible driven photocatalytic activities compared to pristine or other metal doped TiO2 materials. The band gap modification using non-metals does not create recombination centers that occur with metal doping.11

Iodine has also been extensively used for visible light activated TiO2 photocatalysts with multiple chemical states of iodine. The different chemical states of iodine in TiO2 dramatically affect their photocatalytic activity.16–19 Iodine doping and surface modification may also induce oxygen vacancies and oxygen sub-stoichiometry, which lowers the bandgap of photocatalysts.25–27 Oxygen defects, which lie close to the conduction band (CB) of titania, can act as active electron traps. Electrons and holes can be promoted to the surface by visible light absorption where they are involved in degradation of pollutant.26 TiO2 with a high oxygen deficiency may possess visible-light absorption and photocatalytic activities under the irradiation of light wavelengths longer than 400 nm, and the overlap between the oxygen defect states and titania CB states leads to a band gap decrease.27

A facile and effective way of generating oxygen vacancies in one-dimensional TiO2 photocatalysts through iodine modification was first reported in this work. The enhanced visible activated iodine modified TiO2 nanomaterials were obtained via simple two-step hydrothermal synthesis. The products were characterized by X-ray diffraction (XRD), Raman spectroscopy, Scanning electron microscopy (SEM) characterization, X-ray photoelectron spectroscopy (XPS) and UV-Vis diffuse reflectance spectra (UV-DRS). The nature of the extended absorption edge, visible light driven photocatalytic activity, and microstructures in iodine modified TiO2 were investigated in terms of both phase evolution and surface/bulk oxygen defects. The chemical reactions of iodine (HIO3) and its doping mechanisms along with detailed XPS analysis on the generation of Ti3+ sites, I–O–Ti bonds, and oxygen vacancies were revealed. The formation of I–O–Ti bonds substitution via I5+ substitution with Ti4+ was also discussed.

2. Experimental methods

2.1 Material synthesis

2.1.1 One-step synthesis of iodine modified TiO2. A modified hydrothermal synthesis using Aeroxide™ P25 (Evoniks Industries) and iodic acid (HIO3, 99.99% Sigma-Aldrich Chemicals) was employed followed by calcination for the samples in this work.17 In a typical experiment, 2 g of P25 was dissolved in a 10 M NaOH alkaline solution by adding HIO3 (molar ratio of Ti[thin space (1/6-em)]:[thin space (1/6-em)]I = 1[thin space (1/6-em)]:[thin space (1/6-em)]0.5) into the solution; then the fully mixed solution was transferred into a Teflon-lined stainless steel autoclave. The autoclave was placed in a furnace where the temperature was set to 150 °C or 250 °C for 24 hours. The resultant white precipitate was washed multiple times with MilliQ water (resistivity: 18.2 Ω cm) to remove excess ions. The wet powder was then filtered and dried in an oven at 80 °C overnight. The dried powder was calcined at 450 °C for 2 h in a furnace to obtain iodine modified TiO2. The prepared samples were labelled as 1-I/TiO2-150 and 1-I/TiO2-250 denoting the temperatures that the nanomaterials were synthesized. For comparison, a reference sample of pristine TiO2 nanowires (NWs) were hydrothermally synthesized following the same procedure at 260 °C except without the addition of iodic acid. The dried products were calcined at a temperature of 700 °C to improve the crystallinity of anatase.8
2.1.2 Two-step synthesis of iodine modified TiO2. To understand the mechanisms of visible light induced photocatalytic activity of the iodine modified TiO2 nanomaterials, samples were synthesized via a two-step process. In the first step, pristine TiO2 NWs was prepared following the same procedure for our reference TiO2 NWs. In the second-step, HIO3 (molar ratio of Ti[thin space (1/6-em)]:[thin space (1/6-em)]I = 1[thin space (1/6-em)]:[thin space (1/6-em)]0.5) was added into a solution containing 10 M NaOH alkaline solution and pristine TiO2 NWs produced in the first step. The mixed solution was transferred to an autoclave and heated at 150 °C or 250 °C. The samples were dried at 80 °C overnight and a post-calcination was employed at 450 °C to obtain samples of 2-I/TiO2-150, 2-I/TiO2-250, respectively.

2.2 Microstructure, phase and photocatalytic characterizations

The phase and microstructure of fabricated specimens were examined using X-ray diffraction (XRD, Bruker D8 FOCUS, US) and field emission scanning electron microscopy (SEM, LEO-Ultra, GEMINI, Germany). X-ray photoelectron spectrum (XPS) measurements were carried out using a multi-technique ultra-high vacuum imaging XPS microprobe spectrometer (Thermo VG Scientific ESCALab 250) equipped with a hemispherical analyzer (of 150 mm mean radius) and non-monochromatic Al Kα from a twin anode X-ray source. The spectrometer was calibrated using a carbon source at C 1s (binding energy of 284.6 eV) with respect to the Fermi level. The chamber vacuum level was maintained at 5 × 10⁻⁹ mbar. An emission current of 0.2 mA were used for charge compensation during the analysis. The elemental composition was calculated from XPS spectra using CasaXPS software. Raman spectroscopy was conducted using a Renishaw micro-Raman spectrometer with a He–Ne ion laser at an excitation wavelength of 633 nm. The spectral resolution of the Raman shift is 0.5 cm−1. The absorption edge and band gap energy of the products were determined through the diffuse reflectance spectra which was measured using a UV-Vis-NIR spectrophotometer with an integrated spherical detector (UV-2501PC, Shimadzu, Japan) in the range of 200 nm to 800 nm. BaTiO3 was used as a reference material to obtain reflectance data.

The visible light photocatalytic activity of the prepared samples was studied by the photodegradation of methylene blue (MB) in aqueous solution. In a typical experiment, 20 mg of prepared TiO2 photocatalysts were dispersed into 50 mL of MB solution (0.03 mM). Before illumination, the suspension was kept in the dark at room temperature by magnetic stirring for 60 min. Photocatalytic degradation was assessed in the presence or absence of simulated visible light irradiation provided by a 150 W Xenon lamp (Newport, USA) equipped with a 400 nm cut-off filter (Thorlabs, USA). The irradiance was 4.4 W m−2 at 0.2 m from the end of the collimating column. During the photoreaction process, aliquots of 5 mL were collected at specific time points. The collected aliquots were centrifuged at 3000 rpm to remove remaining photocatalysts and the concentration of MB was determined by UV-Vis spectroscopy at 663 nm using a standardized calibration curve.

3. Results and discussion

3.1 Characterization of crystal structure and morphology

X-ray diffraction (XRD) patterns of as-prepared one-step iodine modified samples and pristine TiO2 nanowires are shown in Fig. 1. Anatase (JCPDS Card no. 21-1272) peaks are found at 2θ values of 24.8°, 37.3°, 47.6°, 53.5°, 55.1° and 62.2°; these correspond to (101), (004), (200), (105), (211) and (204) crystal planes.8 Rutile (JCPDS Card no. 21-1276) peaks are found at 2θ values of 27.0°, 35.6°, 40.8°, 54.0°, 53.9°, 56.1°, and 61.0°; these correspond to crystal planes of (110), (101), (200), (111), (210), (211), (220), (002) and (310).8 The anatase phase is obtained in our reference sample. For the one-step iodine modified TiO2 samples, the anatase phase is maintained under a low processing temperature of 150 °C, while the rutile phase is prevalent at a higher processing temperature of 250 °C. Rutile TiO2 is usually obtained via high temperature (greater than 800 °C) calcination of anatase or in an acidic hydrothermal process.28–33 In our research, the coexistence of an acidic component (HIO3) and a basic component (NaOH) can facilitate the formation of anatase and rutile at 150 °C and 250 °C, respectively. The XRD diffraction peaks in the one-step process are similar to that of the two-step process (Fig. S1 in ESI).
image file: c4ra04768k-f1.tif
Fig. 1 X-ray diffraction spectra of as prepared (a) Pristine TiO2 NWs, (b) 1-I/TiO2-150, and (c) 1-I/TiO2-250.

Raman analysis (Fig. 2) was also conducted to further verify the phase of the one-step samples. The peaks observed match well with the characteristic peaks of anatase12.13 at Raman shifts of 143 (E1g), 196 (E2g), 395 (B1g), 514 (A1g), 638 (E3g) cm−1, with respect to the reference sample and the iodine modified sample at 150 °C. For modified samples at 250 °C, the other observed Raman peaks at around 142 (B1g), 445 (Eg) and 609 (A1g) cm−1 are all characteristic peaks of rutile.8,28 Additionally, second-order scattering features of rutile can also be observed, with prominent shifts at 235 cm−1 and 252 cm−1 as multi-photon vibration modes.8,34 This observation is in agreement with those obtained from the X-ray diffraction data (Fig. 1). The Raman characteristic peaks for the one-step process are similar to the two-step process (Fig. S2 in ESI).


image file: c4ra04768k-f2.tif
Fig. 2 Raman spectra of as prepared (a) Pristine TiO2 NWs, (b) 1-I/TiO2-150, and (c) 1-I/TiO2-250.

Scanning electron microscopy (SEM) morphologies of TiO2 NWs and iodine modified TiO2 are given in Fig. 3. Fig. 3a–d depict TiO2 nanomaterial structures synthesized under a one-step process, whereas Fig. 3e and f show TiO2 nanomaterial structures synthesized under a two-step process. Fig. 3a and b represent pristine TiO2 NWs that have a width of 50–200 nm and lengths in the micron-scale. These results are similar with previous literature in which the same hydrothermal procedure was adopted.31,32 The iodine modified samples at 150 °C have a fine particle-like (Fig. 3c – one-step) and a sheet-like (Fig. 3e – two-step) morphology consisting of aggregated particles having poor crystal growth, which is shown in the XRD results. Additionally, Fig. 3d (one-step) and Fig. 3f (two-step) depict evenly distributed TiO2 rutile nanowires processed at 250 °C. These TiO2 nanowires are hundreds of nm in width and several microns in length and are bundled together. The inset image of Fig. 3d shows the rutile TiO2 nanowires at a higher magnification.


image file: c4ra04768k-f3.tif
Fig. 3 SEM images of as prepared (a) pure anatase TiO2 NWs; (b) specific magnification (black area in (a)) of TiO2 NWs; (c) anatase fine-particles in 1-I/TiO2-150; (d) rutile phase NW in 1-I/TiO2-250, the inset shows the magnification image of specific area in (d); (e) anatase sheet structure in 2-I/TiO2-150; and (f) rutile phase NW in 2-I/TiO2-250.

3.2 Measurement of UV-Vis diffuse reflectance spectra

The UV-Vis diffusion reflectance spectra (DRS) of pristine TiO2 NWs (Fig. 4a) and iodine modified samples (Fig. 4b and c). The DRS spectra indicates a red shift from 380 nm to values between 410–480 nm at the two synthesis temperatures (150 °C and 250 °C). The indirect bad gap energies (Eg) of the samples were calculated by plotting [F(R)]1/2 vs. Band energy (inset of Fig. 4) using the Kubelka–Munk theory, which usually applies to high-scattering materials including impurity-doped solids.35 The bandgap energy of pristine TiO2 nanowires and anatase nanowires synthesized at 150 °C is about 3.16 eV; this value is red shifted to 2.92 eV for rutile nanowires synthesized at 250 °C. The absorption tails in the spectra of 1-I/TiO2-150 (Fig. 4b) reflects the low energy electron density states on the bottom of the conduction band, while the slope reflects an increase of high energy electron density states.22 The absorption edge of 1-I/TiO2-250 (Fig. 4c) shows a stronger red shift compared to 1-I/TiO2-150 due to the presence of the rutile phase.
image file: c4ra04768k-f4.tif
Fig. 4 Diffuse reflectance spectra of as prepared (a) TiO2 NWs, (b) 1-I/TiO2-150, and (c) 1-I/TiO2-250. The inset presents the plot of [F(R)]1/2 vs. photo energy of as prepared (a) TiO2 NWs, (b)1-I/TiO2-150, and (c) 1-I/TiO2-250.

3.3 X-ray photoelectron spectroscopy

The surface chemical states of as-prepared samples were analyzed by XPS. The XPS survey shown in Fig. 5a reveals that the samples mainly contains Ti, O, C, from which, no obvious I 3d binding peaks were observed at 619 eV (I 3d 5/2) and 632 eV (I 3d 3/2), in accordance to the XPS database from the National Institute of Standards and Technology (NIST). Compared with the relatively high contents of oxygen and titanium, it was difficult to detect the XPS spectra of iodine from survey spectra because of the low content of iodine dopant. The C 1s at 284.6 eV is adopted as the reference peak for the calibration of all the binding energies. Fig. 5b shows the high-resolution C 1s XPS spectra of as-prepared samples. A broad energy range from 282 eV to 292 eV can be observed. By deconvoluting these peaks, the binding energy at 283.4 eV can be ascribed to carbon substituting for oxygen atom in the lattice of TiO2, forming the O–Ti–C bond, while the peaks around 286.4 eV and 288.7 eV correspond to C–O bonds and C[double bond, length as m-dash]O bonds, respectively.12,13 Using a high resolution spectra, chemical states of I 3d peaks are shown in Fig. 5c, in which evidence for the doped iodine is observed. The shift of I 3d 5/3 from 622 eV for HIO3 to 620 eV may arise from the energetically favorable substitution from Ti4+ (with radius of 0.64 nm) to I5+ (with radius of 0.62 nm).16 These iodine peaks only appear in samples at 150 °C as revealed by the XPS analysis. In terms of samples prepared at 250 °C, no high resolution iodine spectrum could be observed, which could be due to the promoted decomposition of iodine oxides to vaporized I2.
image file: c4ra04768k-f5.tif
Fig. 5 XPS spectra of (a) survey spectrum, (b) C 1s calibration curves, and (c) I 3d spectra in 1-I/TiO2-150.

The oxygen (O 1s) and titanium (Ti 2p) binding regions are shown in Fig. 6. It is worth noting that the peaks of the oxygen show different chemical states with different integrated areas in different samples. The two main O 1s peaks are attributed to O2− (528.2 eV–529.5 eV) and oxygen vacancies, O* (531.1–533.5 eV).36 Deconvolution of the peaks reveals that the number of oxygen vacancies (O* in TiO2−x around 531.1 eV–533.5 eV) increases as the hydrothermal temperature increases (Table 1).


image file: c4ra04768k-f6.tif
Fig. 6 XPS spectra of O 1s spectrum in different samples: (a) 1-I/TiO2-150, (b) 1-I/TiO2-250, (c) 2-I/TiO2-150, and (d) 2-I/TiO2-250. The inset figure corresponds to the Ti 2p spectra of each sample.
Table 1 Oxygen states and titanium states in iodine modified samples under various synthesis conditions
Samples O 1s (at. %) Ti 2p (at. %)
O* (TiO2−x) O2− (TiO2) O* (I2O5−x) O2− (I2O5) Ti3+ (TiO2−x) Ti4+ (TiO2) Ti3+ (I–O–Ti)
1-I/TiO2-150 20.90 30.05 32.21 16.83 56.35 11.62 32.03
2-I/TiO2-150 41.70 21.33 23.94 13.03 33.29 19.13 47.58
1-I/TiO2-250 55.58 41.88 2.54 28.02 71.98
2-I/TiO2-250 64.08 35.92 39.61 60.39


The residual iodine was present at samples synthesized at lower temperatures (Fig. 6a and c) and XPS analysis revealed iodine oxide deconvoluted peaks at 530 eV (O2− in I2O5) and 533 eV (O* in I2O5−x); no such peaks appear in Fig. 6b and d. In addition, the O* in I2O5−x has a binding energy ranging from 532.8 eV to 533.6 eV. This indicates the formation of I–O–Ti bonds in the TiO2 matrix from the substitution of I5+ with Ti4+.18 In the inset figures of Ti 2p XPS spectrum, the two peaks at 455.6 eV and 462.8 eV correspond to the different oxidation states of Ti, which are attributed to Ti3+ (458.1 eV) and Ti4+ (463.4 eV) sites. These Ti3+ species exist from the reduction of Ti4+ by the free electrons that are left from oxygen vacancies.11,37 Table 1 illustrates the detailed atomic percentage for each chemical state. By comparing the relative contents of both Ti3+ species and Ti4+ species under both synthesis processes (one-step and two-step), Ti3+ species were found in higher concentrations at 150 °C than at 250 °C.

3.4 Iodine modified TiO2: a chemical reaction mechanistic view

With the existence of iodic acid in the reaction system, an oxidative environment is created due to the existence of I5+, which has a high reactivity and tendency to form iodine oxides with multivalences of iodine (i.e. I2O4, I4O9 as I2O5−x), which accept oxygen atoms from the TiO2 lattice. Consequently, the substitution of I5+ for Ti4+ in the form of an I–O–Ti bond creates oxygen vacancies in TiO2 matrix.16,17 The reversible equilibrium reactions for Ti4+ and O2− are given:36
 
Ti4+ + 2O2− ↔ O2 + Ti3+ + 3e (1)
 
image file: c4ra04768k-t1.tif(2)
 
Ti4+ + e → Ti3+ (3)
where O stands for the charge balanced oxygen atoms in titania, VO2+ stands for the oxygen vacancies.

The decomposition of iodic acid (HIO3) leads to the formation of I2O5. The amorphous phase in the samples contributes to surface oxygen defects or the adsorption of iodine oxides on the surface of TiO2 crystals.33 Oxygen vacancies were generated in the lattice of TiO2, which is mainly caused by the reduction of I5+ to lower multi-valance states. During the reduction reaction of I5+, free electrons were released and oxygen vacancies were generated in the lattice of TiO2; at the same time, the free electrons participate in the reduction of Ti4+ to Ti3+ (eqn 3). At 250 °C, the decomposition and reduction process of I2O5 consumes more free electrons from oxygen atoms, which produce more oxygen vacancies in TiO2 (eqn 2); this leads to less electrons being available that contribute to the generation of Ti3+ being restricted (eqn 3). The following reactions occur to iodine acid (HIO3):16

 
image file: c4ra04768k-t2.tif(4)
 
image file: c4ra04768k-t3.tif(5)
where Δ stands for energy in the form of heat. I2O5−x (I5+) is reduced to lower valence states (I3+ or I2):
 
I5+ + 2e → I3+ (6)
 
I5+ + 10e → 5I2 (7)

The I5+ ions can act as electron acceptors when reducing to lower multi-valance states. The efficient electron scavenging by these multi-valance iodine ions contributes to the efficient separation of electron–hole pairs.19 Additionally, increased oxygen vacancies are generated (via eqn 2) through the reducing reaction with the accompaniment of increased substitution of I5+ for Ti4+ in I–O–Ti bonds. The equilibrium reaction between Ti4+ and O2− is restricted at high temperatures of 250 °C, and less Ti3+ sites are generated; however, more oxygen vacancies (by releasing electrons for the reduction of I2O5−x) are produced inside the TiO2 lattice than the relative contents produced at 150 °C.

3.5 Evaluation of visible light photocatalytic activity

The visible light photocatalytic degradation of all samples was studied using methylene blue (MB) in aqueous solution. The MB concentration was determined using a calibration curve generated by spectrophotometry of premade standards. To indicate the decomposition efficiency, the photocatalytic activity of the catalysts can be quantitatively evaluated by obtaining the apparent reaction rate constant (Kap) from a pseudo-first-order kinetic reaction. The kinetic equation is expressed as:22
 
ln(C0/C) = Kapt, (8)
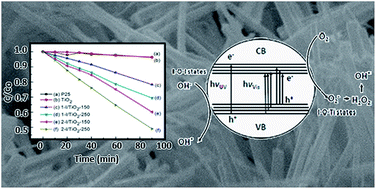
where, C0 and C are the initial and final concentration and t is the irradiation time, respectively. The photocatalytic degradation of MB under visible light irradiation is shown Fig. 7a and b. P25 is used as a performance benchmark to compare the synthesized TiO2 photocatalysts. Theoretically, the pristine anatase TiO2 NWs or commercial P25 do not show a visible light photocatalytic activity due to the large band gap of anatase. As shown in Fig. 7a, neither P25 nor TiO2 NWs shows significant photodegradation under visible light irradiation, in which the degradation rate is limited to 3.6% and 3.8%, respectively, within experimental error range. The modified samples in our research show an increased photodegradation under visible light irradiation.

image file: c4ra04768k-f7.tif
Fig. 7 Degradation of 0.03 mM methylene blue (MB) using various catalysts at concentrations of 0.4 g L−1 for 90 min under visible irradiation (λ > 400 nm). (a) Normalized concentration (C/C0) as a function of irradiation time; (b) ln(C0/C) as a function of irradiation time.

The surface area of each sample was characterized by the BET method (Table 2), since it is one of the important factors that influence the photocatalytic activity. According to literature, without considering other factors such as the choice of irradiation source, electronic properties, and optical absorption, large surface area nanomaterials tend to have increased degradation efficiency because of increased adsorption capacity and higher chemical reactivity. The change in surface area affects the photoactivity of the anatase samples. The anatase nanoparticle clusters (two-step) have larger surface areas compared to the anatase nanoparticles (one-step) and the rutile nanowires.

Table 2 Properties of synthesized TiO2 samples and their visible-light efficiencies
Samples Phase Morphology Specific surface area (m2 g−1) Band gap (eV) Degradation rated (%) Kapc (10−3 min−1)
a A = anatase.b R = rutile.c Kap = apparent constant value.d Degradation of 0.03 mM methylene blue (MB) with catalysts dosage of 0.4 g L−1 for 1.5 h under visible irradiation (λ > 400 nm).
P25 Aa + Rb Nanoparticle 52 3.05 3.6 0.387
Pristine TiO2 A Nanowire 21.52 3.16 3.8 0.418
1-I/TiO2-150 A Nanoparticle cluster 189.37 3.08 21.7 2.71
1-I/TiO2-250 R Nanowire 76.53 2.92 30.6 4.07
2-I/TiO2-150 A Nano sheet cluster 321.44 3.16 39.9 5.50
2-I/TiO2-250 R Nanowire 55.52 2.92 50.9 7.92


Visible light absorbance and a narrower bandgap in the TiO2 matrix are important factors in determining the visible light photoactivity as well as other electronic properties of the material, such as photoconductance.38 From Table 2, the iodine modified TiO2 have their bandgaps narrowed from 3.16 eV to up to 2.92 eV when compared to pristine TiO2. The bandgap narrowing improves the visible light degradation efficiency of MB. The 2-I/TiO2-250 sample had the highest degradation rate in which the MB degradation rate reaches 50.9% after 90 minutes (Kap = 7.92 × 10⁻³ min−1) under visible light irradiation. One of the reasons rutile presents better visible light photodegradation of MB, compared to similarly prepared anatase is the lower bandgap of rutile nanowire than that of the anatase nanoparticle cluster. The rutile nanowire product (2-I/TiO2-250), in particular, is capable of generating more electron–hole pairs under visible light due to the creation of both the Ti3+ sites, I–O–Ti and oxygen vacancies. With the bandgap further decreased by oxygen vacancies, better visible activated catalytic performance could be expected from rutile phase. The other reason lies in that rutile phase has higher photoconductance (photoconductance is related to the photoactivity) in the visible light region within the photon energy level of the bandgap, so there is greater electron and hole generation compared to anatase, even though the photoconductance is higher in anatase over the entire UV-Vis spectrum.38

The presence of excess Ti3+ sites contributes to the visible light absorption because of the formation of the 3d orbital of the Ti3+ ions in the bandgap just below the bottom of the CB.6,10 The existence of Ti3+ can form a defect that promotes charge transfer and suppress electron–hole recombination.6,38 The 3d states of Ti3+ below CB are due to the presence of oxygen vacancies in the TiO2 lattice. Additionally, the created oxygen vacancies also act as charge carriers of holes (positive effect) and benefit the separation of electron–hole pairs.39 Oxygen vacancies can efficiently transfer photo-induced electrons to reduce the recombination of electron–hole pairs and thus benefit the visible light photocatalytic activity. The creation of oxygen vacancies induce additional acceptor states above the valence band (VB) edge of TiO2, resulting in narrowing of the bandgap.35 However, according to previous studies,11,40 high concentrations of the 3d state Ti3+ sites associated with oxygen vacancies are considered as the electron–hole recombination centers (negative effect), which can also be verified in our case of low temperature (150 °C) samples. In the case of specimens at 250 °C, there are relatively low concentrations of 3d state Ti3+ sites and high content of oxygen vacancies that act as the charge carriers or electron donors, which decrease the recombination rate of photo-induced electron–hole pairs.40 The generation of low concentrations of 3d Ti3+ sites is controllable and high oxygen vacancies is the key to the enhanced photocatalytic performance of visible sensitized TiO2 nanomaterials.

From the above deductions and in conjunction with XPS analysis, we can conclude that the chemical reaction causes the reduction of high valance iodine ions to a lower valance by consuming oxygen atoms from pristine TiO2. Oxygen vacancies can be created with the increased formation of I–O–Ti bonds by the modification of iodine. The formation of 3d Ti3+ sites and oxygen vacancies narrows the absorption bandgap of TiO2. This bandgap narrowing allows TiO2 photocatalysts to be excited under visible light irradiation and generate electron–hole pairs, most of which are trapped or react in aqueous solutions producing reactive species such as O2, ˙OH radicals, and H2O2.11 Photo-generated electrons transfer directly into the CB with the existence of oxygen vacancies and I–O–Ti bonding in the titania matrix. Interactions of these activity species account for the efficient degradation property of MB under visible light irradiation. These nanomaterial photocatalysts can be applied to the organic degradation of pollutants for water treatment using cheap solar irradiation, instead of an ultraviolet irradiation source.

4. Conclusions

Iodine modified TiO2 photocatalysts with enhanced photocatalytic activities under visible light were successfully prepared by a hydrothermal process using P25 and iodic acid (HIO3) as the precursor and the intrinsic reaction mechanism of these photocatalysts were studied. The results show that using a low temperature at 150 °C generates fine particle-like structures of anatase phase, whereas at a higher temperature of 250 °C, the products generated were dominated by nanowire structures of rutile phase. Both phases of TiO2 photocatalysts show enhancements in photoabsorption and photodegradation under visible light irradiation. Rutile nanowires, in particular, demonstrates a higher photodegradation rate than anatase nanoparticle clusters when compared with similarly prepared materials (one-step and two-step hydrothermal methods). The multi-valences of iodine can be used as the oxidant of oxygen atoms for the synthesis of iodine modified TiO2 with oxygen vacancies. Oxygen vacancies are produced with the increasing formation of I–O–Ti bonds and result in the optical response in the visible light region. Elevating the temperature from 150 °C to 250 °C, increases oxygen vacancies and decreases 3d Ti3+ sites by the reducing reactions of iodine ions, resulting in enhanced visible photocatalytic activity.

Acknowledgements

This work has been financially supported by the Natural Sciences and Engineering Research Council of Canada through a strategic project grant, the Canadian Water Network Innovative Technologies for Water Treatment Program, and the Canada Research Chairs Program. Technical support from Trojan UV, the City of Guelph Wastewater Services, Deep Blue NRG, and GE Water & Process Technologies are highly appreciated. W.J. Li acknowledges the China Scholarship Council (CSC) for providing a Doctoral Scholarship.

References

  1. A. Fujishima and K. Honda, Nature, 1972, 238, 37–38 CrossRef CAS.
  2. J. Zhang, W. Q. Peng, Z. H. Chen, H. Chen and L. Y. Han, J. Phys. Chem. C, 2012, 116, 19182–19190 CAS.
  3. D. H. Chen, F. Z. Huang, Y. B. Cheng and R. A. Caruso, Adv. Mater., 2009, 21, 2206–2210 CrossRef CAS PubMed.
  4. G. F. Ortiz, I. Hanzu, P. Lavela, J. L. Tirado, P. Knauthac and T. Djenizian, J. Mater. Chem., 2010, 20, 4041–4046 RSC.
  5. T. Morikawa, T. Ohwaki, K. Suzuki, S. Moribe and S. Tero-kubota, Appl. Catal., B, 2008, 83, 56–62 CrossRef CAS PubMed.
  6. S. Hoang, S. W. Guo, N. T. Hahn, A. J. Bard and C. B. Mullins, Nano Lett., 2012, 12, 26–32 CrossRef CAS PubMed.
  7. D. Rimeh, D. Patrick and R. Didier, Ind. Eng. Chem. Res., 2013, 52, 3581–3599 Search PubMed.
  8. A. Hu, X. Zhang, D. Luong, K. D. Oakes, M. R. Servos, R. Liang, S. Kurdi, P. Peng and Y. Zhou, Waste Biomass Valorization, 2012, 3, 443–449 CrossRef CAS.
  9. Y. Wang, C. X. Feng, M. Zhang, J. J. Yang and Z. J. Zhang, Appl. Catal., B, 2010, 100, 84–90 CrossRef CAS PubMed.
  10. G. D. Yang, Z. Jiang, H. H. Shi, T. C. Xiao and Z. F. Yan, J. Mater. Chem., 2010, 20, 5301–5309 RSC.
  11. C. Burda, Y. B. Lou, X. B. Chen, A. C. S. Samia, H. Stout and J. L. Gole, Nano Lett., 2003, 3, 1049–1051 CrossRef CAS.
  12. D. H. Wang, L. Jia, X. L. Wu, L. Q. Lu and A. W. Xu, Nanoscale, 2012, 4, 576–584 RSC.
  13. F. Dong, S. Guo, H. Q. Wang, X. F. Li and Z. B. Wu, J. Phys. Chem. C, 2011, 115, 13285–13292 CAS.
  14. J. G. Yu, G. P. Dai, Q. J. Xiang and M. Jaroniec, J. Mater. Chem., 2011, 21, 1049–1057 RSC.
  15. T. Umebayashi, T. Yamaki, S. Yamamoto, A. Miyashita, S. Tanaka, T. Sumita and K. Asai, J. Appl. Phys., 2003, 93, 5156–5160 CrossRef CAS PubMed.
  16. X. T. Hong, Z. P. Wang, W. M. Cai, F. Lu, J. Zhang, Y. Z. Yang, N. Ma and Y. J. Liu, Chem. Mater., 2005, 17, 1548–1552 CrossRef CAS.
  17. S. Song, J. J. Tu, Z. Q. He, F. Y. Hong, W. P. Liu and J. M. Chen, Appl. Catal., A, 2010, 378, 169–174 CrossRef CAS PubMed.
  18. G. Liu, C. H. Sun, X. X. Yan, L. N. Cheng, Z. G. Chen, X. W. Wang, L. Z. Wang, S. C. Smith, M. Lu and H. M. Cheng, J. Mater. Chem., 2009, 19, 2822–2829 RSC.
  19. W. Y. Su, Y. F. Zhang, Z. H. Li, L. Wu, X. X. Wang, J. Q. Li and X. Z. Fu, Langmuir, 2008, 24, 3422–3428 CrossRef CAS PubMed.
  20. K. B. Jaimy, V. P. Safeena, S. Ghosh, H. Y. Hebalkar and K. G. K. Warrier, Dalton Trans., 2012, 41, 4824–4832 RSC.
  21. N. Sobana, M. Muruganadhaml and M. Swaminathan, J. Mol. Catal. A: Chem., 2006, 258, 124–132 CrossRef CAS PubMed.
  22. J. Zhang, J. H. Xi and Z. G. Ji, J. Mater. Chem., 2012, 22, 17700–17708 RSC.
  23. G. Colón, M. Maicu, M. C. Hidalgo and J. A. Navío, Appl. Catal., B, 2006, 67, 41–51 CrossRef PubMed.
  24. S. Y. Zhu, S. J. Liang, Q. Gu, L. Y. Xie, J. X. Wang, Z. X. Ding and P. Liu, Appl. Catal., B, 2012, 119–120, 146–155 CrossRef CAS PubMed.
  25. T. Ihara, M. Miyoshi, Y. Iriyama, O. Matsumoto and S. Sugihara, Appl. Catal., B, 2003, 42, 403–409 CrossRef CAS.
  26. I. Nakamura, N. Negishi, S. Kutsuna, T. Ihara, S. Sugihara and K. Takeuch, J. Mol. Catal. A: Chem., 2000, 161, 205–212 CrossRef CAS.
  27. I. Justicia, P. Ordejon, G. Canto, J. L. Mozos, J. Fraxedas, G. A. Battiston, R. Gerbasi and A. Figueras, Adv. Mater., 2002, 14, 1399–1402 CrossRef CAS.
  28. X. W. Zhao, W. Z. Jin, J. G. Cai, J. F. Ye, Z. H. Li, Y. R. Ma, J. L Xie and L. M. Qi, Adv. Funct. Mater., 2011, 21, 3554–3563 CrossRef CAS PubMed.
  29. J. Jitputti, S. Pavasupree, Y. Suzuki and S. Yoshikawa, Jpn. J. Appl. Phys., 2008, 47, 751–756 CrossRef CAS.
  30. W. J. Zhou, X. Y. Liu, J. J. Cui, D. Liu, J. Li, H. D. Jiang, J. Y. Wang and H. Liu, CrystEngComm, 2011, 13, 4557–4563 RSC.
  31. A. M. Hu, X. Zhang, K. D. Oakes, P. Peng, Y. N. Zhou and M. R. Servos, J. Hazard. Mater., 2011, 189, 278–285 CrossRef CAS PubMed.
  32. A. Hu, R. Liang, X. Zhang, S. Kurdi, D. Luong, H. Huang, P. Peng, E. Marzbanrad, K. D. Oakes, Y. Zhou and M. R. Servos, J. Photochem. Photobiol., A, 2013, 256, 7–15 CrossRef CAS PubMed.
  33. D. L. Shieh, Y. S. Lin, J. H. Yeh, S. C. Chen, B. C. Lin and J. L. Lin, Chem. Commun., 2012, 48, 2528–2530 RSC.
  34. M. Y. Xin, J. L. Zhang and F. Chen, Appl. Catal., B, 2009, 89, 563–569 CrossRef PubMed.
  35. P. Kubelka and F. Munk, Z. Tech. Phys., 1931, 12, 593–601 Search PubMed.
  36. N. H. Yang, C. C. Tseng, J. L. Wu, C. C. Juan, S. J. Lin and S. Y. Chang, RSC Adv., 2013, 3, 7093–7099 RSC.
  37. R. H. Li, H. Kobayashi, J. F. Guo and J. Fan, Chem. Commun., 2011, 47, 8584–8586 RSC.
  38. Y. Yamada and Y. Kanemitsu, Appl. Phys. Lett., 2012, 101, 133907 CrossRef PubMed.
  39. P. Xu, L. Lu, T. Xu, S. M. Gao, B. B. Huang and Y. Dai, J. Phys. Chem. C, 2010, 114, 9510–9517 CAS.
  40. S. Ikeda, N. Sugiyama, S. Murakami, H. Kominami, Y. Kera, H. Noguchi, K. Uosaki, T. Torimoto and B. Ohtani, Phys. Chem. Chem. Phys., 2003, 5, 778–783 RSC.

Footnote

Electronic supplementary information (ESI) available. See DOI: 10.1039/c4ra04768k

This journal is © The Royal Society of Chemistry 2014