
Reversible on/off switching of fluorescence via esterification of carbon dots†
Upama Baruah,
Manash Jyoti Deka and
Devasish Chowdhury*
Material Nanochemistry Laboratory, Physical Sciences Division, Institute of Advanced Study in Science and Technology, Paschim Boragaon, Garchuk, Guwahati 781035, India. E-mail: devasish@iasst.gov.in; Fax: +91 361 2279909; Tel: +91 361 291207
First published on 5th August 2014
Abstract
We demonstrate a simple, facile, and reversible on/off fluorescence switching by functionalization of carbon dots (CDs) via esterification. The CDs synthesized from citric acid show pH-dependent photoluminescence (PL), with higher PL intensity observed at pH 7 than at pH 1. The hydroxyl and carboxyl group-bearing CDs were also esterified with different alcohols, and their PL properties were studied. It is interesting to note that in all the cases, low PL intensity of CDs at pH 1 can be transformed into a high PL system by esterification of CDs. However, at neutral pH 7, the PL intensity was found to be lower after esterification of CDs. Moreover, at pH 1, the subsequent hydrolysis of esterified CDs again results in low PL intensity, thereby demonstrating the reversibility of the process.
Introduction
Carbon dots (CDs) have been regarded as a rising star in the family of fluorescent carbon nanomaterials. The reason behind the much acquired interest in carbon dots stems from their unique and superior properties, such as high stability against photobleaching and photoblinking, biocompatibility, low toxicity, good stability, easy preparation, and environmental friendliness, thereby popularizing their use as potential alternatives to conventional metal-based semiconductor quantum dots. In recent years, much attention has been paid to these emerging carbon nanomaterials, including their syntheses, physical and chemical property studies, and applications. Many aspects of their potential applications have already been explored such as in bioimaging,1,2 photoreduction of metals,3 optoelectronic devices,4 drug delivery,5 and in analytical applications based on their fluorescence properties.6To date, a variety of methods have been explored to prepare carbon dots, including laser ablation, electrochemical oxidation, chemical oxidation, thermolysis, and microwave-assisted methods7 and by employing simple, cost-effective, and eco-friendly carbon sources, such as glucose, sucrose, citric acid, or glycerol.8 Our laboratory has also reported the preparation of CDs from chitosan gel.9 It is now a well-established fact that small carbon nanoparticles can be surface-passivated by organic molecules or polymers to increase their photoactivity and to increase the photoluminescence quantum yields. For instance, Wang et al. reported carbon nanoparticles with surface-attached oligomeric ethylene glycol diamine (PEG1500N) via amide linkages.10 Zheng et al. reported the reduction of the weak green luminescence of CDs with sodium borohydride in an aqueous solution to give carbon dots with strong blue luminescence with quantum yield values as high as 24%.11 Zheng et al. reported a facile thermal pyrolysis route for the preparation of CDs with high quantum yield (QY, 88.6%) using citric acid (CA) as the carbon source and diethylenetriamine as the surface passivation agent. This system was then used as an on–off–on fluorescence sensor for the detection of Cr(VI) and ascorbic acid based on the inner filter effect.12 Zhang et al. reported a facile, low temperature one-pot route to synthesize N-doped fluorescent CDs using CCl4 as the carbon source and NaNH2 as a dechlorination reagent and a nitrogen source. The as-prepared N-doped CDs showed efficient upconversion emission.13
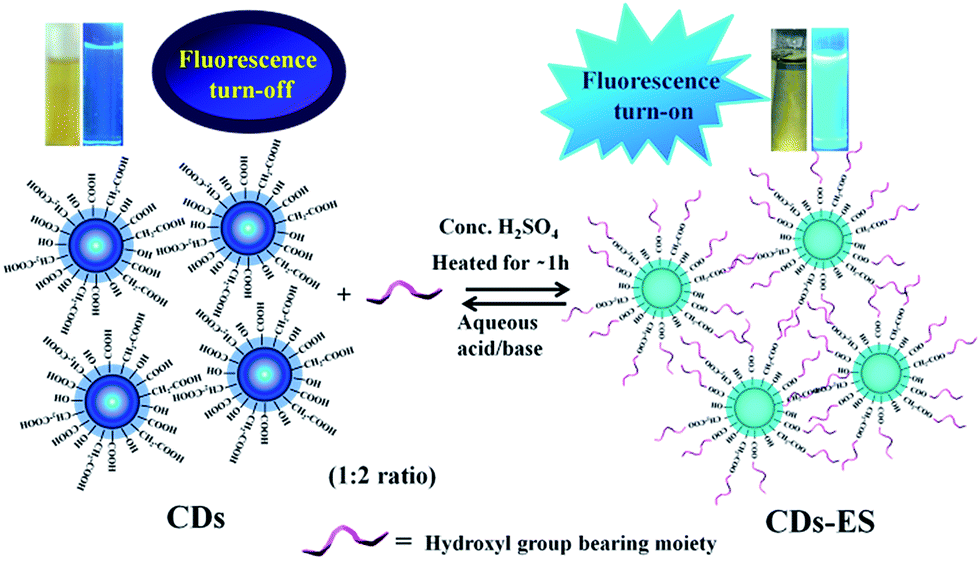
In the present study, we demonstrate a simple, facile, and reversible on/off fluorescence switching via covalent functionalization of CDs obtained from citric acid. As CDs obtained from citric acid possess surface carboxylic acid groups, it was observed that simple esterification of these groups led to an enhanced PL intensity of the CDs at pH 1 and a reduced PL intensity of the CDs at pH 7. Moreover, we functionalized the CDs with ester groups using different types of alcohols. Although surface functionalizations of CDs are currently being explored, in this work along with the successful surface functionalization of CDs via esterification as demonstrated by rapid optical response, we also tried to investigate the reversible nature of the reaction in order to develop promising candidates for probable use as reversible pH-responsive optical switches.
Results and discussion
The synthesis of CDs was carried out from citric acid employing an earlier reported method.14 Briefly, 2 g of citric acid (CA) was placed in a beaker and heated at 200 °C for half an hour. The liquated citric acid turned from colorless to pale yellow to orange in due course of time, thus implying the formation of CDs. The orange liquid obtained was then added dropwise to 50 mL of sodium hydroxide solution (10 mg mL−1) under vigorous stirring. This solution was neutralized with NaOH solution to obtain the aqueous CD solution.The elemental analysis of CDs was carried out by energy-dispersive X-ray spectroscopy (EDX) and is tabulated in Table S1 (ESI†). It is evident from the table that the carbon content is higher in the CDs than citric acid, confirming carbonization during pyrolysis.
The synthesized CDs exhibit strong excitation-independent emission, with maximum excitation and emission wavelengths at 400 nm and 465 nm, respectively, at pH 7, in good agreement with earlier reports.14 Fig. 1A shows the stacked photoluminescence spectra of CDs excited in the wavelength range 300–430 nm at pH 7. However, the strong fluorescence of CDs was found to be pH-dependent, and the corresponding PL intensity was low at pH 1 with maximum excitation and emission wavelengths at 380 nm and 472 nm, respectively. Fig. 1B shows the stacked photoluminescence spectra of CDs excited in the wavelength range of 300–400 nm at pH 1. The PL emission property of CDs at pH 12 was also studied and is shown in ESI Fig. S2.† It was found that CDs at pH 12 show excitation-independent emission. A comparison of emission properties at an excitation wavelength of 380 nm at all the three pH values, viz., 1, 7, and 12, is plotted in ESI, Fig. S2B.† Schematic representations depicting the pH-dependent emission, i.e., low PL at pH 1 and high PL at pH 7, of CDs are shown in Scheme 1. Quantum yield measurements of CDs at pH 1 and pH 7 were determined using quinine sulphate in water (QY = 0.577) as the reference standard. It was observed that at pH 7, the QY of CDs was approximately 12.13%, whereas at pH 1, it was approximately 2.14%, thereby indicating an approximate 6-fold increase of quantum yield at pH 7 compared to that at pH 1. At neutral pH (pH = 7), CDs show high PL emission under UV light as compared to low pH (pH = 1). Fig. 1C shows the particle size distribution of the CDs obtained from dynamic light scattering (DLS). It is quite evident from the DLS data that the size of the CDs was determined to be approximately 5.62 ± 0.39 nm. The particle size of the prepared CDs was also confirmed from the TEM image, which shows the presence of particles below 10 nm (Fig. 1D).
 | ||
| Fig. 1 Photoluminescence emission spectra of carbon dots (CDs) (A) at excitation wavelengths from 300 nm to 430 nm at pH 7; (B) at excitation wavelengths from 300 nm to 400 nm at pH 1; (C) particle size distribution of the CDs obtained from DLS; (D) TEM image of CDs showing particles below 10 nm. | ||
 | ||
| Scheme 1 Schematic representation of CDs obtained from citric acid at pH 1 and pH 7. Inset photographs of CD solution viewed under normal light and UV light at pH 1 and pH 7. | ||
The photoluminescence properties of CDs can be effectively tuned by their functionalization. A series of ester-functionalized CDs was synthesized using different alcohols. Typically, aqueous solutions of CDs and alcohols were mixed in a 1![[thin space (1/6-em)]](https://www.rsc.org/images/entities/char_2009.gif) :2 ratio (5 mL CDs solution + 10 mL alcohol), and to this, approximately 40 μL of concentrated sulphuric acid was added; the solution was then heated for one and a half hours. In almost all the cases, the fruity smell of the product was used as a preliminary indication of the formation of ester-functionalized CDs. However, FTIR spectra and zeta potential measurement were used as confirmatory evidence for the esterification of CDs. Table 1 lists the different alcohols used for the esterification of CDs, the respective reaction temperatures, and reaction conditions.
:2 ratio (5 mL CDs solution + 10 mL alcohol), and to this, approximately 40 μL of concentrated sulphuric acid was added; the solution was then heated for one and a half hours. In almost all the cases, the fruity smell of the product was used as a preliminary indication of the formation of ester-functionalized CDs. However, FTIR spectra and zeta potential measurement were used as confirmatory evidence for the esterification of CDs. Table 1 lists the different alcohols used for the esterification of CDs, the respective reaction temperatures, and reaction conditions.
| Numerical notations | CDs (I) + hydroxyl group bearing moeity | Abbreviation used | Reaction temperature (°C) | Reaction time (h) | Reactionconditions |
|---|---|---|---|---|---|
| II | Ethanol | CDs-ETH-ES | 120 | 1.5 | Reflux |
| III | Sucrose | CDs-SUC-ES | 120 | 1.5 | Reflux |
| IV | Hyperbranched bis-MPA polyester-32-hydroxyl, generation 3 | CDs-DND-ES | 120 | 1.5 | Reflux |
| V | Glycerol | CDs-GLY-ES | 150 | 1 | Open air heating |
| VI | Ethylene glycol | CDs-EG-ES | 150 | 1 | Open air heating |
| VII | Poly(ethylene glycol) | CDs-PEG-ES | 150 | 1 | Open air heating |
It is interesting to note that low PL intensity of CDs at pH 1 can be increased by the esterification of CDs. A schematic representation depicting increased PL intensity after esterification of CDs at pH 1 is shown in Scheme 2. Most importantly, the change in PL intensity is reversible, as hydrolysis of ester in the presence of acid again results in decreased PL intensity. Thus, the system can act as a reversible on/off fluorescence switch via the esterification of CDs.
 | ||
| Scheme 2 Schematic representation of the esterification process of CDs. Inset photographs show a CD solution viewed under normal light and UV light before and after esterification. | ||
While higher PL intensity was obtained upon esterification of CDs at pH 1 as discussed in the above paragraphs, the PL intensity was found to be lower after esterification of CDs at pH 7. Fig. 2A and B shows a representative PL emission spectrum of CDs and the corresponding ester formed by reaction with glycerol at pH 1 and at pH 7, respectively. The PL property at pH 12 was also studied. For this, CDs were esterified with poly(ethylene glycol), and the PL was determined at different excitation wavelengths at pH 12. The stacked PL emission spectra of CDs esterified with poly(ethylene glycol), i.e., PEG-ES at pH 1, 7 and 12, are shown in Fig. S4A–C (ESI†), respectively.
 | ||
| Fig. 2 Comparative PL emission spectra of CDs before and after esterification with glycerol, λex = 380 nm. (A) At pH 1; (B) at pH 7. | ||
Furthermore, a comparison of PL intensities of CDs-PEG-ES at all the three pH values at an excitation wavelength of 380 nm is shown in Fig. S4D.† It is quite evident from the spectra that for all the pH values (1, 7 and 12), the CD-ES exhibit excitation-dependent emission behavior.
Fourier transform infrared (FTIR) spectroscopy was used to ascertain the ester formation in the CDs. Fig. 3A shows the FTIR spectrum of citric acid and synthesized CDs at pH 7 and pH 1. From Fig. 3A, it is evident that hydroxyl (–O–H) and carboxylic acid (–COOH) groups are present in both pure citric acid and CDs. However, at pH 1, the stretching frequency occurs at 1716 and 1647 cm−1 for the –COOH group, whereas at pH 7, the stretching frequency occurs at 1580 cm−1 for the –COO− group. Peaks corresponding to –O–H stretching occur at 3450, 3450, and 3451 cm−1, respectively, for pure citric acid, and CDs at pH 1 and pH 7, respectively. The peaks occurring at 1390 and 1222 cm−1 for CDs at pH 1 and pH 7, respectively, can be ascribed to the stretching vibration of the C–H group and indicate the presence of incompletely carbonized citric acid.14 Peaks at 1130 and 1058 cm−1 for CDs at pH 1 and pH 7, respectively, arise from the –C–O–C group stretching vibration.
 | ||
| Fig. 3 Fourier transform infrared (FTIR) spectrum of (A) citric acid and synthesized CDs at pH 1 and 7, and (B) the different esters formed on the CDs. Encircled regions (i) and (ii) show the changes in the stretching frequencies of carboxylic acid groups and hydroxyl groups respectively upon esterification. | ||
Fig. 3B shows the stacked FTIR spectra of CDs esterified with different hydroxyl group-bearing molecules, with the encircled regions (i) and (ii) showing the changes in the stretching frequencies of carboxylic acid groups upon esterification and the stretching frequencies of hydroxyl groups of CDs that remain almost unchanged even after esterification of CDs. After esterification of the CDs, the peak at 1716 cm−1, which was characteristic of the CDs, was found to be reduced in intensity in all the cases, thereby indicating the successful esterification of the CDs. However, only the case of CDs-SUC-ES showed an extra peak at 1580 cm−1 along with 1715 cm−1, which is due to the presence of carboxylate ion (–COO−).
Further evidence for successful esterification of CDs was drawn from zeta potential measurements, which were performed for CDs both before and after esterification. The zeta potential of CDs before esterification was found to be −24.3 mV, which was subsequently changed to −6.11 mV after esterification, indicating positive change in the surface charge from more negative to less negative. It is quite understandable that this change will occur as –COOH-bearing CDs, which are negatively charged, will become less negative after esterification to form CDs-COOR (R-alkyl group). The systematic PL emission properties were studied for different types of esters that were synthesized using different alcohol moieties, as listed in Table 1. In general, it was observed that esterification of CDs using hydroxyl group-bearing molecules led to an increase in PL intensity of the CDs at pH 1.
The QY percentage increase was found to be dependent upon the hydroxyl group-bearing moiety. Fig. 4A shows the stacked PL spectra of CDs at pH 1 and those after esterification with different hydroxyl group-bearing molecules, viz., CDs-PEG-ES, CDs-EG-ES, CDs-GLY-ES, CDs-ETH-ES, CDs-SUC-ES, and CDs-DND-ES. The QY values for the different ester-functionalized CDs were found to be 10.62%, 9.34%, 7.63%, 4.51%, 3.094%, and 3.12% for CDs-PEG-ES, CDs-EG-ES, CDs-GLY-ES, CDs-ETH-ES, CDs-SUC-ES, and CDs-DND-ES, respectively, at pH 1 using quinine sulphate as the standard. Moreover, the inset of Fig. 4A shows the normalized PL emission spectra of different ester-functionalized CDs. From the emission spectra, a blueshift of emission maximum is quite evident. Fig. 4B shows the stacked PL spectra of CDs at pH 7 and those after esterification with different hydroxyl group-bearing molecules. The QY values for the different ester-functionalized CDs were found to be 11.14%, 9.67%, 8.82%, 6.99%, 6.18%, and 5.87% for CDs-GLY-ES, CDs-PEG-ES, CDs-EG-ES, CDs-ETH-ES, CDs-SUC-ES, and CDs-DND-ES, respectively, at pH 7 using quinine sulphate as the standard. The inset of Fig. 4B shows the normalized PL emission spectra of different ester-functionalized CDs at pH 7. It is interesting to note that in this case, the emission spectra show an observed redshift of emission maximum. Fig. 4C shows the histogram plot of change in PL intensity of CDs after esterification (F − F0) vs. different esterified CDs at pH 1 and pH 7, where F is the maximum PL intensity of the esterified CDs at λexc = 380 nm at pH 1 and λexc = 400 nm at pH 7 and F0 is the maximum PL intensity of the CDs at their respective pHs. From the histogram plot, it is evident that there is an increase in PL intensity upon esterification at pH 1 but a decrease in PL intensity upon esterification at pH 7. Fig. 4D shows a photograph of CD solutions exposed to UV light and different ester-functionalized CDs at pH 1 and pH 7 with increasing and decreasing PL intensities, respectively. Functionalization with ester results in the creation of new energy levels within the band-gap structure, which is different for different esters. The shift in PL emission peaks after ester functionalization, i.e., a redshift (pH 7) and blueshift (pH 1), originates from the band gap tuning of the original CDs, which is probably due to the creation of new energy levels within the existing band gap structure.16
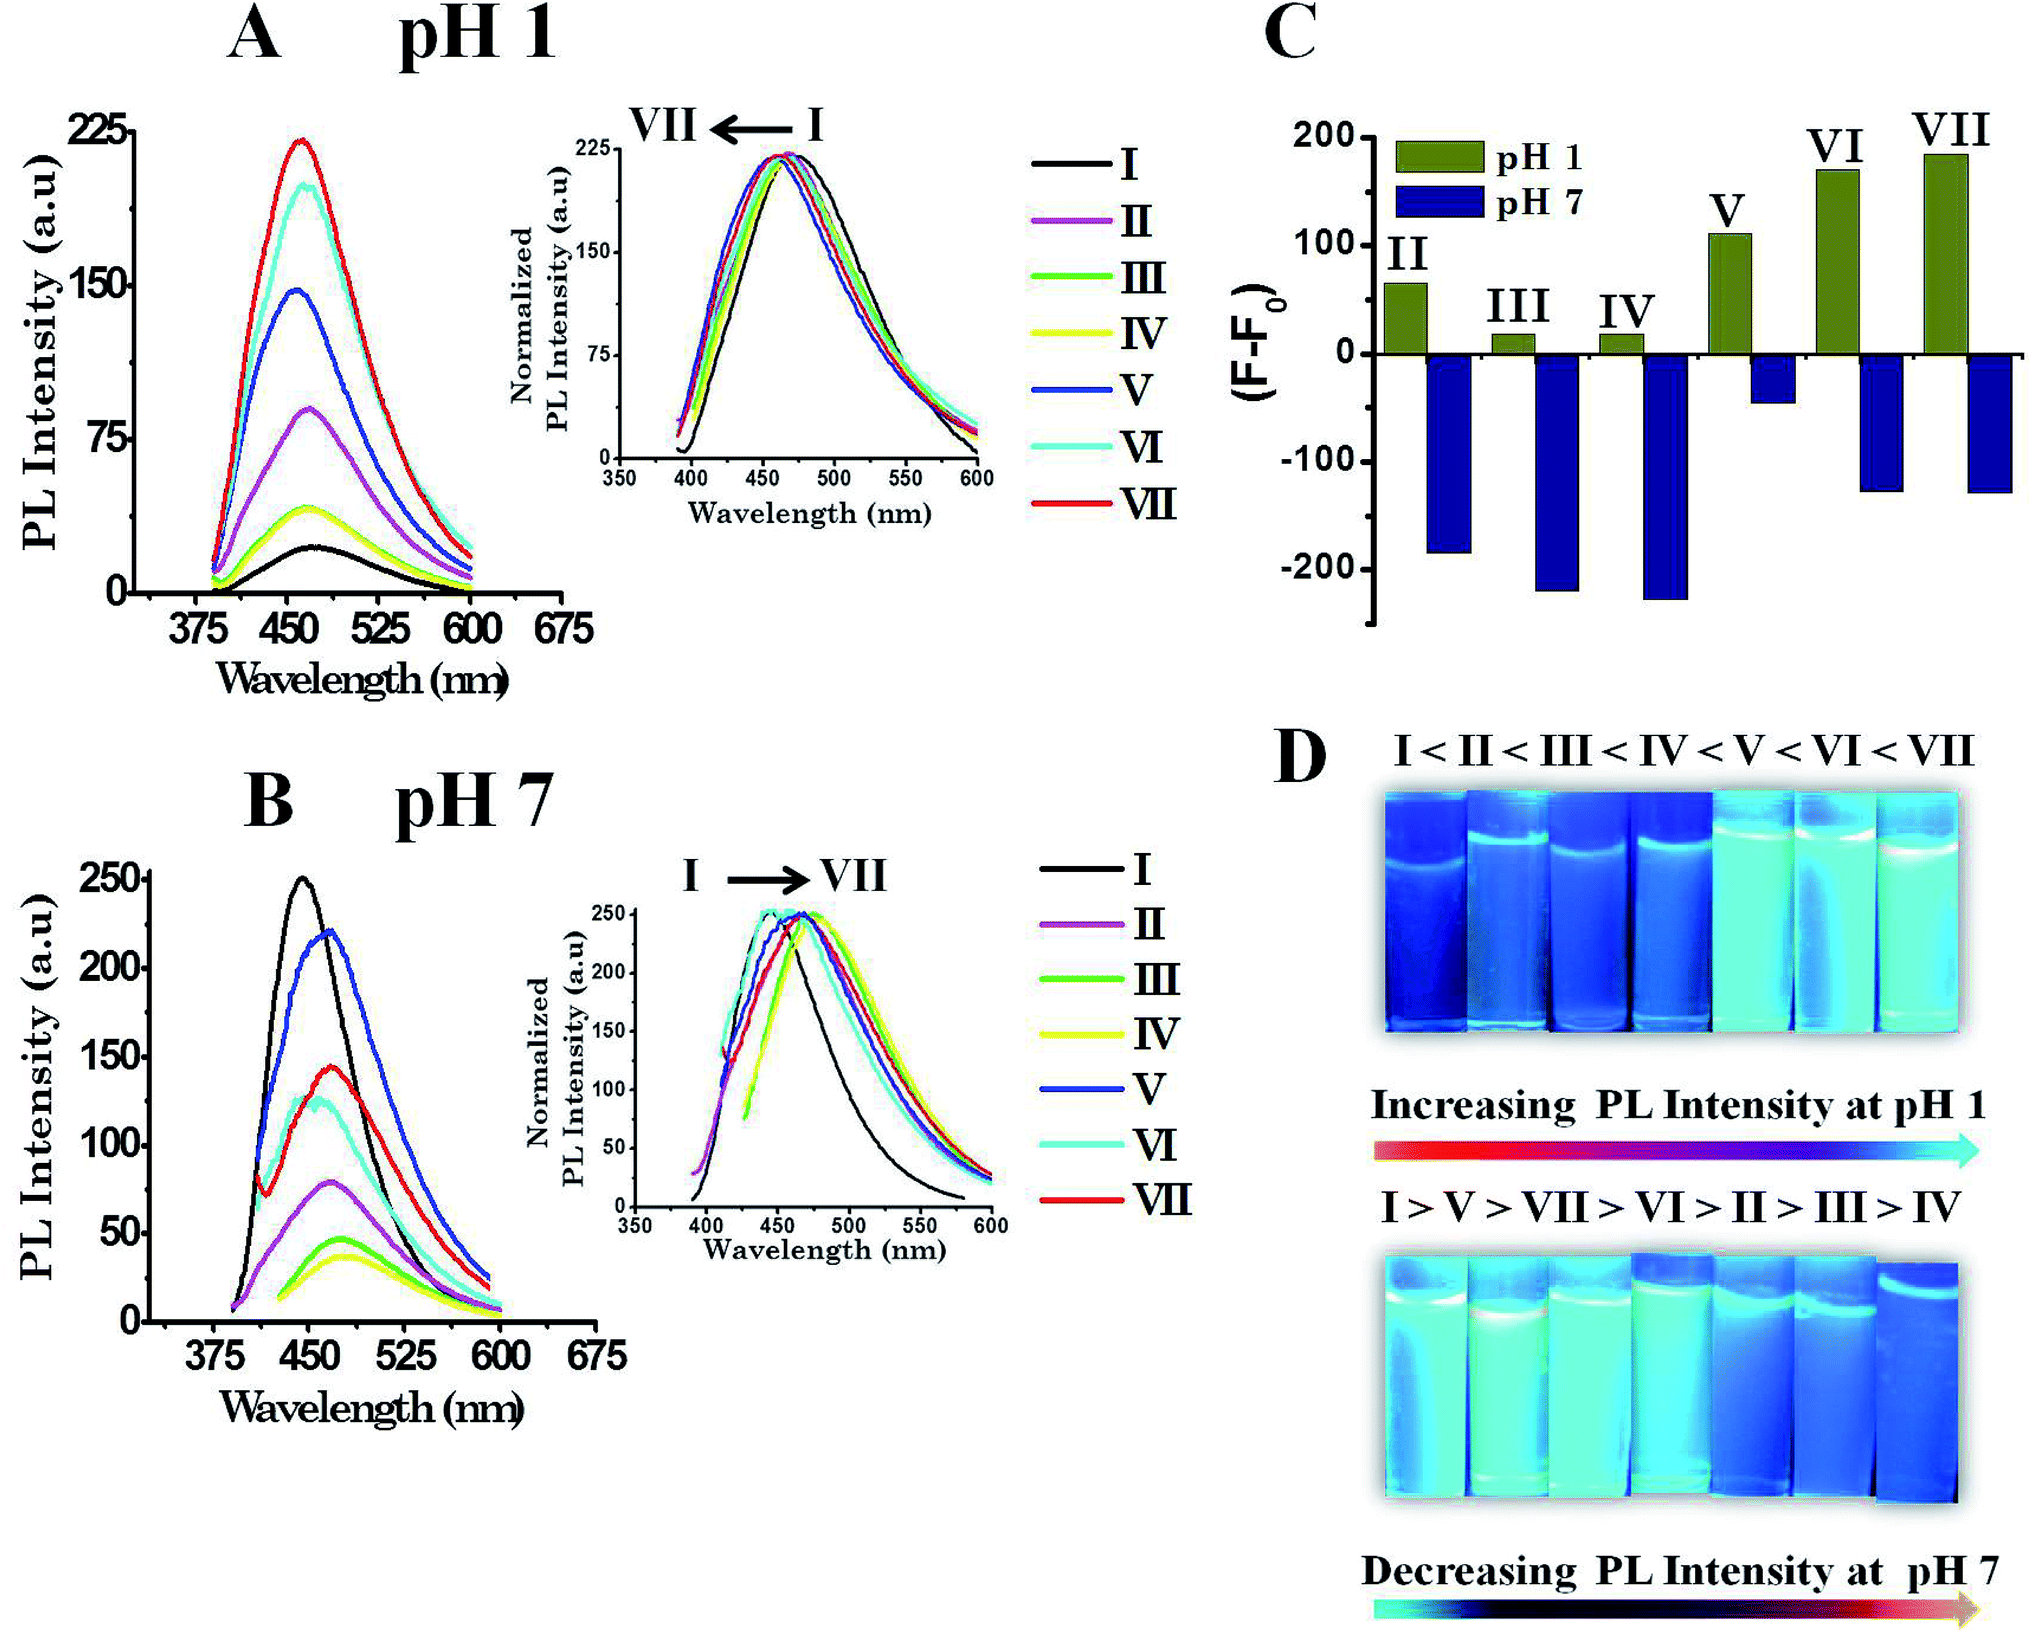 | ||
| Fig. 4 Stacked PL spectra of CDs and different ester-functionalized CDs: (A) at pH 1 (inset), the corresponding normalized PL emission spectra of CDs and different ester-functionalized CDs is shown; (B) at pH 7 (inset), the corresponding normalized PL emission spectra of CDs and different ester functionalized CDs is shown; (C) histogram plot of change in PL intensity of CDs after esterification (F − F0) vs. different esterified CDs at pH 1 and pH 7. (D) UV lamp images of CDs and different esterified CDs showing the gradual increase in PL intensity at pH 1 and the corresponding decrease in PL intensity at pH 7. The excitation wavelengths for the PL spectra were 380 nm. | ||
The switching from low PL to high PL by esterification of CDs at pH 1 is reversible. Fig. 5 shows the reversible switching cycles of CDs and the esterification process. Although the hydrolysis of esters can be catalyzed by either acid or base, acid-catalyzed hydrolysis of esters is not the best methodology for use because the reaction is readily reversible. Therefore, base catalysis is the best option because the final acid is deprotonated by the alkoxide, and this drives the reaction completely to the products. In our experiments, we have performed the base-catalyzed hydrolysis of ester. Subsequent hydrolysis by base of the esterified CDs results in low PL. However, re-esterification of CDs results in the restoration of PL intensity. Further re-hydrolysis ensures a drop in the PL intensity, demonstrating the reversible on/off fluorescence switching obtained by functionalization of CDs. As a demonstration, three cycles of esterification and subsequent hydrolysis were performed to show the repeatability of the system. In the first cycle, 76.5% PL intensity was restored. Subsequent second and third cycles showed 73.1% and 69.5% restoration of PL intensity, respectively.
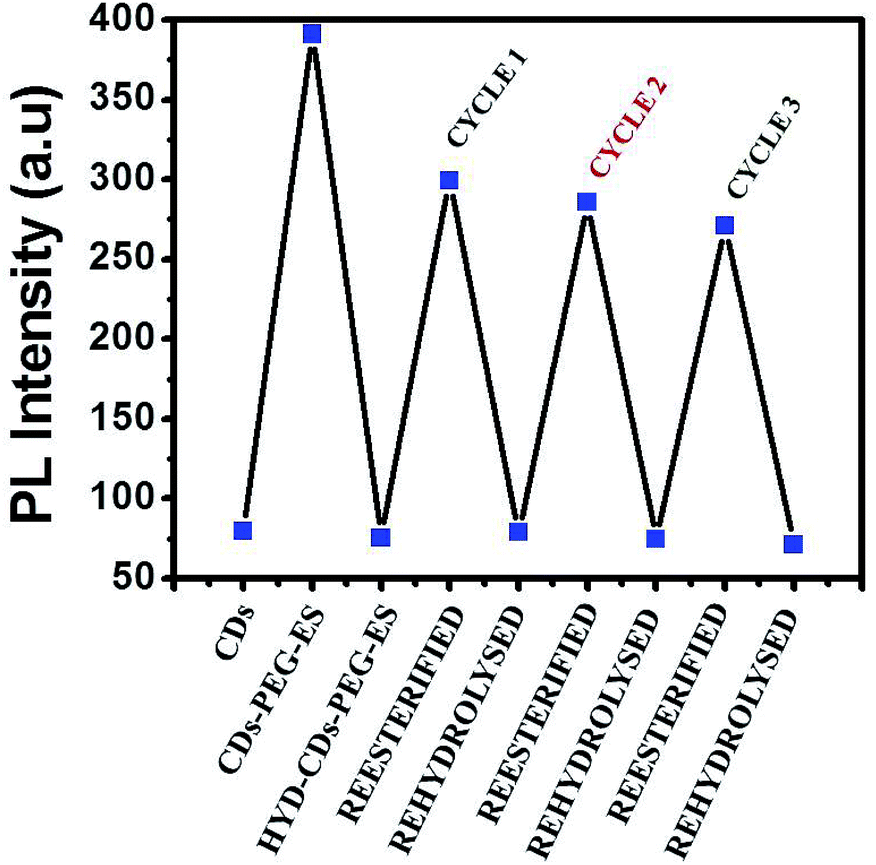 | ||
| Fig. 5 PL switching cycle from CDs (low PL) at pH 1 to esterification of CDs (high PL) followed by subsequent hydrolysis (low PL), re-esterification (high PL), and re-hydrolysis of ester (low PL). | ||
The mechanisms of CD luminescence are not yet fully understood. However, the luminescence from CDs has been suggested to arise from excitons of carbon, the presence of emissive traps, the quantum-confinement effect,15 aromatic structures, or oxygen-containing groups.17,18 Furthermore, the PL property of CDs can be easily tuned by controlling their size or by the presence of electron donor or acceptor molecules in solution.3 In general, the PL intensity depends on numerous factors such as the fabrication method employed, the surface functional groups present, and pH. The CDs obtained from citric acid have carboxylic acid (–COOH) and hydroxyl (–OH) groups that act as surface functional groups. At pH 1, the –COOH groups in the CDs remain fully protonated, leading to quenching of the PL intensity, while at pH 7, the –COOH groups in the CDs are deprotonated, leading to an enhancement of PL intensity. Upon esterification of the CDs at pH 1, the PL intensity was found to be significantly enhanced. A probable explanation of this phenomenon could be that upon surface passivation or esterification of CDs using different hydroxyl group-bearing molecules, the surface sites are rendered more stable or defect sites are produced,19 thereby facilitating more effective radiative recombination of electron–hole pairs20 and resulting in enhancement in PL intensity. However, this is not the case at pH 7, where esterification results in a decrease in PL intensity. Hence, esterified CDs exhibit pH-dependent PL properties.
Conclusion
In conclusion, we show reversible on/off fluorescence switching by functionalizing carbon dots (CDs) via esterification. CDs synthesized from citric acid show pH-dependent photoluminescence (PL) properties with high PL intensity observed at pH 7 rather than at pH 1. However, the low PL intensity observed at pH 1 can be transformed into high PL intensity by functionalization via esterification. Moreover, hydrolysis of esterified CDs again results in low PL intensity, demonstrating the reversibility of the process. It is likely that this system will be ideal for applications such as fluorescence-based optical switches.Acknowledgements
The authors would like to thank the Council of Scientific and Industrial Research (CSIR), New Delhi for project grant no. 01(2488)/11/EMR-II and the Science and Engineering Research Board (SERB), New Delhi for project grant no. SB/S1/PC-69/2012. UB and MJD thank IASST, Guwahati and SERB, New Delhi, respectively, for the fellowship. We thank Mr Satyapriya Bhandari for helping us with the TEM measurements.Notes and references
- H. Zheng, Q. Wang, Y. Long, H. Zhang, X. Huang and R. Zhu, Chem. Commun., 2011, 47, 10650 RSC.
- L. Cao, X. Wang, M. J. Meziani, F. Lu, H. Wang, P. G. Luo, Y. Lin, B. A. Harruff, L. M. Veca, D. Murray, S. Y. Xie and Y. P. Sun, J. Am. Chem. Soc., 2007, 129, 11318 CrossRef CAS PubMed.
- X. Wang, L. Cao, F. S. Lu, M. J. Meziani, H. T. Li, G. Qi, B. Zhou, B. A. Harruff, F. Kermarrec and Y. P. Sun, Chem. Commun., 2009, 3774 RSC.
- X. Yan, X. Cui, B. Li and L. Li, Nano Lett., 2010, 10, 1869 CrossRef CAS PubMed.
- N. Gogoi and D. Chowdhury, J. Mater. Chem. B, 2014, 2, 4089–4099 RSC.
- Y. Dong, R. Wang, G. Li, C. Chen, Y. Chi and G. Chen, Anal. Chem., 2012, 84, 6220 CrossRef CAS PubMed.
- X. Zhai, P. Zhang, C. Liu, T. Bai, W. Li, L. Daic and W. Liu, Chem. Commun., 2012, 48, 7955 RSC.
- I. Costas-Mora, V. Romero, I. Lavilla and C. Bendicho, Anal. Chem., 2014, 86, 4536 CrossRef CAS PubMed.
- D. Chowdhury, N. Gogoia and G. Majumdar, RSC Adv., 2012, 2, 12156–12159 RSC.
- X. Wang, L. Cao, F. Lu, M. J. Meziani, H. Li, G. Qi, B. Zhou, B. A. Harruff, F. Kermarrec and Y.-P. Sun, Chem. Commun., 2009, 3774 RSC.
- H. Zheng, Q. Wang, Y. Long, H. Zhang, X. Huang and R. Zhu, Chem. Commun., 2011, 47, 10650 RSC.
- M. Zheng, Z. Xie, D. Qu, D. Li, P. Du, X. Jing and Z. Sun, ACS Appl. Mater. Interfaces, 2013, 5, 13242 CAS.
- Y.-Q. Zhang, D.-K. Ma, Y. Zhuang, X. Zhang, W. Chen, L.-L. Hong, Q.-X. Yan, K. Yub and S.-M. Huang, J. Mater. Chem., 2012, 22, 16714 RSC.
- Y. Dong, J. Shao, C. Chen, H. Li, R. Wang, Y. Chi, X. Lin and G. Chen, Carbon, 2012, 50, 4738 CrossRef CAS PubMed.
- Y. P. Sun, B. Zhou, Y. Lin, W. Wang, K. A. S. Fernando, P. Pathak, M. J. Meziani, B. A. Harruff, X. Wang, H. F. Wang, P. J. G. Luo, H. Yang, M. E. Kose, B. L. Chen, L. M. Veca and S. Y. Xie, J. Am. Chem. Soc., 2006, 128, 7756 CrossRef CAS PubMed.
- G. S. Kumar, R. Roy, D. Sen, U. K. Ghorai, R. Thapa, N. Mazumder, S. Saha and K. K. Chattopadhyay, Nanoscale, 2014, 6, 3384 RSC.
- S. L. Hu, K. Y. Niu, J. Sun, J. Yang, N. Q. Zhao and X. W. Du, J. Mater. Chem., 2009, 19, 484 RSC.
- X. Y. Li, H. Q. Wang, Y. Shimizu, A. Pyatenko, K. Kawaguchi and N. Koshizaki, Chem. Commun., 2011, 47, 932 RSC.
- Y. Yang, J. Cui, M. Zheng, C. Hu, S. Tan, Y. Xiao, Q. Yanga and Y. Liu, Chem. Commun., 2012, 48, 380 RSC.
- L. Cao, M. J. Meziani, S. Sahu and Y.-P. Su, Acc. Chem. Res., 2013, 46, 171 CrossRef CAS PubMed.
Footnote |
| † Electronic supplementary information (ESI) available: Elemental analysis of pure citric acid and that of CDs, XRD diffractogram of citric acid and CDs, the PL emission spectrum of CDs recorded at pH 12, comparison of PL intensities of CDs at pH 1, 7 and 12, PL emission spectra of CDs esterified with poly(ethylene glycol), i.e., CDs-PEG-ES at pH 1, 7 and 12 and comparison of PL intensities of CDs-PEG-ES at all the three pH levels are included in the ESI. See DOI: 10.1039/c4ra04734f |
| This journal is © The Royal Society of Chemistry 2014 |