DOI:
10.1039/C4RA04452E
(Paper)
RSC Adv., 2014,
4, 33114-33119
Eu2+-activated full color orthophosphate phosphors for warm white light-emitting diodes
Received
12th May 2014
, Accepted 15th July 2014
First published on 15th July 2014
Abstract
Eu2+-doped RbBaPO4, NaCaPO4 and CsMgPO4 orthophosphate phosphors were studied. X-ray diffraction (XRD) patterns analysis indicated all of the phosphors could be obtained in a pure phase by the solid-state reaction method. The photoluminescence emission (PL) spectra revealed that the phosphors showed broad-band blue, green and red emission with peaks at near 430 nm, 510 nm and 630 nm under a 340 nm UV lamp, corresponding to RbBaPO4:0.03Eu2+, NaCaPO4:0.01Eu2+ and CsMgPO4:0.07Eu2+ samples, respectively. A white light-emitting diode (w-LED) lamp, fabricated by the three samples combining a 370 nm n-UV chip, presented a high color-rendering index (CRI) of 86, as well as a warm correlated color temperature (CCT) of 2751 K. The results indicated that Eu2+-activated full color versatile orthophosphate phosphors and mixing strategy of the similar hosts will have potential use in the design of white LEDs.
I. Introduction
Ever since the first white light-emitting diodes (w-LEDs) became commercially available in 1997, they have drawn a lot of attention for their advantages of high luminous efficiency, energy saving and low power consumption.1,2 The general way to fabricate white LEDs is based on a blue InGaN LED chip and a yellow phosphor YAG:Ce3+, which yields a poor color rendering index.3 In order to improve the color rendering index (CRI), blue, green and red emission phosphors pumped by the ultraviolet/near-ultraviolet (UV/NUV) chips have been widely investigated recently.4 The commercialized blue, green and red phosphors for white LED lamps, such as BaMgAl10O17:Eu2+ (BAM), Ba2SiO4:Eu2+ (BSO), CaAlSiN3:Eu2+ (CASN), have generally been used, but there exists the disadvantage that the different host families may lead to a lack of consistency in practical applications. In this work, we have synthesized three kinds of full-color orthophosphate phosphors with a single rare-earth activator, Eu2+, to explore the luminescence properties for white light-emitting diodes (w-LEDs) application. Therefore, the same orthophosphate host family, including the blue-emitting RbBaPO4:0.03Eu2+, green-emitting NaCaPO4:0.01Eu2+ and red-emitting CsMgPO4:0.07Eu2+ phosphors,5–7 are selected as tricolor emitters for NUV LEDs to improve compatibility for their application in white LED lamps.8
II. Experimental procedure
RbBaPO4:0.03Eu2+, NaCaPO4:0.01Eu2+ and CsMgPO4:0.07Eu2+ phosphors were prepared via a traditional, high-temperature, solid-state method. The stoichiometric amounts of Rb2CO3 (A.R.), Na2CO3 (A.R.), Cs2CO3 (A.R.), BaCO3 (A.R.), CaCO3 (A.R.), (MgCO3)4·Mg(OH)2·5H2O (A.R.), (NH4)2HPO4 (A.R.) and Eu2O3 (99.99%) were employed as raw materials, and they were mixed and ground homogeneously in an agate mortar. The mixture was first preheated at 500 °C for 3 h in air atmosphere in alumina crucibles with covers. After the preliminary products were ground thoroughly in an agate mortar after cooling to room temperature, they were placed in alumina crucibles and annealed at 1150 °C in a CO reducing atmosphere for 3 h with highly pure carbon particles as the reducing agent. The phosphors were then obtained for characterization.
Powder X-ray diffraction (XRD) data was checked for structural phase identification by an X-ray powder diffractometer (Shimadzu, XRD-6000, Cu Kα radiation, λ = 0.15406 nm, 40 kV, 40 mA). The continuous scanning rate (2θ ranging from 5° to 90°) used in phase formation determination was 4°(2θ) min−1 and the step scanning rate (2θ ranging from 10° to 80°) used for Rietveld analysis was 8 s per step with a step size of 0.02°. Powder diffraction data were obtained using the computer software program General Structure Analysis System (GSAS). The morphology of the samples was inspected using a scanning electron microscope (SEM, JEOL, JSM-6490). Room-temperature photoluminescence excitation (PLE) and emission (PL) spectra were characterized on an F-4600 fluorescence spectrophotometer (F-4600, HITACHI, Japan) with a photomultiplier tube operating at 400 V and a 150 W Xe lamp used as the excitation source. The temperature-dependent luminescence properties were measured on the same spectrophotometer combined with a self-made heating attachment and a computer-controlled electric furnace. Optical properties of the white light n-UV LED, including the luminescent spectrum, CRI, CCT, and CIE value of the lamp, were measured by a HAAS-2000 (Ever fine, China) light and radiation measuring instrument. The quantum efficiency (QE) was measured using the integrating sphere on the FLS920 fluorescence spectrophotometer (Edinburgh Instruments Ltd., UK), and a Xe900 lamp was used as an excitation source and white BaSO4 powder as a reference.
III. Results and discussion
1 Phase structure
Fig. 1 shows the typical powder XRD patterns of RbBaPO4:0.03Eu2+, NaCaPO4:0.01Eu2+ and CsMgPO4:0.07Eu2+ samples, and the standard data reported in the Joint Committee on Powder Diffraction Standards card data (JCPDS-81-647-RbBaPO4, JCPDS-39-1193-NaCaPO4 and JCPDS-45-275-CsMgPO4) are given for comparison.9–11 We found that no impurity or significant changes were detected in the hosts, which confirmed that these samples were successfully obtained by the solid-state reaction method. Furthermore, the refinements and data processing were performed by the GSAS program12 for further demonstrating their phase structures. As shown in Fig. 2a–c, there were no impurities in the synthesized samples. We also obtained the Rietveld results presented in Table 1, where we can see that their volumes are 448.86 Å3, 1009.16 Å3 and 474.49 Å3, respectively, indicating the incorporation of Eu2+ in the host lattice. The reason is that, in the present work, the ionic radii are Ba2+CN=9 = 1.47 Å, Ca2+CN=7 = 1.06 Å, CN=8 = 1.12 Å and Cs+CN=6 = 1.67 Å, whereas the ionic radii for the six-, seven-, eight- and nine-coordinated Eu2+ are 1.17, 1.20, 1.25 and 1.30 Å,13 respectively. Note that when doping a small amount of Eu2+ to replace the other ions, the unit cell parameters and volume will change somewhat. Moreover, we can see that the values of Rwp and Rp are quite a bit smaller; thus, the results can verify the phase formation.
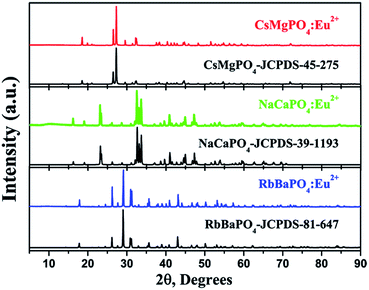 |
| | Fig. 1 XRD patterns of the RbBaPO4:Eu2+, NaCaPO4:Eu2+ and CsMgPO4:Eu2+ samples, the standard patterns of the RbBaPO4 phase (JCPDS-81-647), NaCaPO4 phase (JCPDS-39-1193) and CsMgPO4 phase (JCPDS-45-275). | |
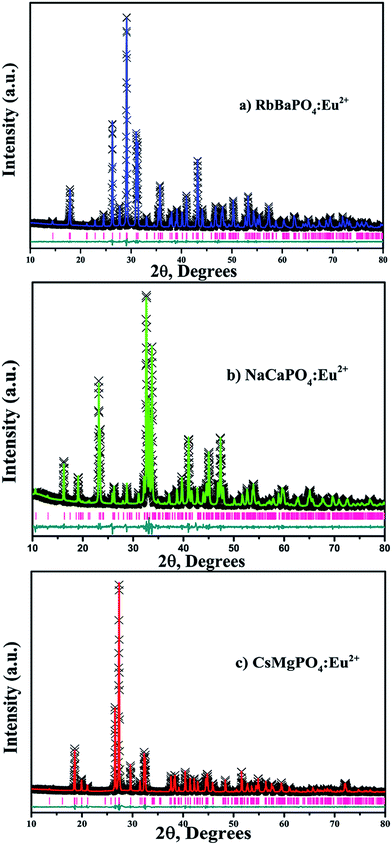 |
| | Fig. 2 Rietveld plots of the (a) RbBaPO4:Eu2+, (b) NaCaPO4:Eu2+ and (c) CsMgPO4:Eu2+ samples. | |
Table 1 Main parameters for RbBaPO4:Eu2+, NaCaPO4:Eu2+, and CsMgPO4:Eu2+ from results of the GSAS Rietveld refinement
| Formula |
RbBaPO4:Eu2+ |
NaCaPO4:Eu2+ |
CsMgPO4:Eu2+ |
| Space group |
Pnma |
Pn(21)a |
P1n1 |
| α = β = γ, ° |
90 |
90 |
90 |
| 2θ-interval, ° |
10–80 |
10–80 |
10–80 |
| a (Å) |
7.845 |
20.403 |
8.930 |
| b (Å) |
5.7285 |
5.400 |
5.515 |
| c (Å) |
10.039 |
9.158 |
9.633 |
| V (Å3) |
448.86 |
1009.16 |
474.49 |
| Z |
4 |
4 |
2 |
| Rwp (%) |
2.67 |
5.13 |
5.48 |
| Rp (%) |
1.69 |
3.65 |
3.97 |
2 Luminescence properties
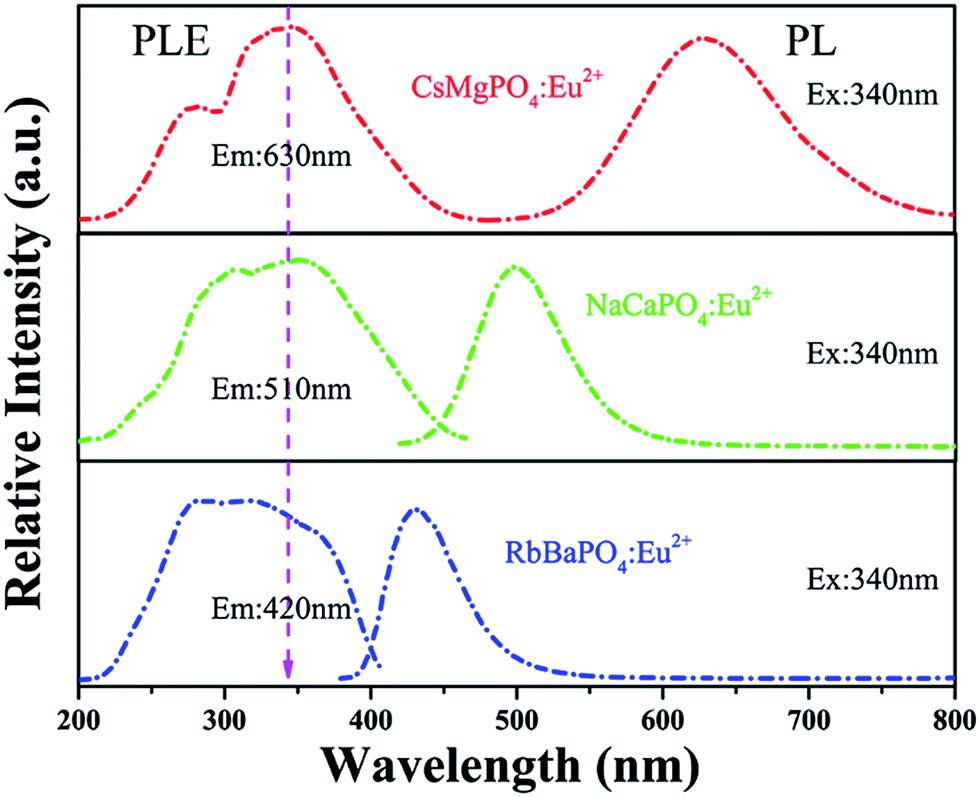
Photoluminescence excitation (PLE) and emission (PL) spectra of RbBaPO4:0.03Eu2+, NaCaPO4:0.01Eu2+ and CsMgPO4:0.07Eu2+ phosphors are shown in Fig. 3, where the concentration of Eu2+ in the three phosphors all correspond to the maximum of luminescence intensity from previous reports.5–7 The excitation spectra are all composed of strong broad absorption bands from 200 to 420 nm UV and n-UV range, attributed to 4f7(8S7/2)–4f65d transitions of the doped Eu2+ ions.14 Under the excitation at 340 nm, the phosphors exhibited strong blue, green and red emission bands, peaking at 430 nm, 510 nm and 630 nm, which can verify the possibility of their operation as the n-UV chip for w-LEDs application. In order to study the relationship between the coordination environment of Eu2+ and emission peaks, the following eqn (1) by van Uitert was employed:15| |
 | (1) |
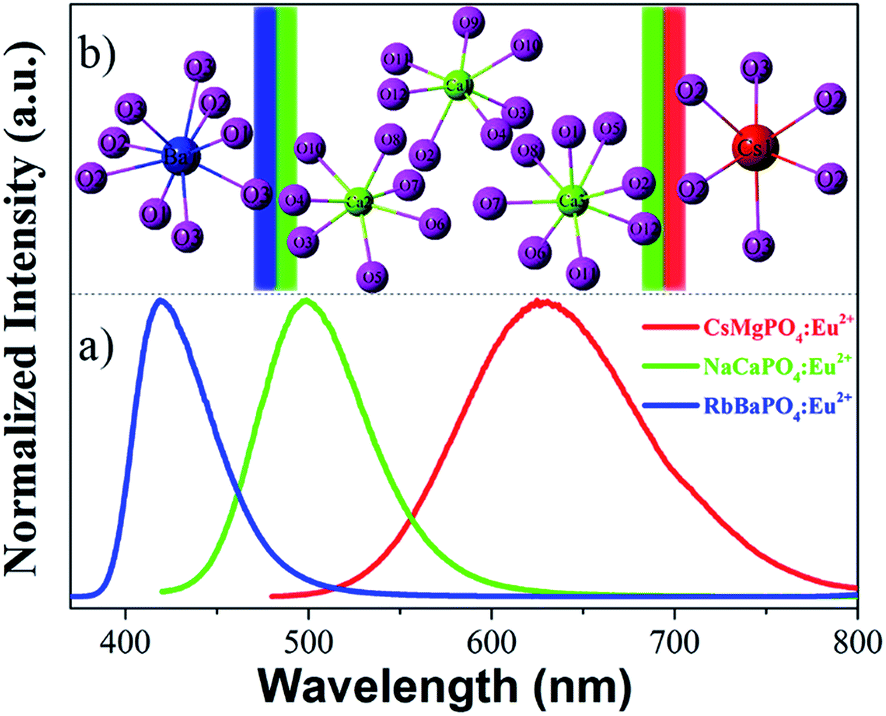
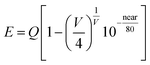
where E represents the position for the rare-earth ion emission peak (cm−1), Q is the energy position of the lower d-band edge for the free ions (34![[thin space (1/6-em)]](https://www.rsc.org/images/entities/char_2009.gif) 000 cm−1 for Eu2+), V is the valence of the “active” cation (V = 2 for Eu2+), n is the number of anions in the immediate shell around the “active” cation, r is the effective radius of the host cation replaced by the Eu2+ ion (Å), and ea is the electron affinity of the atoms that form anions (eV). The value of ea is the uncertainty in different circumstances; here, ea is about 1.60 or 2.19 eV.15 Therefore, by the semiquantitative calculation, we get the results of E are approximately Ba2+CN=9 = 23558 cm−1, Ca2+CN=7 = 18939 cm−1, CN=8 = 20333 cm−1 and Cs+CN=6 = 16325 cm−1, respectively. Fig. 4a) shows the normalized emission spectra for RbBaPO4:Eu2+, NaCaPO4:Eu2+ and CsMgPO4:Eu2+ phosphors under the excitation at 340 nm, and Fig. 4b) shows the coordination environment of the cations Ba2+, Ca2+ and Cs+, which illustrates that Eu2+-activated orthophosphate phosphors are definitely able to realize the blue to red emission for white light-emitting diodes (w-LEDs) application. In addition, a qualitative analysis of the relationship between crystal field splitting (εcfs) and coordination number or polyhedron size is discussed and is presented in Fig. 5. In this work, εc is the centroid shift measured from the excitation spectrum:16 εc (RbBaPO4:Eu2+) < εc (NaCaPO4:Eu2+: Ca2+CN=8) < εc (NaCaPO4:Eu2+: Ca2+CN=7) < εc (CsMgPO4:Eu2+). Dorenbos et al.17–19 reported that the smaller is the coordination number, the larger is the crystal field splitting in various Ce3+-doped phosphors. Similarly, the values of εcfs in Eu2+-doped phosphors are εcfs (RbBaPO4:Eu2+CN=9) < εcfs (NaCaPO4:Eu2+CN=8) < εcfs (NaCaPO4:Eu2+CN=7) < εcfs (CsMgPO4:Eu2+CN=6). Therefore, we obtain the result that the larger are εcfs and εc, the smaller is the wavenumber, which indicates that CsMgPO4:Eu2+ shows the longest emission wavelength at 630 nm among the above phosphors under the same excitation wavelength, and contributes much to the 5d crystal field splitting.
000 cm−1 for Eu2+), V is the valence of the “active” cation (V = 2 for Eu2+), n is the number of anions in the immediate shell around the “active” cation, r is the effective radius of the host cation replaced by the Eu2+ ion (Å), and ea is the electron affinity of the atoms that form anions (eV). The value of ea is the uncertainty in different circumstances; here, ea is about 1.60 or 2.19 eV.15 Therefore, by the semiquantitative calculation, we get the results of E are approximately Ba2+CN=9 = 23558 cm−1, Ca2+CN=7 = 18939 cm−1, CN=8 = 20333 cm−1 and Cs+CN=6 = 16325 cm−1, respectively. Fig. 4a) shows the normalized emission spectra for RbBaPO4:Eu2+, NaCaPO4:Eu2+ and CsMgPO4:Eu2+ phosphors under the excitation at 340 nm, and Fig. 4b) shows the coordination environment of the cations Ba2+, Ca2+ and Cs+, which illustrates that Eu2+-activated orthophosphate phosphors are definitely able to realize the blue to red emission for white light-emitting diodes (w-LEDs) application. In addition, a qualitative analysis of the relationship between crystal field splitting (εcfs) and coordination number or polyhedron size is discussed and is presented in Fig. 5. In this work, εc is the centroid shift measured from the excitation spectrum:16 εc (RbBaPO4:Eu2+) < εc (NaCaPO4:Eu2+: Ca2+CN=8) < εc (NaCaPO4:Eu2+: Ca2+CN=7) < εc (CsMgPO4:Eu2+). Dorenbos et al.17–19 reported that the smaller is the coordination number, the larger is the crystal field splitting in various Ce3+-doped phosphors. Similarly, the values of εcfs in Eu2+-doped phosphors are εcfs (RbBaPO4:Eu2+CN=9) < εcfs (NaCaPO4:Eu2+CN=8) < εcfs (NaCaPO4:Eu2+CN=7) < εcfs (CsMgPO4:Eu2+CN=6). Therefore, we obtain the result that the larger are εcfs and εc, the smaller is the wavenumber, which indicates that CsMgPO4:Eu2+ shows the longest emission wavelength at 630 nm among the above phosphors under the same excitation wavelength, and contributes much to the 5d crystal field splitting.
 |
| | Fig. 3 Photoluminescence excitation (PLE) and photoluminescence (PL) spectra of blue-emitting RbBaPO4, green-emitting NaCaPO4 and red-emitting CsMgPO4 phosphors. | |
 |
| | Fig. 4 (a) The normalized emission spectra for RbBaPO4:Eu2+, NaCaPO4:Eu2+ and CsMgPO4:Eu2+ phosphors under excitation at 340 nm. (b) Coordination environment of the cations Ba2+, Ca2+ and Cs+, respectively. | |
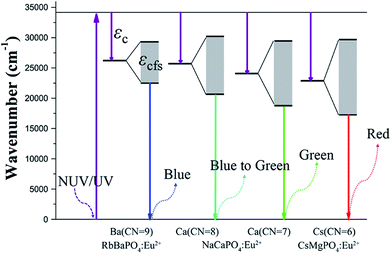 |
| | Fig. 5 Energy diagram of 5d configuration and coordination numbers of Ba2+, Ca2+ and Cs+ in the RbBaPO4:Eu2+, NaCaPO4:Eu2+ and CsMgPO4:Eu2+ hosts. | |
3 Surface topography, thermal decay and quantum efficiency (QE) properties
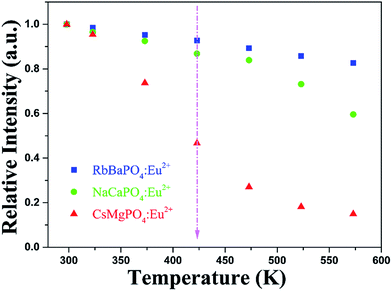
The surface topography of the RbBaPO4:Eu2+, NaCaPO4:Eu2+, CsMgPO4:Eu2+ and the mixture of those tri-color phosphors were inspected using a scanning electron microscope (SEM) to investigate the particle size. Fig. 6 exhibits the SEM images of (a) RbBaPO4:Eu2+, (b) NaCaPO4:Eu2+, (c) CsMgPO4:Eu2+ and (d) the mixture of those tri-color phosphors. It can be seen that all the images are with a wide range of particle size, including agglomerates of the smaller particles, but the particle size of the (a) compound RbBaPO4:Eu2+ is slightly bigger than the other two compounds (b) NaCaPO4:Eu2+ and (c) CsMgPO4:Eu2+. However, when the three phosphors were mixed to acquire the w-LEDs lamp according to the ratio of 1:19:16, based on the relative intensity of the emission spectrum from the same decay test conditions, the SEM image of the mixed phosphor was given in Fig. 6d, which shows that the particle size of the mixture was similar to those three individual samples. From the above results, it can be expected that the three phosphors, i.e. RbBaPO4:Eu2+, NaCaPO4:Eu2+ and CsMgPO4:Eu2+, should be quite suitable to be fabricated for potential application in white LEDs. The thermal decay and quantum efficiency (QE) properties were also measured. As shown in Fig. 7, the relative intensities of temperature-dependent emission spectra for RbBaPO4:Eu2+ and NaCaPO4:Eu2+ show better thermal stabilities, but CsMgPO4:Eu2+ is inferior to the others under excitation at 340 nm. The PL relative intensity CsMgPO4:Eu2+ at 423 K (150 °C) drops to 46.7% of the initial value at room temperature, and it seems to be a disadvantage to adopt this phosphor for white LEDs application because of the low luminescence thermal stability. However, the other two phosphors all have better thermal stabilities, and when the same orthophosphate phosphors of RbBaPO4:0.03Eu2+, NaCaPO4:0.01Eu2+ and CsMgPO4:0.07Eu2+ are blended, the monolithic thermal stability should be improved for potential application in warm white LEDs. From the thermal stability results, it could be expected that the luminescence intensity of CsMgPO4:0.07Eu2+ would have very low QE. Based on the following eqn (2),20| | |
ηQE = ∫LS/(∫ER − ∫ES)
| (2) |
where LS is the luminescence emission spectrum of the sample; ES is the spectrum of the light used for exciting the sample; and ER is the spectrum of the excitation light without the sample in the sphere, all the spectra were collected using the integrating sphere. The measured internal QE values of RbBaPO4:0.03Eu2+, NaCaPO4:0.01Eu2+ and CsMgPO4:0.07Eu2+ phosphors were determined to be about 54.06%, 36.33% and 13.40% under 340 nm excitation, respectively. The QE values are consistent with the results of the thermal stability property.
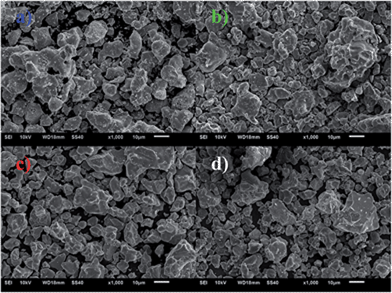 |
| | Fig. 6 SEM images of the (a) RbBaPO4:Eu2+ and (b) NaCaPO4:Eu2+ (c) CsMgPO4:Eu2+ and (d) the mixture of those tri-color phosphors with a wide range of particle size, including agglomerates of the smaller particles. | |
 |
| | Fig. 7 The relative intensities of temperature-dependent emission spectra for RbBaPO4:0.03Eu2+, NaCaPO4:0.01Eu2+ and CsMgPO4:0.07Eu2+ samples under 340 nm excitation. | |
4 CIE chromaticity coordinates and electroluminescence properties
The CIE chromaticity diagrams for RbBaPO4:Eu2+, NaCaPO4:Eu2+ and CsMgPO4:Eu2+ phosphors are shown in Fig. 8, and the insets show the digital phosphor images under 365 nm UV-lamp excitation. All phosphors show intense emission, which indicates they can be applied to the white light-emitting diodes as the three primary color components. In order to evaluate the actual potential application of the phosphors for pc-WLEDs, a w-LED lamp was successfully fabricated by the combination of a 370 nm n-UV InGaN chip and blue-emitting RbBaPO4:Eu2+, green-emitting NaCaPO4:Eu2+ as well as red-emitting CsMgPO4:Eu2+ phosphors; moreover, the ratio of the content of the three phosphors for the fabrication is 1:19:16, based on the relative intensity of emission spectrum from the same decay test conditions. Photoluminescence and electroluminescence spectra of the same compounds are shown in Fig. 9. Fig. 9a shows the PL spectra under the excitation at 370 nm before fabrication, which reveals a low color rendering index (CRI) of 72 and a high correlated color temperature (CCT) of 5656 K with coordinates of (0.3295, 0.3052), while the fabricated w-LED lamp generates a warmer CCT of 2751 K and a superior CRI of 86 with coordinates of (0.3744, 0.3153). Note that the inset to Fig. 9b shows a photograph of a white-light emission when driven by a 25 mA current. Moreover, the EL spectra in Fig. 9b shows a distinctive phenomenon that the two emission peaks of RbBaPO4:Eu2+ and NaCaPO4:Eu2+ decreased while the emission peak of CsMgPO4:Eu2+ increased. The PL and PLE spectra of these tri-color phosphors are shown in Fig. 10, and it is found that the excitation peaks for RbBaPO4:Eu2+ (near 420 nm) and NaCaPO4:Eu2+ (near 510 nm) phosphors appear to laterally overlap with emission peaks of the mixed PL spectra from a range of 400 nm to 530 nm, as shown in the dashed area of Fig. 10, where CsMgPO4:Eu2+ phosphor can absorb the blue and green lights emitted by RbBaPO4:Eu2+ and NaCaPO4:Eu2+. This can clarify the mechanism of self-absorption in the mixture between those tri-color phosphors,21 which enhances the long wavelength emissions for w-LEDs compared with a blue InGaN LED chip with a yellow phosphor YAG:Ce3+. Therefore, the fabrication experiment of the w-LED lamp demonstrates that such phosphors and their mixing strategy are promising for w-LEDs.
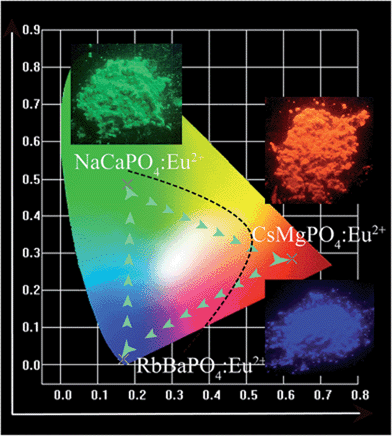 |
| | Fig. 8 CIE chromaticity diagram and selected phosphor images of blue-emitting RbBaPO4, green-emitting NaCaPO4 and red-emitting CsMgPO4 orthophosphate phosphors under 365 nm UV-lamp excitation. | |
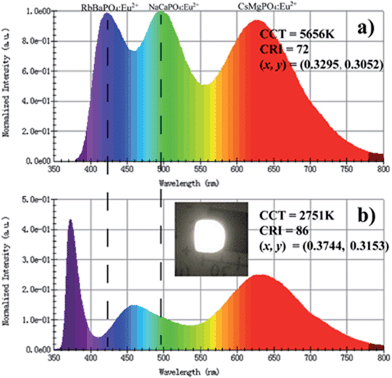 |
| | Fig. 9 Photoluminescence and electroluminescence spectra combined with RbBaPO4:Eu2+, NaCaPO4:Eu2+ and CsMgPO4:Eu2+ orthophosphate phosphors: (a) PL spectra under excitation at 370 nm. (b) EL spectra of w-LED lamp fabricated using a 370 nm n-UV chip. | |
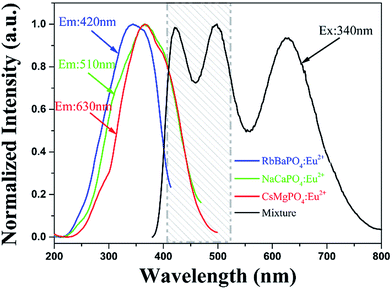 |
| | Fig. 10 Photoluminescence excitation (PLE) spectrum of blue-emitting RbBaPO4, green-emitting NaCaPO4 and red-emitting CsMgPO4 phosphors and photoluminescence (PL) spectra for the mixture of those tri-color phosphors. | |
IV. Conclusions
In summary, blue-emitting RbBaPO4:Eu2+, green-emitting NaCaPO4:Eu2+ and red-emitting CsMgPO4:Eu2+ phosphors were prepared by a high temperature, solid-state reaction method. The emission peaks near 430 nm, 510 nm and 630 nm for the obtained samples are ascribed to the 4f–5d transition of Eu2+. The qualitative analysis between crystal field splitting and coordination number or polyhedron size were employed to explain the observed emission spectra. A white light-emitting diode (LED) lamp was fabricated based on these phosphors combining a 370 nm n-UV chip showing a high color rendering index (CRI) of 86 and a warm correlated color temperature (CCT) of 2751 K, which indicated that the Eu2+-activated versatile orthophosphate phosphors have potential application in warm white LEDs.
Acknowledgements
The present work was supported by the National Natural Science Foundation of China (Grant no. 51002146, no. 51272242), the Natural Science Foundation of Beijing (2132050), the Program for New Century Excellent Talents in University of Ministry of Education of China (NCET-12-0950), the Beijing Nova Program (Z131103000413047), the Beijing Youth Excellent Talent Program (YETP0635) and the Funds of the State Key Laboratory of New Ceramics and Fine Processing, Tsinghua University (KF201306).
References
- Z. G. Xia, Y. Y. Zhang, M. S. Molokeev, V. V. Atuchin and Y. Luo, Sci. Rep., 2013, 3, 3310 Search PubMed.
- Z. G. Xia, X. M. Wang, Y. X. Wang, L. B. Liao and X. P. Jing, Inorg. Chem., 2011, 50, 10134 CrossRef CAS PubMed.
- S. Lee and S. Y. Seo, J. Electrochem. Soc., 2002, 149, 85–88 CrossRef PubMed.
- C. C. Lin, Y. S. Tang, S. F. Hu and R. S. Liu, J. Lumin., 2009, 129, 1682–1684 CrossRef CAS PubMed.
- C. L. Zhao, Z. G. Xia and S. X. Yu, J. Mater. Chem. C, 2014, 2, 6032–6039 RSC.
- Z. P. Yang, G. W. Yang, S. L. Wang, J. Tian, X. N. Li, Q. L. Guo and G. S. Fu, Mater. Lett., 2008, 62, 1884–1886 CrossRef CAS PubMed.
- Y. L. Huang and H. J. Seo, J. Electrochem. Soc., 2011, 158, 260–263 CrossRef PubMed.
- C. C. Lin, Z. R. Xiao, G. Y. Guo, T. S. Chan and R. S. Liu, J. Am. Chem. Soc., 2010, 132, 3020–3028 CrossRef CAS PubMed.
- L. El Ammari and B. Elouadi, J. Alloys Compd., 1992, 188, 99–101 CrossRef.
- M. Ben Amara, M. Vlasse, G. le Flem and P. Hagenmuller, Acta Crystallogr., Sect. C: Cryst. Struct. Commun., 1992, 38, 127–220 Search PubMed.
- N. Y. Strutynska, I. V. Zatovsky, V. N. Baumer and N. S. Slobodyanik, Acta Crystallogr., Sect. E: Struct. Rep. Online, 2009, 65, i58 CAS.
- A. C. Larson and R. B. Von Dreele, Los Alos National Laboratory Report (LAUR), 1994, vol. 86, p. 748 Search PubMed.
- R. D. Shannon, Acta Crystallogr., 1976, A32, 751–767 CrossRef CAS.
- G. Blasse and B. C. Grabmaier, Luminescent Materials, Springer Verlag, Berlin, 1994 Search PubMed.
- L. G. Van Uitert, J. Lumin., 1984, 29, 1 CrossRef CAS.
- C. Kulshreshtha, A. K. Sharma and K. Sun Sohn, J. Electrochem. Soc., 2009, 156, J52–J56 CrossRef CAS PubMed.
- P. Dorenbos, Phys. Rev. B: Condens. Matter Mater. Phys., 2000, 62, 15650 CrossRef CAS.
- P. Dorenbos, Phys. Rev. B: Condens. Matter Mater. Phys., 2001, 64, 125 CrossRef.
- P. Dorenbos, L. Pierron, L. Dinca, C. W. E. van Eijk, A. Kahn-Harari and B. Viana, J. Phys.: Condens. Matter, 2003, 15, 511 CrossRef CAS.
- M. A. Reshchikov, X. Gu, B. Nemeth, J. Nause and H. Morkoc, Mater. Res. Soc. Symp. Proc., 2006, 892, 0892 Search PubMed.
- N. Kaihovirta, A. Asadpoordarvish, A. Sandström and L. Edman, ACS Photonics, 2014, 1, 182–189 CrossRef CAS.
|
| This journal is © The Royal Society of Chemistry 2014 |
Click here to see how this site uses Cookies. View our privacy policy here.