
 Open Access Article
 This Open Access Article is licensed under a
 Creative Commons Attribution 3.0 Unported Licence
Natural product mixture analysis by matrix-assisted DOSY using Brij surfactants in mixed solvents†
Mariano G. S.
Vieira
a,
Nilce V.
Gramosa
a,
Nágila M. P. S.
Ricardo
a,
Gareth A.
Morris
b,
Ralph W.
Adams
 b and
Mathias
Nilsson
*bc
b and
Mathias
Nilsson
*bc
aDepartment of Organic and Inorganic Chemistry, Federal University of Ceara Fortaleza, Ceara, CP 12 200, Brazil
bSchool of Chemistry, University of Manchester, Oxford Road, Manchester, M13 9PL, UK. E-mail: mathias.nilsson@manchester.ac.uk
cDepartment of Food Science, University of Copenhagen, Rolighedsvej 30, DK-1958 Frederiksberg C, Denmark
First published on 18th August 2014
Abstract
The assignment of NMR signals to specific components in a mixture is a challenging task. Diffusion-Ordered Spectroscopy (DOSY) has provided important progress in this area, allowing the signals originating from individual components of different molecular sizes to be distinguished. However, when the sizes of the compounds are similar and/or the spectra are overlapped, signal assignment can easily become intractable. The use of a co-solute in a matrix-assisted DOSY (MAD) experiment can be a useful solution, improving diffusional (and sometimes spectral) resolution by exploiting selective binding to the matrix. MAD has generated promising results in the study of several types of mixtures, including those of functional and structural isomers. The challenge is to apply MAD to molecules with high structural similarity, for example in natural product mixtures. Various surfactants, including SDS, AOT and CTAB have previously been shown to be effective in MAD analysis. Here we present an important addition, the Brij family of nonionic surfactants. We demonstrate the use of Brij micelles in mixed solvents with a variety of mixtures relevant to natural products.
Introduction
NMR is arguably the most powerful technique for the elucidation of chemical structure, but the spectra of mixtures are often very overlapped, which greatly complicates assignment. Diffusion-Ordered Spectroscopy (DOSY)1,2 provides a 2D spectrum in which the second dimension disperses signals as a function of diffusion coefficient, allowing signals originating from components of different molecular sizes to be distinguished,1 and hence is very useful in mixture analysis. A DOSY experiment encodes diffusion information into the attenuation of individual signal amplitudes in a series of spectra,3 and is typically performed using modern versions of the pulsed field gradient stimulated echo (PFGSTE) sequence, such as the Oneshot sequences.4,5 Differentiation between signals is, however, naturally only possible when species diffuse at different rates. Many types of mixture, notably natural products, contain chemically cognate species of very similar sizes, and here the standard DOSY experiment is at best of limited value. However, by manipulating the matrix in which the solutes diffuse, differential binding can be exploited to facilitate separation of signals in a “matrix-assisted DOSY” (MAD) experiment.6In a successful MAD experiment, the analytes interact to different extents with a slowly-diffusing co-solute (e.g. micellar surfactant) in fast exchange. The average solute diffusion coefficient, Dav, is then given by Lindman's law:
| Dav = Dupu + Dbpb, |
MAD has been used in the resolution of a variety of organic mixtures, including mixtures of isomers, exploiting selective co-solute binding that depends on such factors as polarity, amphiphilicity and stereochemistry, resulting in altered diffusion coefficients and allowing the separation of the individual component spectra. SDS and AOT (micelles and reverse micellar aggregates, respectively) have been shown to be useful tools in the separation of signals of dihydroxybenzenes,6 monomethoxyphenols8,9 (in both cases positional isomers), and medium chained alcohols9 in MAD experiments. SDS micelles have also been used with a mixed solvent system, allowing complete identification of each component in flavonoid mixtures.10 Polymers like polyvinylpyrrolidone (PVP)11 and polyethylene glycol (PEG)12 have also been used as efficient matrices in MAD. β-Cyclodextrin13,14 has been used as a chiral matrix, allowing the resolution of a mixture of two native epimers of naringin.13 Microemulsions have been used to separate the component signals in commercial drug formulations.15 A simple change of solvent can also be effective.16
Even solids like silica (SiO2) powder and ODS – (octadecylsilane) coated chromatographic stationary phases can be used as matrices, and have been shown to allow the separation of signals in a mixed, homologous series of aromatic compounds.17 When a solid matrix is used, an HRMAS-DOSY18 experiment may be needed to provide adequate signal resolution. Satisfactory resolution of signals has been demonstrated in such experiments, but one complication is of course the necessity for sufficient resolution in the chemical shift dimension, which is more difficult to achieve in heterogeneous media.19 Here, choosing a liquid phase that is matched in magnetic susceptibility to the solid can allow standard liquid-state NMR methods to be applied.20 Silica-based methods predominantly separate solute signals according to their hydrogen-bonding affinity, primarily distinguishing between solutes with different functional groups.21
Flavonoids are an important family of natural compounds with interesting biological properties, most importantly as antioxidants;22 over 4000 types of flavonoid compounds have been identified in vascular plants.23 Monoterpenes are also important compounds, and are the main constituents in the majority of plant essential oils. They give plants their unique odoriferous properties and are volatile because of their low boiling points.24 HPLC is often used to separate the components of plant extracts, with the fractions then being identified and characterised using mass spectrometry and/or NMR.25 The use of DOSY (and MAD) can enable identification directly in an intact mixture, or in a fraction containing inseparable components. Most MAD analyses have hitherto been performed in aqueous solution, in which many natural product compounds of interest, including monoterpenes, have low solubility. It is therefore of interest to explore alternative solvent systems in which the solubilities of these compounds are higher.
Various surfactants, including SDS, AOT and CTAB, have already been used in MAD analysis,6,8,9 but not the Brij family of nonionic surfactants. These consist of a hydrophilic head containing a variable number of polyoxyethylene groups, and a hydrophobic polymethylene tail.26 Brij surfactants have been used as carriers in drug delivery27 due to their low toxicity,28 and in solubilization of drugs that have low water solubility.26 Previous studies have shown that surfactants like SDS can form micelles in binary solvent systems,29,30 but there are no such reports for the Brij family. Here, we demonstrate the use of Brij 78 and 98 (Scheme 1; Table 1) in mixed water–DMSO solution in MAD experiments primarily aimed at molecules with low solubility in water.
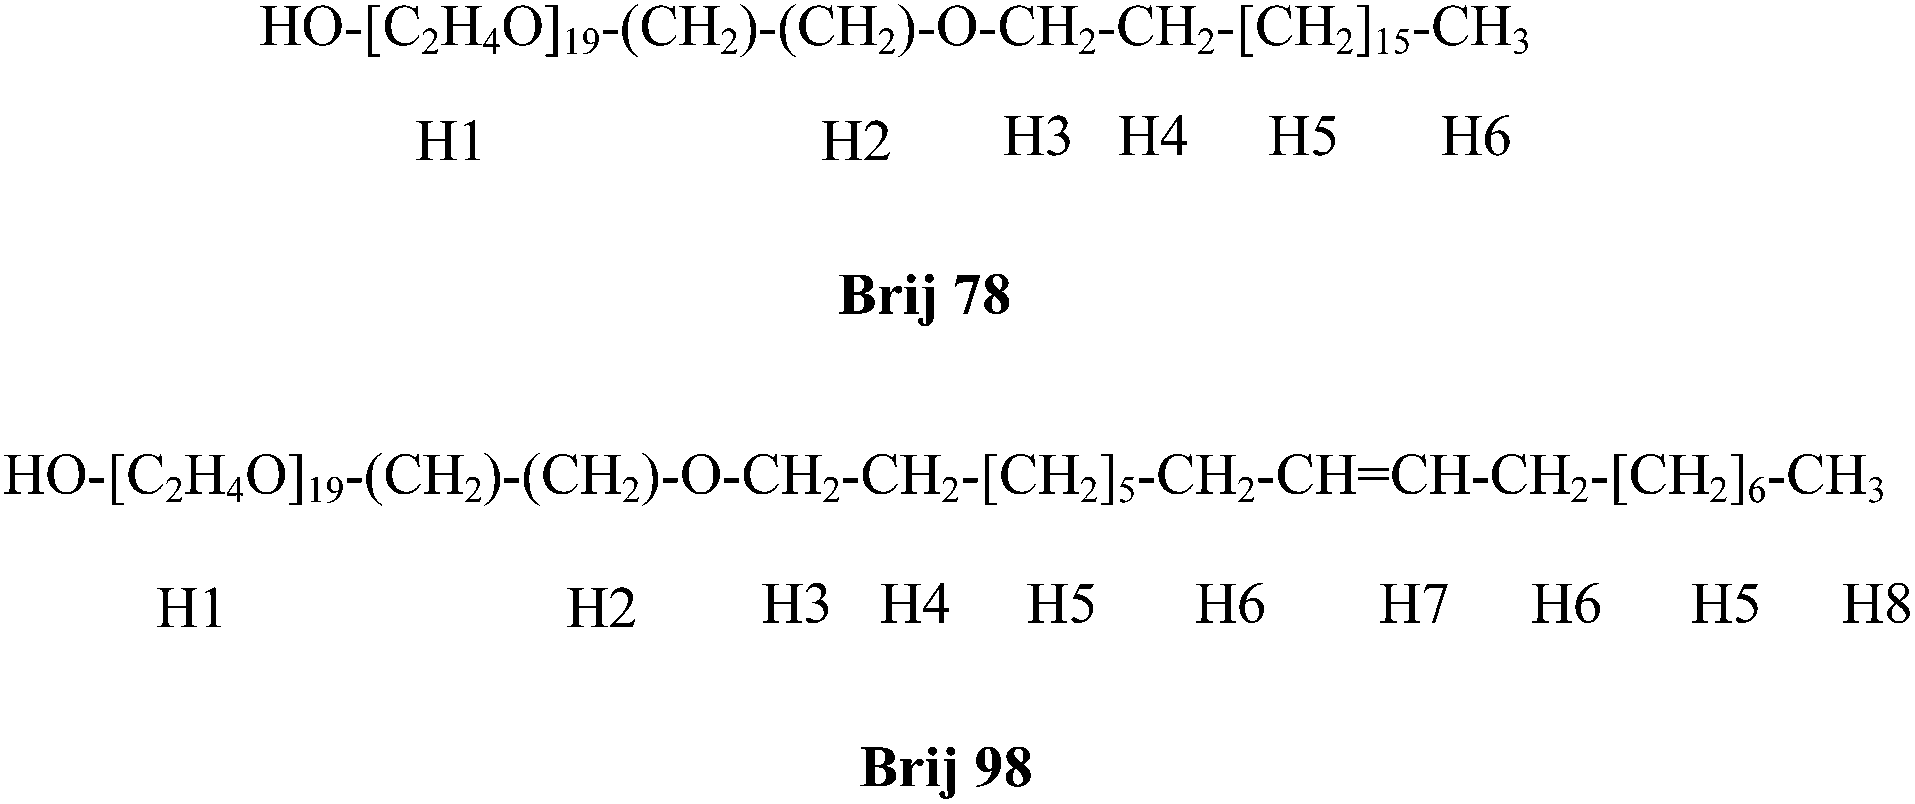 | ||
| Scheme 1 Structures of Brij 78 and Brij 98. | ||
| Trade name | Average molecular formula | Molar mass (g mol−1) | CMCa (mM) | CMCb (mM) |
|---|---|---|---|---|
| a Reported critical micelle concentration in water at 25 °C. b Critical micelle concentration measured in DMSO-d6–D2O. | ||||
| Brij 78 | C18H37(OCH2CH2)20OH | 1152 | 0.046 (ref. 31) | 8.0 |
| Brij 98 | C18H35(OCH2CH2)20OH | 1150 | 0.025 (ref. 32) | 6.7 |
Results and discussion
Micelle formation of Brij 78 and 98 was investigated in the mixed solvents used. Critical micelle concentrations (CMC) were determined using DOSY experiments on surfactant solutions ranging in concentration from 1.0 to 15.0 mM. For Brij 78, these solutions were in 20% DMSO-d6–80% D2O (v/v) and for Brij 98 in 50% DMSO-d6–50% D2O (v/v). CMC's were determined by plotting the diffusion coefficient D against the inverse of Brij concentration. Straight lines were fitted above and below the break point, one corresponding to the monomeric and other to the partially aggregated forms of Brij. The CMC value was taken as the intersection of these two lines (Fig. 1).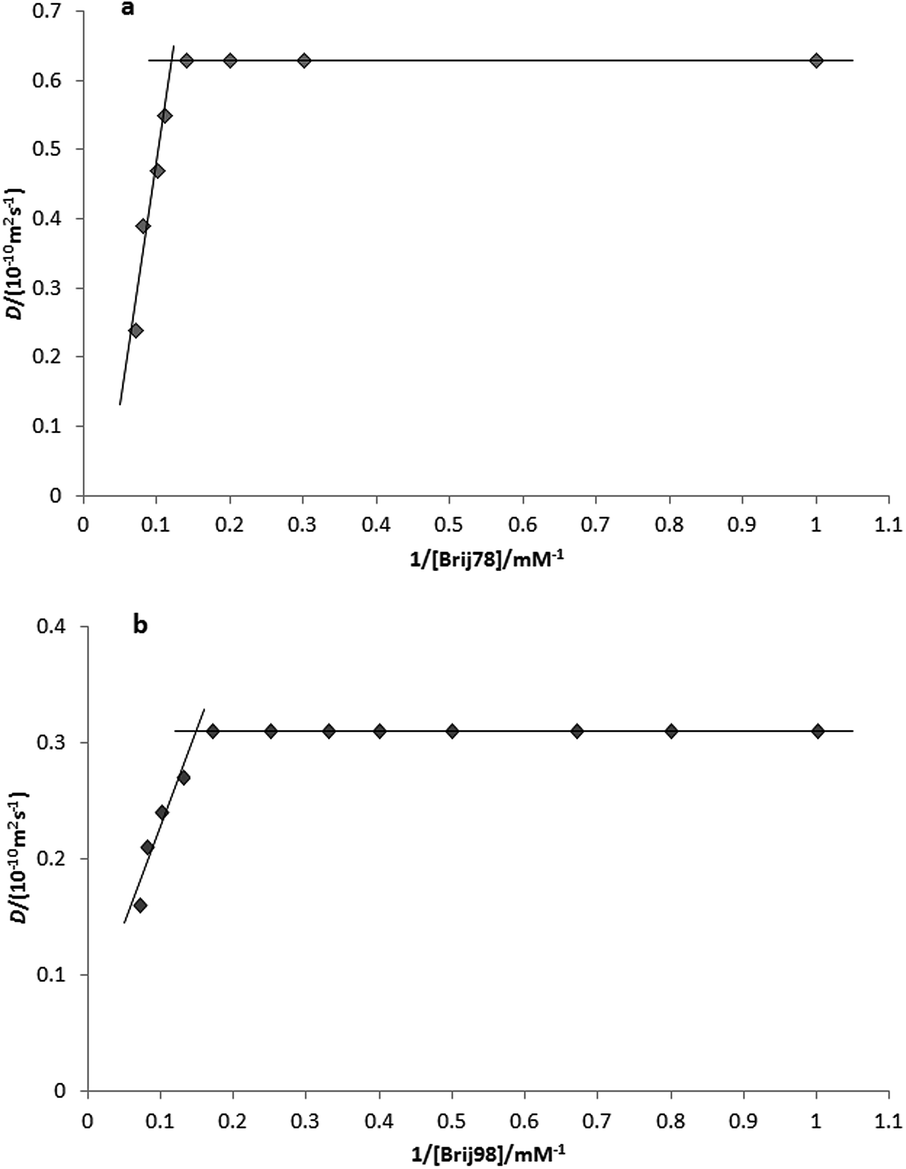 | ||
| Fig. 1 Plot of measured diffusion coefficient, D, against inverse of total surfactant concentration (a) for Brij 78 in 20% DMSO-d6–80% D2O (v/v) (b) for Brij 98 in 50% DMSO-d6–50% D2O (v/v). | ||
The Brij 78 CMC changed from a reported value of 0.046 mM in pure D2O (ref. 31) to 8.0 mM in 20% DMSO-d6–80% D2O (v/v), and that of Brij 98 from a reported value in pure D2O of 0.025 mM (ref. 32) to 6.7 mM in 50% DMSO-d6–50% D2O (v/v).
The CMC behavior of various PEO-block copolymers has been investigated in water–ethanol mixed solvents.33–35 These studies have shown that the CMC increased after addition of ethanol. The addition of DMSO-d6 to D2O seems to show the same tendency, providing better solvent conditions for the Brij 78 and 98 compared to pure D2O and disfavoring the formation of micelles (self-assembly). Further thermodynamic studies would be useful to understand this observation better.
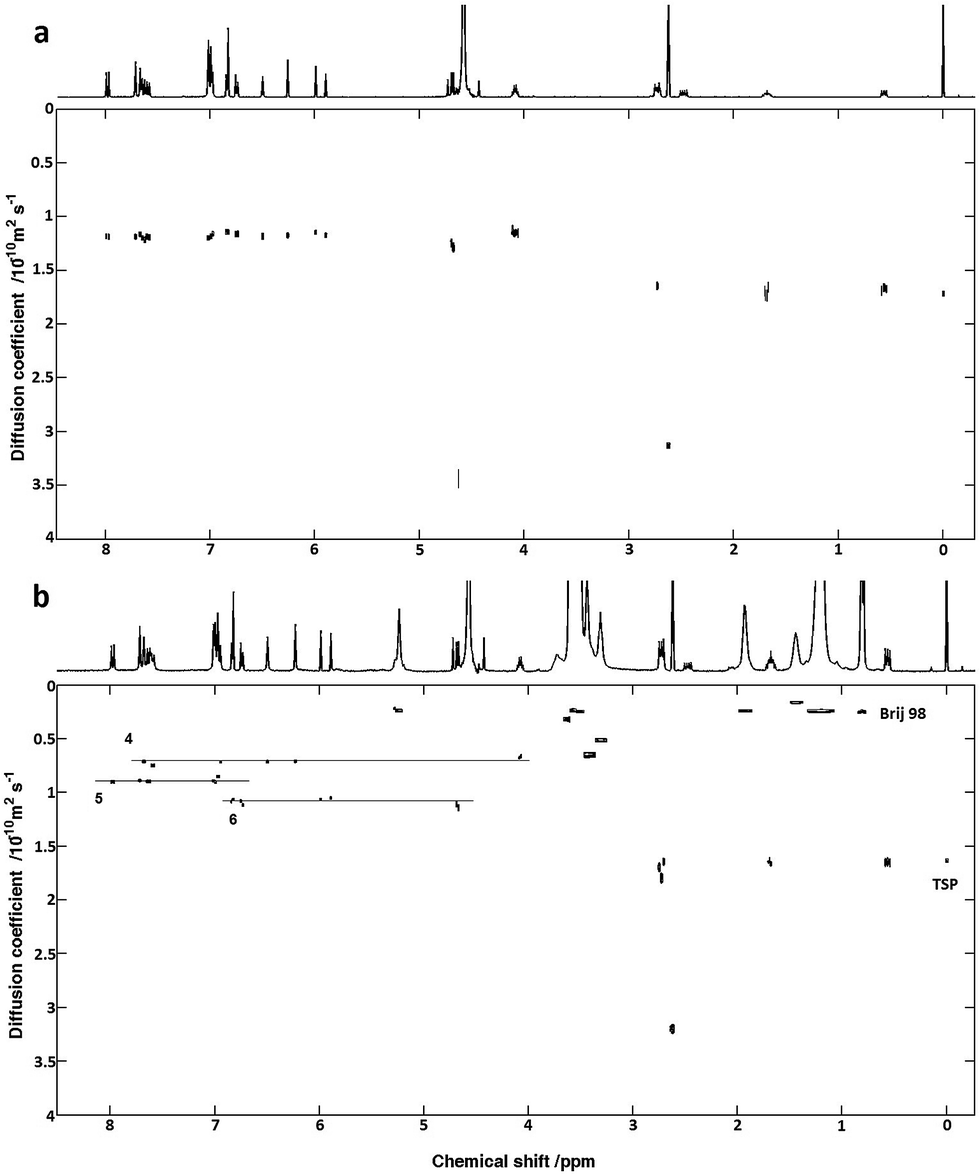
To demonstrate the use of DOSY and MAD for mixtures containing monoterpenes and flavonoids, a test system of 6 compounds (Scheme 2) was chosen for analysis. Standard DOSY spectra of a mixture of the monoterpenes (Scheme 2, compounds 1–3) in 20% DMSO-d6–80% D2O (v/v) shows a separation of L-(−)-carvone (3) signals from those of the other two compounds, carvacrol (1) and thymol (2) (Fig. 2a). This is unexpected given the very similar molecular weights, but may reflect both the difference in shape and the reduced propensity to hydrogen bonding, and shows the potential of DOSY to separate the signals even of quite similar species.
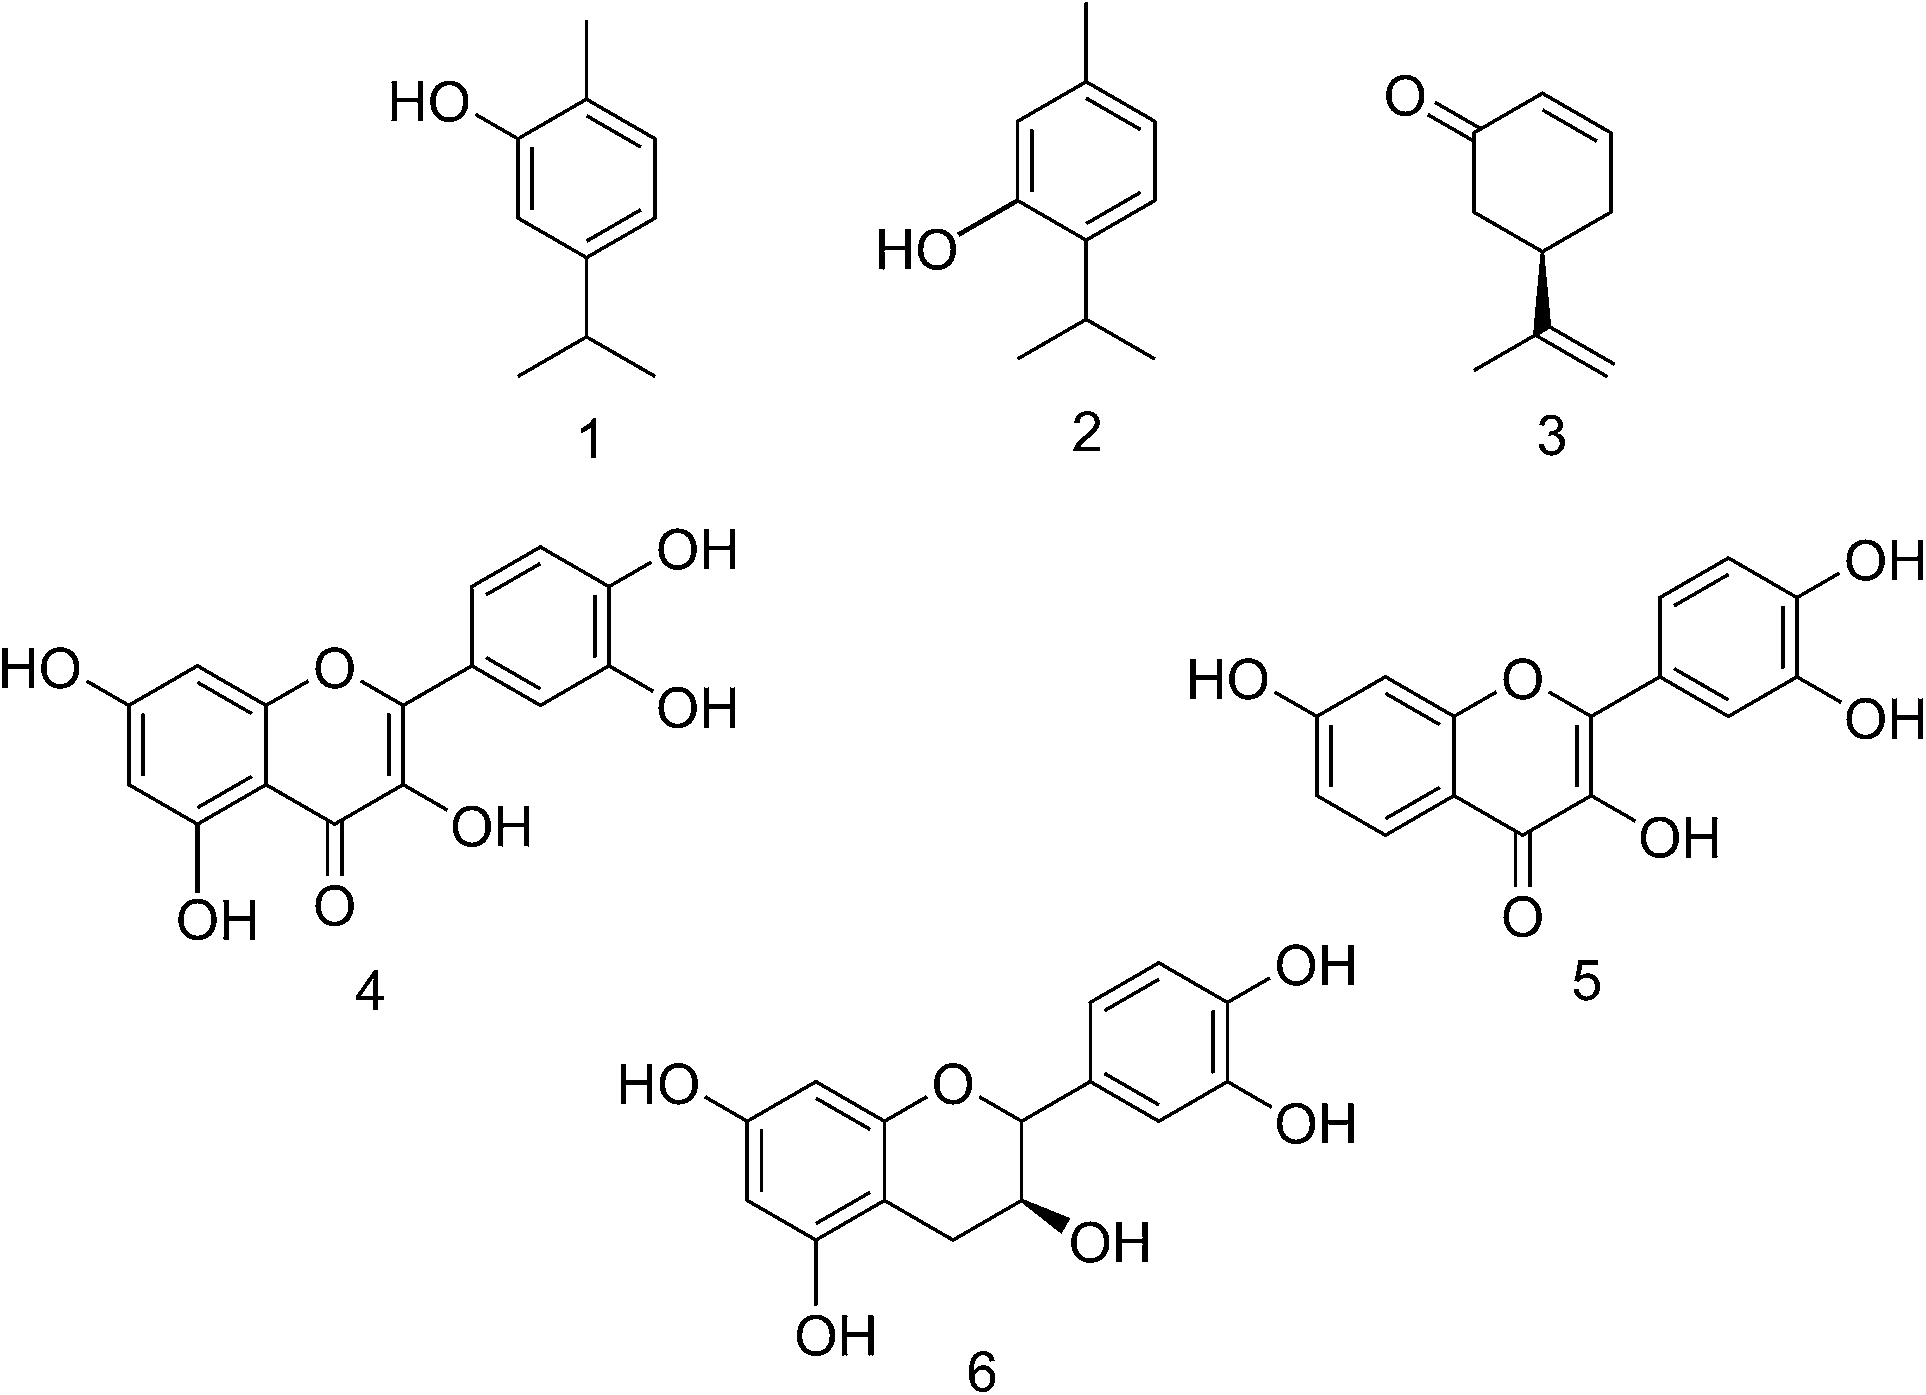 | ||
| Scheme 2 Structures of the monoterpenes carvacrol (1), thymol (2) and L-(−)-carvone (3) and flavonoids quercetin (4), fisetin (5) and (+)-catechin (6). | ||
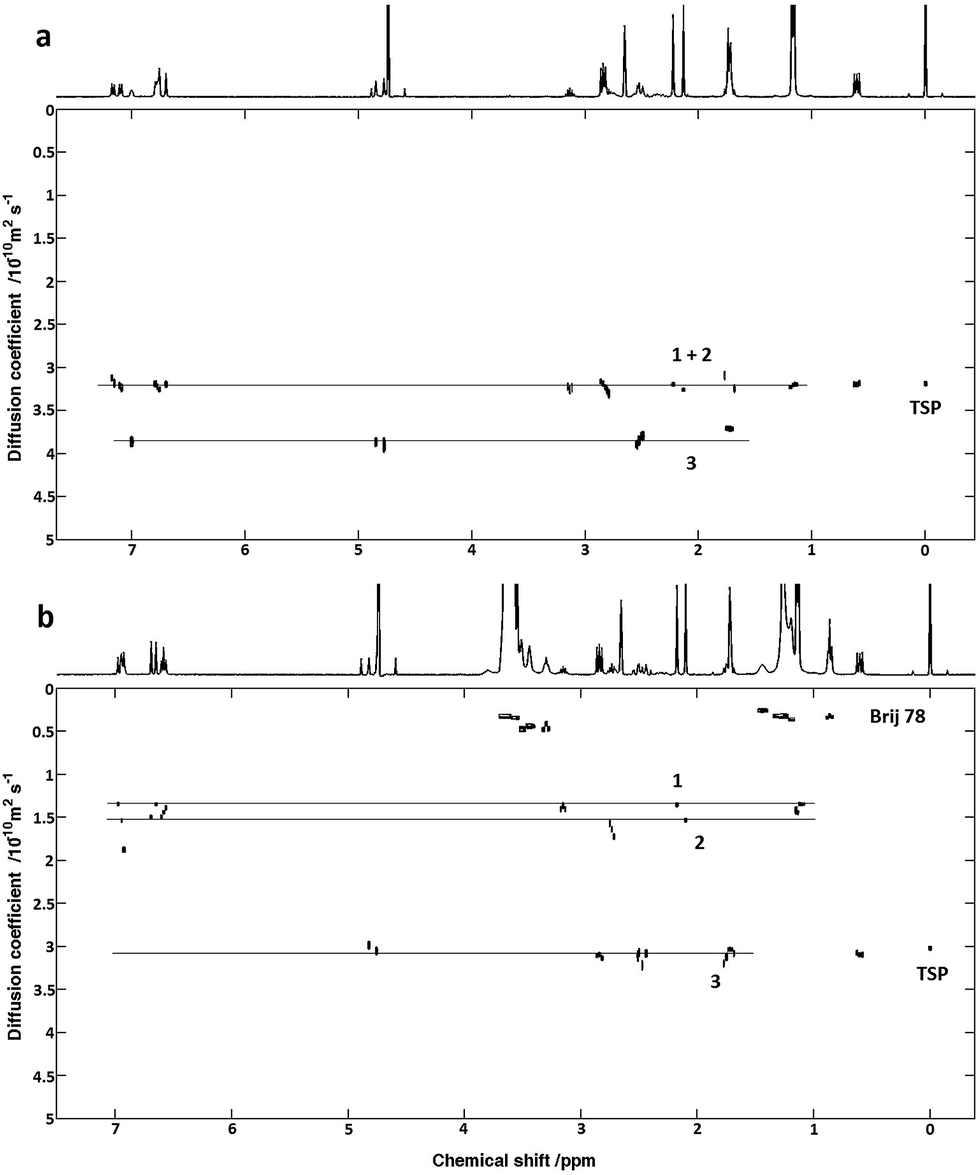 | ||
| Fig. 2 Oneshot DOSY spectra of monoterpenes 1, 2 and 3, in 20% DMSO-d6–80% D2O (v/v) before (a) and after (b) addition of 5 mM Brij 78. | ||
Adding Brij 78, the monoterpenes 1 and 2 show strong association with the micelles, while compound 3 interacts only weakly. The strength of interaction with Brij 78 is clearly different for compounds 1 and 2, and the signals separate in the diffusion domain (Fig. 2b), making it possible to identify all of the three compounds. On addition of Brij 98, resolution of 1 and 2 is less pronounced and when using SDS in 20% DMSO-d6–80% D2O (v/v) as co-solute, no resolution is observed between 1 and 2 (results not shown). The effect of Brij 78 concentration was investigated using samples containing 3.0 mM of each monoterpene (Fig. 3) with best resolution achieved at 5.0 mM surfactant.
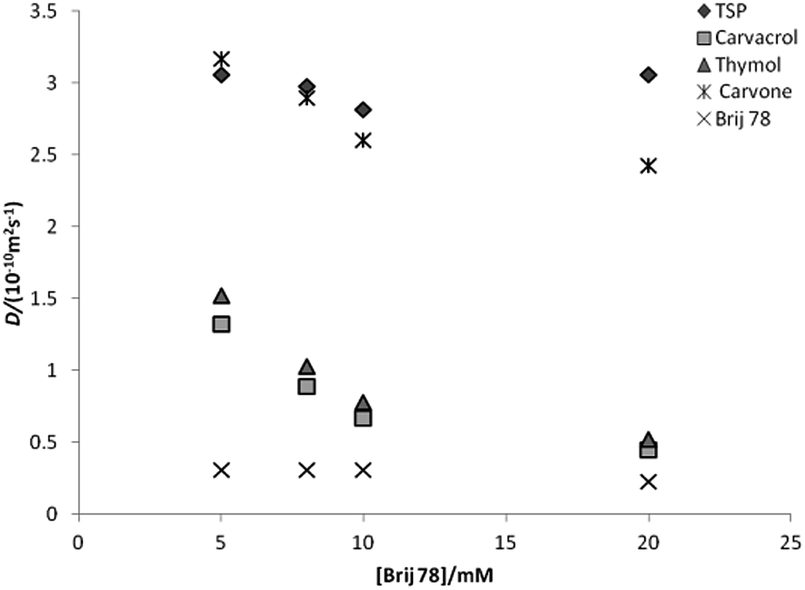 | ||
| Fig. 3 Diffusion coefficients as a function of Brij 78 concentration for a 20% DMSO-d6–80% D2O (v/v) solution containing trimethylsilyl propionate (TSP) as reference and 3.0 mM of each of monoterpenes 1, 2 and 3. | ||
For the flavonoid mixture (Scheme 2, compounds 4, 5 and 6), the standard DOSY spectrum in 50% DMSO-d6–50% D2O (v/v) shows all signals having very similar diffusion coefficients (Fig. 4a). On adding Brij 98, the signals of the three flavonoids become well resolved in the diffusion dimension, allowing individual characterization (Fig. 4b) and improving on earlier results obtained with SDS.10 The effect of Brij 98 concentration was also investigated using samples containing 5.0 mM of each of the flavonoids (Fig. 5). The best resolution was obtained with 10 mM of Brij 98; the CMC in this mixed solvent was measured as 8.0 mM (Fig. 1).
 | ||
| Fig. 4 Oneshot DOSY spectra of flavonoids 4, 5 and 6, before (a) and after (b) addition of Brij 98 (10 mM) in 50% v/v DMSO-d6–D2O. Contour levels are set to show a representative proportion of reporter signals. | ||
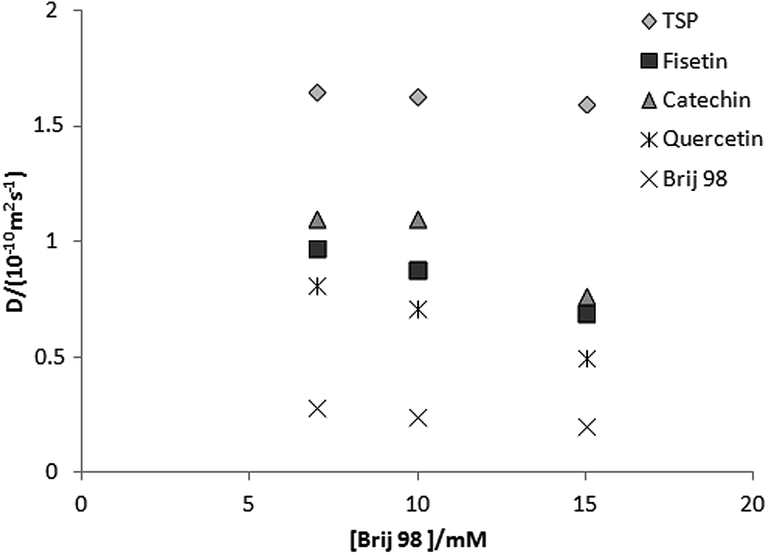 | ||
| Fig. 5 Diffusion coefficients as a function of Brij 98 concentration for a 50% v/v DMSO-d6–D2O solution containing with trimethylsilyl propionate (TSP) as reference and 5.0 mM of each flavonoid. | ||
Brij 78 proved to be insoluble in 50% DMSO-d6–50% D2O (v/v), not allowing analysis of the flavonoid mixtures.
Comparing the chemical shifts of the Brij signals before and after addition of interacting compounds can give some insight into the nature of the association between solute and micelle. Changes for particular resonances suggest that the local environment surrounding the corresponding hydrogen atom has changed, evidencing the presence of the solute near that hydrogen.36,37
For Brij 78, the peaks corresponding to the protons on the first ethoxylate group and others close by (3.54, 3.41 and 1.54 ppm, respectively) experienced the greatest upfield shift in the presence of L-(−)-carvone (1), thymol (2) and carvacrol (3). The remaining ethylene oxide chain showed little change in chemical shift and the nonpolar chain showed no change (Table 2).
| Chemical shift in Brij 78 | Upfield shifta (Δ ppm) | Chemical shift in Brij 98 | Upfield shiftb (Δ ppm) | |
|---|---|---|---|---|
| a With addition of 3.0 mM of monoterpenes 1, 2 and 3. b With addition of 5.0 mM of flavonoids 4, 5 and 6. | ||||
| H1 | 3.66 | 0.01 | 3.59 | 0.01 |
| H2 | 3.54 | 0.10 | 3.46 | 0.02 |
| H3 | 3.41 | 0.11 | 3.34 | 0.03 |
| H4 | 1.54 | 0.10 | 1.47 | 0.03 |
| H5 | 1.26 | 0.00 | 1.21 | 0.01 |
| H6 | 0.86 | 0.00 | 1.95 | 0.02 |
| H7 | — | — | 5.25 | 0.02 |
| H6 | — | — | 0.82 | 0.02 |
For the monoterpenes, the strength of binding increases in the order carvone < thymol < carvacrol, the same order as that of estimated octanol–water partition coefficient (log![[thin space (1/6-em)]](https://www.rsc.org/images/entities/char_2009.gif) P): 2.70, 3.34 and 3.82, respectively (estimated using Molinspiration Cheminformatics® software tool)38 as a measure of molecular hydrophobicity. This is consistent with the hypothesis of incorporation into a micellar core. However, considering the hydrocarbon chain as the core of the micelle and the ethoxylate chain as the shell region, in the Brij 78 case it would appear that the monoterpenes are preferentially bound at the core/shell interface.
P): 2.70, 3.34 and 3.82, respectively (estimated using Molinspiration Cheminformatics® software tool)38 as a measure of molecular hydrophobicity. This is consistent with the hypothesis of incorporation into a micellar core. However, considering the hydrocarbon chain as the core of the micelle and the ethoxylate chain as the shell region, in the Brij 78 case it would appear that the monoterpenes are preferentially bound at the core/shell interface.
Brij 98 exhibits a different pattern to Brij 78, with all protons in the chain exhibiting changes in chemical shift in the presence of quercetin (4), fisetin (5) and (+)-catechin (6). The hydrocarbon chain closest to the EO chain (H3 and H4) experiences the greatest upfield shift upon addition of flavonoids. The EO chain (H1) and the nonpolar chain (H8) also experience chemical shift changes, but to a smaller degree (Table 2). As with the monoterpenes, the flavonoids appear to be concentrated at the core/shell interface, but their effects spread throughout the EO and hydrocarbon chains, presumably because of their significantly larger size.
Conclusions
We demonstrate efficient methodologies for NMR analysis of monoterpene and flavonoid mixtures, using for the first time nonionic Brij surfactants in binary solvent mixtures in MAD experiments. In the particular cases studied, Brij 78 and 98 showed better discrimination than SDS, the surfactant currently most commonly used in MAD.Experimental section
NMR experiments were carried out non-spinning on a Varian Inova 400 MHz spectrometer. Temperature control was set to 25 °C. The Oneshot pulse sequence4,39 was used for DOSY experiments, using a diffusion-encoding pulse width (δ) of 3 ms, a diffusion delay (Δ) of 200 ms and nominal gradient strengths ranging from 5.0 to 27.0 G cm−1 with 32 gradient amplitudes increased in equal steps of gradient squared. TSP was used as internal reference for reference deconvolution40 in all the samples. All processing was done in the DOSY Toolbox,41 and in all DOSY processing the data were corrected for the effect of non-uniform pulsed field gradients.42Experiments carried out to determine the Brij critical micelle concentrations (CMCs) were performed with a diffusion-encoding pulse width (δ) of 4.5 ms and a diffusion delay (Δ) of 400 ms, using Brij solutions prepared by dilution from a stock solution.
Acknowledgements
This work was supported by the Engineering and Physical Sciences Research Council (Grant Numbers EP/H024336/ and, EP/I007989/1), and thanks are offered to the CAPES Foundation, Ministry of Education of Brazil, Brasília, Brazil.Notes and references
- C. S. Johnson Jr, Prog. Nucl. Magn. Reson. Spectrosc., 1999, 34, 203 CrossRef.
- G. A. Morris, in Encyclopedia of Nuclear Magnetic Resonance, ed. D. M. Grant and R. K. Harris, John Wiley & Sons Ltd, 2002, vol. 9 Search PubMed.
- O. E. Stejskal and J. E. Tanner, J. Chem. Phys., 1965, 42, 288 CrossRef PubMed.
- M. D. Pelta, G. A. Morris, M. J. Stchedroff and S. J. Hammond, Magn. Reson. Chem., 2002, 40, S147–S152 CrossRef CAS PubMed.
- A. Botana, J. A. Aguilar, M. Nilsson and G. A. Morris, J. Magn. Reson., 2011, 208, 270 CrossRef CAS PubMed.
- R. Evans, S. Haiber, M. Nilsson and G. A. Morris, Anal. Chem., 2009, 81, 4548 CrossRef CAS PubMed.
- B. Lindman and B. Brun, J. Colloid Interface Sci., 1973, 42, 388 CrossRef CAS.
- C. F. Tormena, R. Evans, S. Haiber, M. Nilsson and G. A. Morris, Magn. Reson. Chem., 2010, 48, 550 CrossRef CAS PubMed.
- C. F. Tormena, R. Evans, S. Haiber, M. Nilsson and G. A. Morris, Magn. Reson. Chem., 2012, 50, 458 CrossRef CAS PubMed.
- J. Cassani, M. Nilsson and G. A. Morris, J. Nat. Prod., 2012, 75, 131 CrossRef CAS PubMed.
- J. S. Kavakka, I. Kilpeläinen and S. Heikkinen, Org. Lett., 2009, 11, 1349 CrossRef CAS PubMed.
- J. S. Kavakka, V. Parviainen, K. Wähälä, I. Kilpeläinen and S. Heikkinen, Magn. Reson. Chem., 2010, 48, 777 CrossRef CAS PubMed.
- R. W. Adams, J. A. Aguilar, J. Cassani, G. A. Morris and M. Nilsson, Org. Biomol. Chem., 2011, 9, 7062 CAS.
- S. R. Chaudhari, Srinivasa and N. Suryaprakash, J. Mol. Struct., 2013, 1033, 75 CrossRef CAS PubMed.
- C. Pemberton, R. E. Hoffman, A. Aserin and N. Garti, Langmuir, 2011, 27, 4497 CrossRef CAS PubMed.
- D. J. Codling, G. Zheng, T. Stait-Gardner, S. Yang, M. Nilsson and W. S. Price, J. Phys. Chem. B, 2013, 117, 2734 CrossRef CAS PubMed.
- G. Pages, C. Delaurent and S. Caldarelli, Angew. Chem., Int. Ed., 2006, 45, 5950 CrossRef CAS PubMed.
- S. Viel, F. Ziarelli and S. Caldarelli, Proc. Natl. Acad. Sci. U. S. A., 2003, 100, 9696 CrossRef CAS PubMed.
- P. T. Callaghan, Principles of Nuclear Magnetic Resonance Microscopy, Oxford Science, Oxford, 1st edn, 1991, p. 516 Search PubMed.
- R. E. Hoffman, H. Arzuan, C. Pemberton, A. Aserin and N. Garti, J. Magn. Reson., 2008, 194, 295 CrossRef CAS PubMed.
- C. Pemberton, R. E. Hoffman, A. Aserin and N. Garti, J. Magn. Reson., 2011, 208, 262 CrossRef CAS PubMed.
- P. G. Pietta, J. Nat. Prod., 2000, 63, 1035 CrossRef CAS PubMed.
- W. S. Pierpoint, Flavonoids in the human diet, in Plant Flavonoids in Biology and Medicine: Biochemical, Pharmacological and Structure-Activity Relationships, ed. V. Cody, E. Middleton Jr and J. Harborne, New York, USA, 1986 Search PubMed.
- W. Templeton, An introduction to the chemistry of the terpenoids and steroids, Butterworths, London, 1969 Search PubMed.
- C. Seger, S. Sturm and H. Stuppner, Nat. Prod. Rep., 2013, 30, 970 RSC.
- M. E. N. P. Ribeiro, C. L. Moura, M. G. S. Vieira, N. V. Gramosa, C. Chaibundit, M. C. Mattos, D. Attwood, S. G. Yeates, S. K. Nixon and N. M. P. S. Ricardo, Int. J. Pharm., 2012, 436, 631 CrossRef CAS PubMed.
- Y. Kapoor, J. C. Thomas, G. Tan, V. T. John and A. Chauhan, Biomaterials, 2009, 30, 867 CrossRef CAS PubMed.
- M. Sowmiya, A. K. Tiwari and S. K. Saha, J. Colloid Interface Sci., 2010, 344, 97 CrossRef CAS PubMed.
- S. A. Markarian, L. R. Harutyunyan and R. S. Harutyunyan, J. Solution Chem., 2005, 34, 361 CrossRef CAS.
- M. S. Chauhan, G. Kumar, A. Kumar, K. Sharma and S. Chauhan, Colloids Surf., A, 2001, 180, 111 CrossRef CAS.
- C. Klammt, D. Schwartz, K. Fendler, W. Haase, V. Dotsch and F. Bernhard, FEBS J., 2005, 212, 6024 CrossRef PubMed.
- P. Becher, J. Phys. Chem., 1959, 63, 1675 CrossRef CAS.
- J. Armstrong, B. Chowdhy, J. Mitchell, A. Beezer and S. Lehame, J. Phys. Chem., 1996, 100, 1738 CrossRef CAS.
- C. Chaibundit, N. Ricardo, F. Costa, M. G. P. Wong, D. Hermida-Merino, J. Rodriguez Perez, I. W. Hamley, S. G. Yeates and C. Booth, Langmuir, 2008, 24, 12260 CrossRef CAS PubMed.
- B. Sarkar, V. Ravi and P. Alexandridis, J. Colloid Interface Sci., 2013, 390, 137 CrossRef CAS PubMed.
- L. A. Bernardez, Colloids Surf., A, 2008, 324, 71 CrossRef CAS PubMed.
- D. J. L. Prak, W. I. Jahraus, J. M. Sims and A. H. R. MacArthur, Colloids Surf., A, 2011, 375, 12 CrossRef PubMed.
- Molinspiration Cheminformatics, Bratislava, Slovak Republic, available: http://www.molinspiration.com/services/properties.html Search PubMed.
- A. Botana, J. A. Aguilar, M. Nilsson and G. A. Morris, J. Magn. Reson., 2011, 208, 270 CrossRef CAS PubMed.
- G. A. Morris, H. Barjat and T. J. Horne, Prog. Nucl. Magn. Reson. Spectrosc., 1997, 31, 197 CrossRef CAS.
- M. Nilsson, J. Magn. Reson., 2009, 200, 296 CrossRef CAS PubMed.
- M. A. Connell, P. J. Bowyer, A. P. Bone, A. L. Davis, A. G. Swanson, M. Nilsson and G. A. Morris, J. Magn. Reson., 2009, 198, 121 CrossRef CAS PubMed.
Footnote |
| † Electronic supplementary information (ESI) available. See DOI: 10.1039/c4ra04433a |
| This journal is © The Royal Society of Chemistry 2014 |