Impact of serum proteins on MRI contrast agents: cellular binding and T2 relaxation

Alexandra Hill and Christine K. Payne*
School of Chemistry and Biochemistry and Petit Institute for Bioengineering and Bioscience, Georgia Institute of Technology, 901 Atlantic Drive, Atlanta, Georgia, USA. E-mail: christine.payne@chemistry.gatech.edu

Received 7th May 2014 , Accepted 3rd July 2014

First published on 4th July 2014


Abstract

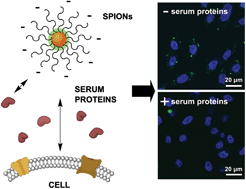
Superparamagnetic iron oxide nanoparticles (SPIONs) used as MRI contrast agents or for theranostic applications encounter a complex mixture of extracellular proteins that adsorb on the SPION surface forming a protein corona. Our goal was to understand how cellular binding and T2 relaxation times are affected by this protein corona. Our studies focused on carboxymethyl dextran-modified SPIONs, chosen for their similarity to Resovist SPIONs used to detect liver lesions. Using a combination of fluorescence microscopy and flow cytometry, we find that the cellular binding of SPIONs to both macrophages and epithelial cells is significantly inhibited by serum proteins. To determine if this decreased binding is due to the iron oxide core or the carboxymethyl dextran surface coating, we functionalized polystyrene nanoparticles with a similar carboxymethyl dextran coating. We find a comparable decrease in cellular binding for the carboxymethyl dextran–polystyrene nanoparticles indicating that the carbohydrate surface modification is the key factor in SPION–cell interactions. NMR measurements showed that T2 relaxation times are not affected by corona formation. These results indicate that SPIONs have a decreased binding to cells under physiological conditions, possibly limiting their use in theranostic applications. We expect these results will be useful in the design of SPIONs for future diagnostic and therapeutic applications.

1 Introduction

Superparamagnetic iron oxide nanoparticles (SPIONs) are composed of an iron oxide core of magnetite or maghemite typically surrounded by a stabilizing shell of a dextran derivative, polyvinyl alcohol, or poly(ethyleneglycol) (PEG).1–11 Since the introduction of SPIONs as magnetic resonance imaging (MRI) contrast agents for in vivo application ∼30 years ago,12,13 a variety of these nanoparticles have been approved for human use for liver imaging (Feridex, Resovist), gastrointestinal bowel imaging (GastroMARK), and the treatment of iron deficiency anemia (Feraheme).14,15 The increased T2 relaxivity that results from the interaction of water molecules with the magnetic field of the SPIONs leads to a dark contrast in T2-weighted MRI images.1,10,11,16 Additionally, the ability to functionalize SPIONs with drugs has generated a great deal of interest in their use as theranostic agents.17–22 For example, doxorubicin-loaded SPIONs were found to serve simultaneously as MRI contrast agents and drug delivery vehicles in vitro23,24 and in vivo,25,26 providing antitumor efficacy and diagnostic capability. For both diagnostic and therapeutic applications, it is important to understand the molecular mechanism by which these nanoparticles interact with cells.

With the exception of gastrointestinal imaging, SPIONs are delivered via injection into the bloodstream, exposing them to the complex mixture of serum proteins. It is now well-established that extracellular serum proteins will adsorb on the surface of nanoparticles forming a protein layer, or corona.27–30 This protein corona dictates nanoparticle stability,31–33 cellular binding,34–36 and cellular internalization.37–42 The use of a neutral polymer such as PEG can reduce, but not prevent corona formation.43–45 Corona formation applies to nanoparticles of all compositions.35,46,47 In the case of SPIONs, corona formation has been observed for a range of different surface modifications including carboxy- and amino-dextran,48 polyvinyl alcohol derivatives,49 citrate,50 and poly(acrylic acid).47,50 Amiri and coworkers found that the formation of a protein corona was most pronounced on negatively charged carboxy-dextran-functionalized SPIONs, followed by neutral dextran-coated SPIONs and positively charged amino-dextran-functionalized SPIONs.48 In studies using polyvinyl alcohol-functionalized SPIONs, the greatest amount of protein was found on SPIONs functionalized with neutral and positively charged polyvinyl alcohol groups after 1 h incubation in fetal bovine serum.49 A 16 h incubation revealed increased protein adsorption for the negatively charged polyvinyl alcohol-functionalized SPIONs. Safi and coworkers reported the formation of a protein corona on citrate-modified SPIONs, but not on poly(acrylic acid)-modified SPIONs.50 However, a protein corona has been observed for poly(acrylic acid)-modified SPIONs under different laboratory conditions.47 Irrespective of the charge of the SPIONs, serum albumin, α2-macroglobulin, and transferrin were found to be the major components of the corona.49 A corona formed from bovine serum albumin (BSA) has even been used to stabilize bare Fe3O4 SPIONs for intracellular delivery.51 It is known that SPIONs are internalized into cells by ATP-dependent endocytosis in a diameter-dependent manner.50–55 Corona formation, or the presence of serum proteins, can alter this cellular uptake. For example, incubation of vinyl alcohol/vinyl amine copolymer-modified SPIONs with fetal calf serum decreased internalization into human cervical cancer cells (HeLa).56 Similarly, a reduced uptake of BSA-coated SPIONs into various cell types in the presence of fetal bovine serum has also been observed.51 Additionally, corona formation can affect T2 relaxation times by altering the ability of water molecules to diffuse to the iron oxide core.48 Lacking from previous research is a combined study of corona formation, cellular outcomes, and T2 relaxation for a single type of SPION with controlled corona formation.

There are two properties of SPIONs that could be affected by the formation of a protein corona; cellular binding and MRI contrast efficacy. Our goal was to determine how carboxymethyl dextran-modified SPIONs interact with cells in the presence of serum proteins isolated from whole blood and how these serum proteins affect T2 relaxation times. SPIONs with a carboxymethyl dextran shell (Fig. 1) were chosen due to their similarity in surface chemistry to the EU-approved MRI contrast agent Resovist (Bayer Schering).57 The SPIONs used in our studies are ∼100 nm, similar to the 60 nm Resovist SPIONs. We first confirmed corona formation using a combination of SDS-PAGE, an o-phthalaldehyde (OPA) assay, and dynamic light scattering measurements. Cellular binding was investigated for both macrophage and epithelial cells using fluorescence microscopy and flow cytometry. The results revealed a decreased binding affinity to both cell types in the presence of serum proteins. To determine if this decreased binding was due to the carboxymethyl dextran shell or the iron oxide core, we repeated the experiments using polystyrene nanoparticles functionalized with a carboxymethyl dextran shell (CMD-PS NPs). Similar binding trends were obtained demonstrating that the carboxymethyl dextran shell mediates the cellular interaction. We measured T2 relaxation times to determine the effect of the protein corona on the use of SPIONs as MRI contrast agents. These experiments showed that the relaxivity of SPIONs was not significantly influenced by the protein corona. Taken together, the experiments show that SPIONs still function as MRI contrast agents following exposure to serum proteins in a physiological environment. However, cellular binding is significantly inhibited, which may limit their use for cellular imaging applications.


image file: c4ra04246h-f1.tif
Fig. 1 Schematic of carboxymethyl dextran-modified SPIONs. The inset shows the chemical structure of carboxymethyl dextran.

2 Experimental

2.1. Nanoparticles

Fluorescent (Excite: 476 nm, Emit: 490 nm) SPIONs functionalized with carboxymethyl dextran (nano-screenMAG-CMX, #4406) were obtained from Chemicell GmbH (Berlin, Germany). The hydrodynamic diameter and particle concentration provided by the supplier were 100 nm and 1.8 × 10¹⁵ nanoparticles per g solid mass, respectively.

To produce carboxymethyl dextran-functionalized polystyrene (CMD-PS) nanoparticles, 100 nm orange fluorescent (Excite: 480 nm, Emit: 533 nm) amine-modified latex nanoparticles (#L9904, H2N-PS NPs) from Sigma-Aldrich (Milwaukee, WI, USA) were functionalized with carboxymethyl dextran. The unmodified polystyrene nanoparticles were diluted to 800 μg mL−1 with MilliQ water and purified by dialysis overnight against 400 mL water. After adjustment to pH 5, nanoparticles were added 1[thin space (1/6-em)]:[thin space (1/6-em)]1 to a 16 mg mL−1 solution of carboxymethyl dextran (10–15 kDa, Sigma-Aldrich) and stirred overnight. The CMD-PS NPs were purified from excess carboxymethyl dextran by 4 cycles of 6 h dialysis against 4 L of MilliQ water and characterized with FTIR (Bruker ALPHA FT-IR spectrometer, Bruker, MA, USA).

2.2. SDS-PAGE

SPIONs (93 pM) were added to PBS supplemented with 10% fetal bovine serum (FBS) (Life Technologies). This mixture was incubated at 4 °C for 10 min and then washed by repeated centrifugation (10[thin space (1/6-em)]000 rcf, 10 min) and re-suspension in water (MilliQ). At each washing step, the supernatant was collected for SDS-PAGE (130 V, 1 h, 12% Mini-Protean TGX Stain-Free gels, BioRad Laboratories Inc., Hercules, CA, USA) analysis. This washing procedure was repeated to obtain supernatants from wash 1 to 3 (W1–W3). The protein corona that remains after the first wash (W1) is referred to as the soft corona. Proteins remaining after the third wash (W3) comprise the hard corona. To detach the proteins that were tightly bound to the SPION surface, 20 μL of Laemmli SDS sample buffer (Boston Bioproducts, Ashland, MA, USA) was added to the remaining pellet and sonicated for 10 min. As a control, 20 μL of water was added to an identical SPION pellet. The supernatants were diluted 2[thin space (1/6-em)]:[thin space (1/6-em)]1 with Laemmli buffer and boiled for 10 min before transferring 30 μL onto the gel. FBS and the supernatant from wash 1 were diluted an additional 1[thin space (1/6-em)]:[thin space (1/6-em)]100 before adding Laemmli buffer to avoid overloading the gel. Gels were stained with Simply Blue SafeStain (Life Technologies) and the Lonza ProSieve Unstained Protein Marker (5–225 kDa, VWR, Rockland, ME, USA) was used to estimate molecular weight. A Li-Cor Odyssey scanner was used to image the gels and Image Studio Software (700 nm channel, 169 μm pixel scan resolution, and 0.5 mm focus offset) was used for analysis.

2.3. OPA assay for protein detection

To confirm the presence of a hard corona of proteins adsorbed on the SPIONs, o-phthalaldehyde (OPA, Thermo Scientific Pierce Fluoraldehyde, Fisher Scientific) was used. The fluorescent signal was calibrated using a serial dilution of a BSA standard from 0.25 μg mL−1 to 50 μg mL−1. Samples were excited at 355 nm and emission was recorded at 460 nm with a SpectraMax M2 plate reader (Molecular Devices, Sunnyvale, CA, USA) after a 1[thin space (1/6-em)]:[thin space (1/6-em)]1 dilution of SPIONs with the OPA reagent. Possible fluorescence signal quenching by the SPIONs was tested by adding the same concentrations of SPIONs to the serial dilutions of the BSA standard. Measurements were done in triplicate.

2.4. Dynamic light scattering and zeta potential measurements

Nanoparticle diameter and effective surface charge in MilliQ water were measured using a Zetasizer Nano ZS (Malvern Instruments, Worcestershire, UK). For particle size determination, ten measurements of 10 s were carried out at a temperature of 25 °C. A refractive index of 2.4 for magnetite was used.56 For zeta potential measurements a minimum of 13 runs were carried out. Measurements were done in triplicate. The Smoluchowski approximation was used to convert the electrophoretic mobility to a zeta potential.

2.5. Cell culture

RAW 264.7 macrophage cells (ATCC TIB-71, Manassas, VA, USA) were cultured in Dulbecco's modified Eagle's medium with high glucose (DMEM, Sigma-Aldrich), supplemented with 10% FBS. Chinese hamster ovary cells (CHO-K1, ATCC CCL61) were cultured in Ham's F12 medium with 10% FBS (Life Technologies). All cells were grown at 37 °C under a 5% CO2 atmosphere and passaged every two to three days.

2.6. Confocal fluorescence microscopy imaging of SPION–cell interactions

Cells were cultured in 4-well chambers (Nunc Lab-Tek II, Fisher Scientific, Pittsburgh, PA, USA). Prior to imaging, the medium was removed and the cells were washed with PBS. For experiments, the cells were incubated either in PBS or in PBS supplemented with 10% FBS for 10 min at 4 °C. SPIONs were added to the cells in concentrations ranging from 186 pM to 197 nM, as denoted in the figure legends, and incubated for 10 min at 4 °C. Afterwards, cells were washed three times with ice-cold PBS to remove unbound nanoparticles. Prior to imaging, nuclei were stained for 30 min with 27 μM 4′,6-diamidino-2-phenylindole dilactate (DAPI, Life Technologies). A Fluoview FV1000 confocal microscope with a 1.42 N.A., 60×, oil immersion objective (Olympus, Center Valley, PA, USA) was used for fluorescence imaging. DAPI and nanoparticle fluorescence was excited with the 405 nm and the 488 nm laser lines, respectively. Bandpass filters (BA 340–470 and BA 505–605) were used for emission. Voltages of PMTs were kept the same for all images. Image analysis was done with ImageJ (http://rsb.info.nih.gov/ij/), brightness and contrast were set equally for all images.

2.7. Flow cytometry analysis of SPION–cell interactions

Adherent CHO cells were removed from the cell culture flask using StemPro Accutase Cell Dissociation Reagent (Life Technologies). RAW 264.7 cells were detached from the flask using a cell scraper (Life Technologies). Cell pellets were prepared by centrifugation at 5000 rcf for 6 min and re-suspended in their respective media. Nanoparticles (SPIONs or CMD-PS NPs) were added as described in Results and Discussion. Cells were filtered through a 40 μm nylon cell strainer (Becton Dickinson, Franklin Lakes, NJ, USA). Flow cytometry was carried out on a BD LSR II flow cytometer (Becton Dickinson). SPIONs and CMD-PS NPs were excited with a 488 nm laser and fluorescence emission recorded with a 530/30 bandpass filter. The fluorescence of >15[thin space (1/6-em)]000 cells was recorded and the mean fluorescence intensities calculated (n = 4). Weasel 3.0.1 (Walter and Eliza Hall Institute of Medical Research, Victoria, Australia) was used for analysis.

2.8. T2 relaxation time measurements of SPIONs and protein–SPION complexes

T2 relaxation times were compared for bare SPIONs and SPIONs with a soft corona. Transverse magnetization Mxy was recorded with a Maran Ultra 23 MHz, 0.5 T benchtop NMR (Oxford Instruments, Abingdon, Oxfordshire, UK) at a temperature of 37 °C. A CPMG spin sequence with an interpulse time of τ = 25 μs was used (number of echoes: 3000, number of scans: 16). Samples were measured in triplicate. Calculated T2 relaxation times were plotted inversely against SPION concentration to determine the relaxivity from the slope of the linear fit. To account for the loss of SPIONs during the washing process, the exact SPIONs–protein complex concentration was determined via UV-Vis spectroscopy (Fig. S1).

3 Results and discussion

3.1. Characterization of the protein corona formed on SPIONs

SPIONs (93 pM) were incubated in PBS supplemented with 10% FBS for 10 min at 4 °C to allow the formation of a protein corona. Protein coronas have previously been characterized as “soft” or “hard,” corresponding to the adsorption of low affinity and high affinity proteins, respectively.28,58–60 A washing process consisting of repeated centrifugation (10[thin space (1/6-em)]000 rcf, 10 min, 4 °C) and resuspension in water was used to isolate SPIONs with a soft and hard corona (Fig. 2A). We refer to the weakly adsorbed proteins present following the first wash step as the soft corona. SDS-PAGE analysis of the supernatants, which contain both the soft corona and unbound proteins, showed a protein band with a molecular weight of ∼67 kDa, corresponding to bovine serum albumin (BSA),61 the most abundant protein in FBS.62 BSA has been detected previously in the corona of SPIONs,47,49 as well as other nanoparticles.34,35,58,59,63 High contrast imaging revealed faint protein bands at ∼75 kD and ∼170 kD corresponding to transferrin and α2-macroglobulin subunits, respectively.64,65 These assignments were confirmed by proteomics analysis of the corresponding bands in FBS (data not shown). After three wash steps, no proteins were visible in the supernatant indicating the removal of low affinity proteins from the SPION surface. Adding SDS to these washed SPIONs removed the hard corona proteins from the SPION surface (SPIONs + SDS).34 A control using water in place of SDS (SPIONs + H2O) showed that the detergent is necessary to solubilize the tightly adsorbed hard corona proteins. Increasing the brightness and contrast of the gel image reveals bands at ∼67 kDa, ∼100 kDa, and ∼150 kDa (Fig. 2A, inset). The protein at 67 kDa is BSA, based on molecular weight and previous nanoparticle corona studies.34,35,47,49,58,59,61,63 The other two bands were not identified. Despite efforts to increase SPION and protein concentrations for proteomics analysis, we were unable to obtain a sufficient concentration of hard corona proteins. A band at 150 kDa has also been observed in SDS-PAGE analysis of pure BSA (data not shown), suggesting that it may be a BSA product.
image file: c4ra04246h-f2.tif
Fig. 2 Serum proteins adsorb on the surface of SPIONs. (A) SPIONs (93 pM) were incubated in PBS supplemented with 10% FBS for 10 min at 4 °C. A washing process consisting of repeated centrifugation and resuspension in water was used to remove excess FBS. SDS-PAGE of proteins obtained from supernatants after washes 1–3 (W1 to W3, W1 was diluted 1[thin space (1/6-em)]:[thin space (1/6-em)]100). After two wash steps, no protein was detected in the supernatant. The addition of SDS (SPIONs + SDS) removes the adsorbed protein from the SPIONs. The addition of water in place of SDS does not remove protein from the SPION surface (SPIONs + H2O). FBS was run for comparison. The adsorbed proteins remaining after one wash step are referred to as the soft corona. After three wash steps the hard corona remains. Molecular weight marker (MW) shows 5, 10, 15, 25, 35, 50, 75, 100, 150 and 225 kDa. Bands at 5, 10 and 15 kDa are merged at the bottom. Inset shows a higher contrast view of the SPIONs + SDS. (B) An OPA assay to detect primary amines confirms the presence of a hard corona. (C) Hydrodynamic diameter (bars) and polydispersity index (squares) of the SPIONs (186 pM) measured with dynamic light scattering. (D) The effective surface charge of the SPIONs (186 pM) was determined by zeta potential measurement. Error bars show standard deviation (n = 3).

The low concentration of proteins on the gel following incubation of SPIONs with SDS (SPIONs + SDS) could be attributed to either a small number of proteins forming the hard corona or loss of SPIONs from the sample after three wash steps. The loss of SPIONs between wash 2 and wash 3 was quantified using UV-Vis spectroscopy (Fig. S1, ESI), which showed a 27% loss of SPIONs. To confirm the presence of hard corona proteins after 3 wash steps, SPIONs were incubated with o-phthalaldehyde (OPA), a fluorogenic reagent used to measure the presence of primary amines (Fig. 2B).66,67 In the absence of FBS, bare SPIONs showed a relative protein concentration of 1.00 ± 0.08. In comparison, SPIONs incubated with FBS and washed three times had a signal of 28.37 ± 9.97, 28-fold greater than the bare SPIONs, confirming the presence of adsorbed hard corona proteins. UV-Vis was used to establish equal concentrations of bare and hard corona–SPIONs for subsequent analysis (Fig. S1).

Hydrodynamic diameter and zeta potential measurements were used to further characterize the protein–SPIONs complexes (Fig. 2C and D). Compared to bare SPIONs, SPIONs incubated with FBS showed an increase in hydrodynamic diameter from 116 nm ± 2 nm to 158 nm ± 8 nm after one wash, providing additional evidence of a protein corona (Fig. 2C). Further washing of SPIONs to obtain hard corona–SPION complexes resulted in protein–SPION complexes with a diameter of 158 nm ± 2 nm. The polydispersity indices of bare SPIONs and protein–SPION complexes remained between 0.073 and 0.099, indicating that the SPIONs did not aggregate. Hydrodynamic diameter measurements of SPIONs in various biological media showed that SPIONs were stable in PBS lacking Ca2+ and Mg2+, but not in media containing bivalent cations such as Ca2+ and Mg2+ (Fig. S2 and Table S1). In FBS-supplemented media, SPIONs were stable in the presence of bivalent cations, likely due to the stabilization provided by the adsorbed proteins (Table S1). To allow for a comparison of SPIONs in the presence and absence of protein, PBS lacking Ca2+ and Mg2+ was used for all experiments. Zeta potential measurements were used to determine the effective surface charge of bare SPIONs compared to SPIONs with a soft and hard corona (Fig. 2D). The effective surface charge of bare SPIONs decreased from −14.0 mV ± 3.0 mV to −28.0 mV ± 0.4 mV following the formation of a soft corona, indicating the adsorption of negatively charged proteins. The hard corona–SPIONs had an effective surface charge of −11.5 mV ± 2.3 mV, similar to that of the bare SPIONs, in agreement with the low concentration of proteins that form the hard corona (Fig. 2A). Similar results for SPION diameter and zeta potential were obtained when isolated BSA, rather than FBS, was used to form a soft corona (Fig. S3).

3.2. Cellular binding of SPIONs in the presence of a protein corona

To determine if the protein corona that forms on SPIONs affects their interaction with cells, fluorescence microscopy and flow cytometry were used to measure the cellular binding of SPIONs in the presence of FBS (Fig. 3). Experiments were carried out at 4 °C to allow binding to the cell surface, but block internalization.68–70 Fluorescence microscopy shows SPIONs (186 pM) binding to RAW 264.7 macrophages incubated in PBS (Fig. 3A). The addition of 10% FBS inhibits cellular binding (Fig. 3A). This decrease in SPION binding in the presence of FBS was quantified using flow cytometry (Fig. 3B). Three concentrations of SPIONs (93–372 pM) were incubated with cells at 4 °C in the absence or presence of 10% FBS. While overall binding increases with higher concentrations of SPIONs, binding is inhibited by the presence of FBS, and associated soft corona formation, at all concentrations. Similar results were obtained for epithelial CHO cells (Fig. 3C and D) and at higher SPION concentrations (971 pM and 194 nM, Fig. S4). The decreased binding of SPIONs in the presence of FBS is in agreement with previous work from our lab showing decreased nanoparticle binding in the presence of FBS for anionic polystyrene nanoparticles, colloidal gold nanoparticles, and semiconductor quantum dots.34,35
image file: c4ra04246h-f3.tif
Fig. 3 Cellular binding of SPIONs is inhibited by serum proteins. (A) Confocal fluorescence microscopy images of SPIONs (green, 186 pM) bound to RAW 264.7 cells. The addition of 10% FBS inhibits binding. Nuclei are stained with DAPI (blue). (B) Flow cytometry was used to quantify cellular binding of SPIONs to RAW 264.7 cells in the presence (gray) and absence (white) of FBS. The control shows cells in the absence of SPIONs. Error bars show standard deviation (n = 4). (C) Confocal fluorescence microscopy image of SPIONs (green, 186 pM) bound to CHO cells. Nuclei are stained with DAPI (blue). (D) Flow cytometry of SPIONs bound to CHO cells. Error bars show standard deviation (n = 4).

3.3. Analysis of cell surface receptors used by protein–SPION complexes

To determine why corona formation inhibits the cellular binding of SPIONs, we compared the cellular binding of bare SPIONs, soft corona–SPIONs, hard corona–SPIONs, and BSA–SPIONs (soft corona) to CHO cells using flow cytometry. These experiments used isolated SPIONs (186 pM) in PBS instead of SPIONs in the presence of excess FBS. A soft corona formed from FBS, with minimal free proteins present, led to a decrease to 70% ± 4% binding to CHO cells, compared to the bare SPIONs which were normalized to 100% (Fig. 4A). This suggests that the corona proteins inhibit the cellular binding of the protein–SPION complex. Hard corona–SPIONs also showed a decrease in cellular binding to 60% ± 2% compared to bare SPIONs. As BSA was the main protein detected with SDS-PAGE (Fig. 2) and the most abundant protein in FBS,62 we compared the cellular binding of BSA–SPIONs with a corona consisting of only BSA. Interestingly, BSA–SPIONs had a slightly increased binding (119% ± 2%) to the surface of CHO cells. This indicates that BSA is not responsible for the decreased cellular binding of protein–SPION complexes. Instead, it is likely that a lower abundance protein(s) present in FBS is responsible for the observed trends in cellular binding. It is possible that the increased binding of BSA–SPIONs is due to the presence of only BSA, allowing the BSA–SPIONs to bind to albumin receptors,35 without inhibition from the lower abundance protein(s).
image file: c4ra04246h-f4.tif
Fig. 4 Competition of SPIONs with the mixture of FBS proteins and isolated BSA for binding to CHO cells was quantified with flow cytometry. (A) The formation of a FBS corona on the SPION inhibits binding to CHO cells. In comparison, a corona formed using isolated BSA (3.5 mg mL−1) does not inhibit cellular binding. For all measurements, error bars show standard deviation (n = 4). * Indicates p values <0.05, n.s. indicates not significant. (B) Cellular binding of bare SPIONs to CHO cells in the presence of increasing concentrations of FBS. (C) Binding of SPIONs to CHO cells in the presence of increasing concentrations of BSA. No significant differences as a function of BSA concentration were observed. A BSA range of 2–4 mg mL−1 is equivalent to the concentration of BSA found in 10% FBS,71 in agreement with values previously determined in our lab.35

The addition of excess proteins makes this difference in binding more pronounced. Increasing concentrations of FBS (0–10%) lead to decreased binding of the soft corona–SPION complexes (Fig. 4B). The amount of binding plateaus at 5% FBS with 37% ± 1% binding normalized against 100% ± 6% binding for the bare SPIONs. This decrease observed with free FBS is greater than that observed with isolated soft corona– or hard corona–SPIONs, 70% ± 4% and 60% ± 2%, respectively, suggesting that competition with free proteins present in FBS leads to the greater decrease in cellular binding. These results are in good agreement with previous studies showing that free serum proteins led to decreased cellular uptake of BSA–SPIONs across multiple cells lines (fibroblast, placenta, cervix, breast, and liver cells).51 In comparison, increasing concentrations of excess BSA (0–4 mg mL−1) do not affect the cellular binding of BSA–SPIONs (186 pM) (Fig. 4C). BSA concentrations of 2–4 mg mL−1 are similar to the levels found in 10% FBS.35,71 Taken together, these results show that a low abundance protein(s) present in FBS adsorbs on SPIONs leading to decreased cellular binding. The unidentified protein is not visible with SDS-PAGE, despite a 200-fold scale up of SPIONs for analysis (data not shown). Although we were unable to detect a competitor protein with gel electrophoresis, we tested a broad set of competitor proteins and cellular receptors that had been identified in previous protein corona and nanoparticle studies;34,49,72–74 scavenger receptors, transferrin receptors, and IgG receptors. In each case, negative results were obtained (Fig. S5).

3.4. Binding of CMD-PS NPs to cells

The cellular binding results show that a low abundance protein, rather than BSA, dominates the cellular binding of protein–SPION complexes. This observation is in contrast to our previous experiments with anionic polystyrene nanoparticles, colloidal gold nanoparticles, and quantum dots, all of which competed with free BSA for cellular binding.35 To determine if this difference is due to the SPION composition, iron oxide, or surface modification, carboxymethyl dextran, we modified the surface of polystyrene nanoparticles with carboxymethyl dextran (CMD-PS NPs, Fig. S6). These nanoparticles were similar in diameter and surface charge to the SPIONs (Table 1). We then repeated the cellular binding experiments using CMD-PS NPs (60 pM) in place of the SPIONs (Fig. 5). As with the SPIONs, FBS, but not BSA, inhibited binding to CHO cells. Flow cytometry showed a 72% ± 3% decrease of CMD-PS NPs binding to cells in the presence of 10% of FBS, comparable to the 63% decrease obtained with the SPIONs. Similar to SPIONs, BSA did not inhibit cellular binding. These results indicate that cellular binding of SPIONs is dominated by the carboxymethyl dextran coating rather than the iron oxide core.
Table 1 Hydrodynamic diameter, polydispersity index, and zeta potential of SPIONs and carboxymethyl-dextran modified polystyrene nanoparticles (CMD-PS NPs). Mean values are shown with standard deviation (n = 3)
Particle type Hydrodynamic diameter (nm) PDI Zeta potential (mV)
SPIONs 116 ± 2 0.099 ± 0.008 −14.0 ± 3.0
CMD-PS NPs 123 ± 7 0.101 ± 0.025 −23.7 ± 0.4


image file: c4ra04246h-f5.tif
Fig. 5 Flow cytometry was used to measure the cellular binding of CMD-PS NPs (60 pM) to CHO cells in the absence or presence of FBS (10%) and BSA (3.5 mg mL−1). The mean fluorescence intensity is normalized against the cellular binding of CMD-PS NPs in the absence of serum proteins. The control shows cellular autofluorescence in the absence of NPs. Error bars show standard deviation (n = 4).

3.5. Efficacy of protein–SPION complexes as MRI contrast agents

T2 relaxation time measurements were carried out on bare SPIONs and soft corona–SPIONs (Fig. 6). Bare SPIONs (93–619 pM) were incubated in PBS and the transverse magnetization Mxy was recorded (Fig. 6A). With increasing concentration of SPIONs, the T2 times of the protons were shorter, indicated by the steeper exponential decay of the signal. The decay rate is not only dependent on iron oxide concentration, but also on temperature, particle size, and coating of the iron oxide cores.8,9,75 To determine if the protein corona affected the T2 relaxation time, we carried out the same measurement using isolated soft corona–SPIONs (Fig. 6B).
image file: c4ra04246h-f6.tif
Fig. 6 T2 relaxation times of SPIONs in the presence and absence of a protein corona at 37 °C. (A) The transverse magnetization of bare SPIONs was measured for various concentrations of SPIONs (109–602 pM). (B) Transverse magnetization of SPIONs coated with a soft FBS corona (66–466 pM). SPION concentrations were determined with UV-Vis spectroscopy. The concentrations in (B) were slightly lower due to particle loss during preparation of coated SPIONs. (A) and (B) show representative data from measurements carried out in triplicate. (C) Transverse magnetization relaxation times of the bare (white circles) and protein-coated SPIONs (black squares) as a function of SPION concentration. Error bars show standard deviation (n = 3). Lines are linear fits to the data.

By plotting the inverse transverse relaxation times, T2, against SPION concentration, the transverse relaxivity (r2) can be calculated from the slope of the linear graph (Fig. 6C). The r2 value is a measurement of the efficacy of SPIONs to act as negative contrast agents. We found only a slight (12%) increase of r2 following corona formation with r2 = 9.24 × 10⁻⁵ s−1 pM−1 and r2 = 8.23 × 10⁻⁵ s−1 pM−1 for soft corona–SPION complexes and bare SPIONs, respectively. Although SPION coatings can have a significant effect on T2 times,9,48,76,77 it appears that the protein corona that forms on these SPIONs does not affect the interaction of water molecules with the SPION core. This suggest that the carboxymethyl dextran surface modification dominates the T2 time. The addition of a corona is a relatively small perturbation in terms of the interaction of water molecules with the SPION core. Interestingly, while this lack of change in relaxivity has been observed previously for other anionic carboxyl-dextran modified SPIONs, it appears to be modification-specific as the relaxivity of cationic amine-dextran modified SPIONs was significantly decreased following corona formation.48

4 Conclusions

The formation of a protein corona can affect the diagnostic and therapeutic efficacy of SPIONs on two levels. The first is cellular binding, which would affect diagnostic and therapeutic applications that require SPIONs to bind or to enter cells. The second is the T2 relaxation time, which would affect the use of SPIONs as MRI contrast agents. Using fluorescence microscopy and flow cytometry, we find that the cellular binding of SPIONs to macrophages and epithelial cells is inhibited by a corona formed from serum proteins (Fig. 3 and 4). By functionalizing polystyrene nanoparticles with a similar carboxymethyl dextran coating and repeating experiments, we have determined that nanoparticle surface modification, rather than core composition, determines the nanoparticle–cell interaction in the presence of serum proteins (Fig. 5). Unexpectedly, we found that albumin, the highest abundance serum protein,62 did not compete with protein–SPION complexes for cellular binding sites (Fig. 4). This is in contrast to previous studies with other anionic nanoparticles, including polystyrene, colloidal gold, semiconductor quantum dots, and poly(methacrylic acid) nanoparticles.35,38 The cellular binding of CMD-modified polystyrene nanoparticles was also not inhibited by albumin (Fig. 5), suggesting that a unique cellular receptor is utilized by the CMD ligand. T2 relaxation times of SPIONs were not affected by the formation of a protein corona (Fig. 6). It is expected that these studies, probing the cellular binding and T2 relaxation times of SPIONs in the presences of serum proteins, will advance the design of SPIONs with improved diagnostic and therapeutic efficacy.

Acknowledgements

This research was supported by a NIH Director's New Innovator Award (1DP2OD006470) to C.K.P. The authors thank Dr Haskell W. Beckham for use of the NMR and Dr Johannes Leisen for his assistance with T2 relaxation time measurements.

Notes and references

  1. S. Laurent, D. Forge, M. Port, A. Roch, C. Robic, L. Vander Elst and R. N. Muller, Chem. Rev., 2008, 108, 2064–2110 CrossRef CAS.
  2. G. Liu, R. Y. Hong, L. Guo, Y. G. Li and H. Z. Li, Appl. Surf. Sci., 2011, 257, 6711–6717 CrossRef CAS.
  3. A. Petri-Fink, M. Chastellain, L. Juillerat-Jeanneret, A. Ferrari and H. Hofmann, Biomaterials, 2005, 26, 2685–2694 CrossRef CAS PubMed.
  4. C. Sun, J. S. H. Lee and M. Zhang, Adv. Drug Delivery Rev., 2008, 60, 1252–1265 CrossRef CAS PubMed.
  5. J. Y. Park, P. Daksha, G. H. Lee, S. Woo and Y. Chang, Nanotechnology, 2008, 19, 365603 CrossRef PubMed.
  6. D. L. Thorek, A. K. Chen, J. Czupryna and A. Tsourkas, Ann. Biomed. Eng., 2006, 34, 23–38 CrossRef PubMed.
  7. A. K. Gupta and M. Gupta, Biomaterials, 2005, 26, 3995–4021 CrossRef CAS PubMed.
  8. Y. X. Wang, S. M. Hussain and G. P. Krestin, Eur. Radiol., 2001, 11, 2319–2331 CrossRef CAS PubMed.
  9. S. Tong, S. J. Hou, Z. L. Zheng, J. Zhou and G. Bao, Nano Lett., 2010, 10, 4607–4613 CrossRef CAS PubMed.
  10. Q. A. Pankhurst, J. Connolly, S. K. Jones and J. Dobson, J. Phys. D: Appl. Phys., 2003, 36, R167–R181 CrossRef CAS.
  11. S. Mornet, S. Vasseur, F. Grasset and E. Duguet, J. Mater. Chem., 2004, 14, 2161–2175 RSC.
  12. M. H. M. Dias and P. C. Lauterbur, Magn. Reson. Med., 1986, 3, 328–330 CrossRef CAS.
  13. R. C. Semelka and T. K. G. Helmberger, Radiology, 2001, 218, 27–38 CrossRef CAS PubMed.
  14. C. Corot and D. Warlin, WIREs Nanomed. Nanobiotechnol., 2013, 5, 411–422 CAS.
  15. C. Corot, P. Robert, J. M. Idee and M. Port, Adv. Drug Delivery Rev., 2006, 58, 1471–1504 CrossRef CAS PubMed.
  16. M. G. Harisinghani, J. Barentsz, P. F. Hahn, W. M. Deserno, S. Tabatabaei, C. H. van de Kaa, J. de la Rosette and R. Weissleder, N. Engl. J. Med., 2003, 348, 2491–2499 CrossRef PubMed.
  17. O. Veiseh, J. W. Gunn and M. Zhang, Adv. Drug Delivery Rev., 2010, 62, 284–304 CrossRef CAS.
  18. J. Gautier, E. Allard-Vannier, E. Munnier, M. Souce and I. Chourpa, J. Controlled Release, 2013, 169, 48–61 CrossRef CAS PubMed.
  19. M. Arruebo, R. Fernandez-Pacheco, M. R. Ibarra and J. Santamaria, Nano Today, 2007, 2, 22–32 CrossRef.
  20. M. Mahmoudi, S. Sant, B. Wang, S. Laurent and T. Sen, Adv. Drug Delivery Rev., 2011, 63, 24–46 CrossRef CAS PubMed.
  21. T. Neuberger, B. Schöpf, H. Hofmann, M. Hofmann and B. von Rechenberg, J. Magn. Magn. Mater., 2005, 293, 483–496 CrossRef CAS.
  22. G. Bao, S. Mitragotri and S. Tong, Annu. Rev. Biomed. Eng., 2013, 15, 253–282 CrossRef CAS PubMed.
  23. C. Sanson, O. Diou, J. Thévenot, E. Ibarboure, A. Soum, A. Brûlet, S. Miraux, E. Thiaudière, S. Tan, A. Brisson, V. Dupuis, O. Sandre and S. Lecommandoux, ACS Nano, 2011, 5, 1122–1140 CrossRef CAS PubMed.
  24. T. K. Jain, M. A. Morales, S. K. Sahoo, D. L. Leslie-Pelecky and V. Labhasetwar, Mol. Pharm., 2005, 2, 194–205 CrossRef CAS PubMed.
  25. J. H. Maeng, D. H. Lee, K. H. Jung, Y. H. Bae, I. S. Park, S. Jeong, Y. S. Jeon, C. K. Shim, W. Kim, J. Kim, J. Lee, Y. M. Lee, J. H. Kim, W. H. Kim and S. S. Hong, Biomaterials, 2010, 31, 4995–5006 CrossRef CAS PubMed.
  26. M. K. Yu, Y. Y. Jeong, J. Park, S. Park, J. W. Kim, J. J. Min, K. Kim and S. Jon, Angew. Chem., Int. Ed., 2008, 47, 5362–5365 CrossRef CAS PubMed.
  27. P. Aggarwal, J. B. Hall, C. B. McLeland, M. A. Dobrovolskaia and S. E. McNeil, Adv. Drug Delivery Rev., 2009, 61, 428–437 CrossRef CAS PubMed.
  28. M. Lundqvist, J. Stigler, G. Elia, I. Lynch, T. Cedervall and K. A. Dawson, Proc. Natl. Acad. Sci. U. S. A., 2008, 105, 14265–14270 CrossRef CAS PubMed.
  29. D. Walczyk, F. B. Bombelli, M. P. Monopoli, I. Lynch and K. A. Dawson, J. Am. Chem. Soc., 2010, 132, 5761–5768 CrossRef CAS PubMed.
  30. L. Treuel and G. Nienhaus, Biophys. Rev., 2012, 4, 137–147 CrossRef CAS.
  31. J. S. Gebauer, M. Malissek, S. Simon, S. K. Knauer, M. Maskos, R. H. Stauber, W. Peukert and L. Treuel, Langmuir, 2012, 28, 9673–9679 CrossRef CAS PubMed.
  32. Z. Ji, X. Jin, S. George, T. Xia, H. Meng, X. Wang, E. Suarez, H. Zhang, E. M. Hoek, H. Godwin, A. E. Nel and J. I. Zink, Environ. Sci. Technol., 2010, 44, 7309–7314 CrossRef CAS PubMed.
  33. S. Dominguez-Medina, S. McDonough, P. Swanglap, C. F. Landes and S. Link, Langmuir, 2012, 28, 9131–9139 CrossRef CAS PubMed.
  34. C. C. Fleischer and C. K. Payne, J. Phys. Chem. B, 2012, 116, 8901–8907 CrossRef CAS.
  35. C. C. Fleischer, U. Kumar and C. K. Payne, Biomater. Sci., 2013, 1, 975–982 RSC.
  36. G. W. Doorley and C. K. Payne, Chem. Commun., 2011, 47, 466–468 RSC.
  37. X. Jiang, S. Weise, M. Hafner, C. Röcker, F. Zhang, W. J. Parak and G. U. Nienhaus, J. R. Soc., Interface, 2010, 7, S5–S13 CrossRef CAS PubMed.
  38. Y. Yan, K. T. Gause, M. M. Kamphuis, C. S. Ang, N. M. O'Brien-Simpson, J. C. Lenzo, E. C. Reynolds, E. C. Nice and F. Caruso, ACS Nano, 2013, 7, 10960–10970 CrossRef CAS PubMed.
  39. Y. Zhu, W. X. Li, Q. N. Li, Y. G. Li, Y. F. Li, X. Y. Zhang and Q. Huang, Carbon, 2009, 47, 1351–1358 CrossRef CAS.
  40. D. Guarnieri, A. Guaccio, S. Fusco and P. A. Netti, J. Nanopart. Res., 2011, 13, 4295–4309 CrossRef CAS.
  41. G. W. Doorley and C. K. Payne, Chem. Commun., 2012, 48, 2961–2963 RSC.
  42. A. Lesniak, F. Fenaroli, M. R. Monopoli, C. Aberg, K. A. Dawson and A. Salvati, ACS Nano, 2012, 6, 5845–5857 CrossRef CAS PubMed.
  43. R. Gref, M. Lück, P. Quellec, M. Marchand, E. Dellacherie, S. Harnisch, T. Blunk and R. H. Muller, Colloids Surf., B, 2000, 18, 301–313 CrossRef CAS PubMed.
  44. C. D. Walkey and W. C. Chan, Chem. Soc. Rev., 2012, 41, 2780–2799 RSC.
  45. S. P. Boulos, T. A. Davis, J. A. Yang, S. E. Lohse, A. M. Alkilany, L. A. Holland and C. J. Murphy, Langmuir, 2013, 29, 14984–14996 CrossRef CAS PubMed.
  46. J. Sund, H. Alenius, M. Vippola, K. Savolainen and A. Puustinen, ACS Nano, 2011, 5, 4300–4309 CrossRef CAS PubMed.
  47. A. Jedlovszky-Hajdu, F. B. Bombelli, M. P. Monopoli, E. Tombacz and K. A. Dawson, Langmuir, 2012, 28, 14983–14991 CrossRef CAS PubMed.
  48. H. Amiri, L. Bordonali, A. Lascialfari, S. Wan, M. P. Monopoli, I. Lynch, S. Laurent and M. Mahmoudi, Nanoscale, 2013, 5, 8656–8665 RSC.
  49. V. Hirsch, C. Kinnear, M. Moniatte, B. Rothen-Rutishauser, M. J. Clift and A. Fink, Nanoscale, 2013, 5, 3723–3732 RSC.
  50. M. Safi, J. Courtois, M. Seigneuret, H. Conjeaud and J. F. Berret, Biomaterials, 2011, 32, 9353–9363 CrossRef CAS PubMed.
  51. A. Bajaj, B. Samanta, H. H. Yan, D. J. Jerry and V. M. Rotello, J. Mater. Chem., 2009, 19, 6328–6331 RSC.
  52. D. L. Thorek and A. Tsourkas, Biomaterials, 2008, 29, 3583–3590 CrossRef CAS PubMed.
  53. T. Osaka, T. Nakanishi, S. Shanmugam, S. Takahama and H. Zhang, Colloids Surf., B, 2009, 71, 325–330 CrossRef CAS PubMed.
  54. A. K. Gupta and M. Gupta, Biomaterials, 2005, 26, 1565–1573 CrossRef CAS PubMed.
  55. C. Wilhelm, C. Billotey, J. Roger, J. N. Pons, J. C. Bacri and F. Gazeau, Biomaterials, 2003, 24, 1001–1011 CrossRef CAS PubMed.
  56. A. Petri-Fink, B. Steitz, A. Finka, J. Salaklang and H. Hofmann, Eur. J. Pharm. Biopharm., 2008, 68, 129–137 CrossRef CAS PubMed.
  57. P. Reimer and T. Balzer, Eur. Radiol., 2003, 13, 1266–1276 Search PubMed.
  58. E. Casals, T. Pfaller, A. Duschl, G. J. Oostingh and V. Puntes, ACS Nano, 2010, 4, 3623–3632 CrossRef CAS PubMed.
  59. M. P. Monopoli, D. Walczyk, A. Campbell, G. Elia, I. Lynch, F. B. Bombelli and K. A. Dawson, J. Am. Chem. Soc., 2011, 133, 2525–2534 CrossRef CAS PubMed.
  60. M. P. Monopoli, C. Aberg, A. Salvati and K. A. Dawson, Nat. Nanotechnol., 2012, 7, 779–786 CrossRef CAS PubMed.
  61. M. Karas and F. Hillenkamp, Anal. Chem., 1988, 60, 2299–2301 CrossRef CAS PubMed.
  62. X. Zheng, H. Baker, W. S. Hancock, F. Fawaz, M. McCaman and E. Pungor Jr, Biotechnol. Prog., 2006, 22, 1294–1300 CrossRef CAS PubMed.
  63. S. Tenzer, D. Docter, J. Kuharev, A. Musyanovych, V. Fetz, R. Hecht, F. Schlenk, D. Fischer, K. Kiouptsi, C. Reinhardt, K. Landfester, H. Schild, M. Maskos, S. K. Knauer and R. H. Stauber, Nat. Nanotechnol., 2013, 8, 772–781 CrossRef CAS PubMed.
  64. A. S. Pitek, D. O'Connell, E. Mahon, M. P. Monopoli, F. Baldelli Bombelli and K. A. Dawson, PLoS Onee, 2012, 7, e40685 CAS.
  65. R. P. Swenson and J. B. Howard, J. Biol. Chem., 1979, 254, 4452–4456 CAS.
  66. Y. Chen and Y. Zhang, Anal. Bioanal. Chem., 2011, 399, 2503–2509 CrossRef CAS PubMed.
  67. D. M. Zhu, A. Saul, S. H. Huang, L. B. Martin, L. H. Miller and K. M. Rausch, Vaccine, 2009, 27, 6054–6059 CrossRef CAS PubMed.
  68. A. Lesniak, A. Salvati, M. J. Santos-Martinez, M. W. Radomski, K. A. Dawson and C. Aberg, J. Am. Chem. Soc., 2013, 135, 1438–1444 CrossRef CAS.
  69. G. Callaini, R. Dallai and M. G. Riparbelli, Exp. Cell Res., 1991, 194, 316–321 CrossRef CAS.
  70. C. Szymanski, H. Yi, J. Liu, E. Wright and C. Payne, in NanoBiotechnology Protocols, ed. S. J. Rosenthal and D. W. Wright, Humana Press, New York, 2nd edn, 2013, vol. 1026, ch. 2, pp. 21–33 Search PubMed.
  71. M. Guelden, S. Morchel, S. Tahan and H. Seibert, Toxicology, 2002, 175, 201–213 CrossRef.
  72. Y. Chao, P. P. Karmali and D. Simberg, Adv. Exp. Med. Biol., 2012, 733, 115–123 CrossRef CAS PubMed.
  73. P. C. Patel, D. A. Giljohann, W. L. Daniel, D. Zheng, A. E. Prigodich and C. A. Mirkin, Bioconjugate Chem., 2010, 21, 2250–2256 CrossRef CAS PubMed.
  74. M. Luck, B. R. Paulke, W. Schroder, T. Blunk and R. H. Muller, J. Biomed. Mater. Res., 1998, 39, 478–485 CrossRef CAS.
  75. J. Z. Wang, X. Y. Wang, Y. J. Song, J. Wang, C. L. Zhang, C. J. Chang, J. Yan, L. Qiu, M. M. Wu and Z. J. Guo, Chem. Sci., 2013, 4, 2605–2612 RSC.
  76. L. E. LaConte, N. Nitin, O. Zurkiya, D. Caruntu, C. J. O'Connor, X. Hu and G. Bao, J. Magn. Reson. Imaging, 2007, 26, 1634–1641 CrossRef PubMed.
  77. H. W. Duan, M. Kuang, X. X. Wang, Y. A. Wang, H. Mao and S. M. Nie, J. Phys. Chem. C, 2008, 112, 8127–8131 CAS.

Footnote

Electronic supplementary information (ESI) available: Additional supporting figures. See DOI: 10.1039/c4ra04246h

This journal is © The Royal Society of Chemistry 2014
Click here to see how this site uses Cookies. View our privacy policy here.