Hydrogen evolution inhibition with diethylenetriamine modification of activated carbon for a lead-acid battery

Bo Hong, Xiaoying Yu, Liangxing Jiang*, Haitao Xue, Fangyang Liu*, Jie Li and Yexiang Liu
School of Metallurgy and Environment, Central South University, Changsha, Hunan 410083, China. E-mail: lxjiang@csu.edu.cn; liufangyang@csu.edu.cn; Fax: +86 731 88830649; Tel: +86 731 88830649

Received 7th May 2014 , Accepted 23rd July 2014

First published on 23rd July 2014


Abstract

A novel idea to inhibit the hydrogen evolution in activated carbon (AC) application in a lead-acid battery has been presented in this paper. Nitrogen group-enriched AC (NAC, mainly exists as pyrrole N) was prepared. Electrochemical measurements demonstrate that the hydrogen evolution reaction (HER) is markedly inhibited as the HER impedance increases significantly. What's more, the specific capacitance value of NAC is 142.5% higher than AC since the working window is extended. The use of NAC, instead of AC in an UltraBattery, can inhibit hydrogen evolution, and improve the battery's charge acceptance and charge retention ability.

Conventional lead-acid batteries suffer from a progressive build-up of “hard” lead sulfate and are difficult to recharge under high-rate partial-state-of-charge (HRPSoC) conditions. To address this problem, more attention has been focused on improving the cycle ability of the Valve-Regulated Lead-Acid Battery (VRLA) under HRPSoC duty. Some researchers observed that carbon materials added to the negative plate of lead-acid battery could suppress the sulphation phenomenon efficiently, and these new batteries were named lead–carbon battery1–3 or UltraBattery.4–6 These recent discoveries have excited great interest among battery producers. However, under the cathodic working conditions of lead-acid battery (−0.86 to −1.36 V vs. Hg/Hg2SO4, 5 mol L−1 sulfuric acid), the activated carbon (AC) will perform low capacity and serious hydrogen evolution reaction (HER).5,6 As a result, more gas will evolve at the end of charge and cause the thermal runaway7 or even electrolyte dry-out of the battery. For the problem of HER, physical mixing or chemical depositing high HER overpotential metal impurities through occupying the reactive sites to inhibit the HER was opined to be an effective way,8 but the inhibitory effect of HER was unstable as dopants were difficult to disperse evenly.

Usually, HER can occur through two separate pathways, the Volumer–Tafel or the Volumer–Heyrovsky mechanism,9 both of which involve hydrogen intermediate adsorption and desorption on the electrode surface. “Volcano Plots”, demonstrated by Trasatti,10 Parsons11 and Nørskov,12 relates the exchange current density of the elements for the HER in acid to a calculated metal–hydrogen (M–H) bond strength derived by Krishtalik.13 Very generally, these volcano relations state that materials with too low or too high bond strength of M–H result in slow kinetics for HER–Pb or Al for example. Based on this principle, we considered that AC doped with heteroatoms (N, P, B, S) in the graphene ring must be a potential method for HER inhibition. Since the electronic properties of carbon materials were theoretically predicted to change by the presence of the heteroatoms due to their different electronegativity from carbon. Through controlling proper heterocyclic structure and content, AC with extreme (very low or very high) bond strength to hydrogen would be obtained, and then results in high hydrogen evolution resistance.

Activated carbon from Shanghai Kuraray Company was used as the original carbon material. Original AC (0.5 g) was slowly added into a mixture of 75 mL diethylenetriamine and 25 mL anhydrous ethyl alcohol. Followed by refluxing at 80 °C for 4 h, the diethylenetriamine-treated AC was filtered and washed thoroughly with deionized water. After being dried at 80 °C for 10 h, the product was obtained and named as Nitrided AC (NAC).

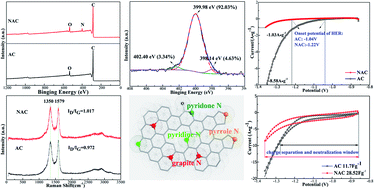
K-Alpha 1063 X-ray photoelectron spectrometer was performed for exploring the content and configuration of nitrogen doped AC. The full range XPS analysis (Fig. 1a, red curve) of NAC clearly shows the presence of nitrogen (N), carbon (C) and oxygen (O) with an atomic percentage of 87.35%, 4.99% and 7.66%, respectively. However, there is almost no nitrogen observed in the original AC. The XPS spectra of N1s core level were fitted into three peaks with the Shirley-type background and 30% of Lorentzian to Gaussian peak shape (Fig. 1b). The fitting of N1s peaks gives the following binding energies (BE): 398.14 eV for pyridine-N, 399.98 eV usually for pyrrole N, and 402.40 eV for nitrogen substituents in aromatic graphene structures (graphite N, as shown in Fig. 1d).14–16 Raman spectroscopy measurements were performed with a LabRAM HR800 Raman spectrometer. As shown in Fig. 1c, both ACs have similar Raman scattering patterns. The intensity ratios of ID/IG are 0.972 and 1.017 for original AC and NAC, respectively, which means a little more chemical and/or physical defects the NAC has.17 This is inevitable as the embedment of nitrogen heteroatoms in aromatic rings. Fig. 1e and f provides the SEM images of original AC and NAC. It can be seen that both samples are almost the same that mainly consist of large particles (2–10 μm) and plentiful small particles (less than 2 μm). Raman and SEM results prove that no serious structure damage of AC occurred in this modification process.


image file: c4ra04245j-f1.tif
Fig. 1 (a) XPS valence band spectra for NAC and original AC; (b) N1s XPS spectra for NAC; (c) Raman spectra for NAC and original AC; (d) schematic illustration of N-doped AC; (e) SEM images of original AC; (f) SEM images of NAC.

All electrochemical experiments were performed in a three-electrode system by a Princeton 2273 electrochemical working station. The mercury/mercurous sulphate reference electrode (Hg/HgSO4) was used as the reference electrode. The electrolyte was 5 mol L−1 sulfuric acid solution.

Linear Sweep Voltammetry (LSV) curves of both samples are presented in Fig. 2a. The hydrogen evolution current for NAC is −1.03 A g−1 under −1.36 V, which is only 12% of the original AC, indicating that the HER is significantly inhibited in NAC electrodes. Furthermore, the onset potential of hydrogen evolution is −1.22 V for NAC but −1.04 V for AC. When potential lower than these values, the hydrogen evolution current exponential increases with the potential negatively shifted. This means that during early stages of discharge in lead-acid battery, hydrogen evolution rather than discharge may occur on AC. Toward the end of charge, AC will also cause serious hydrogen evolution because its potential is shifted to a more negative value. It results that original AC cannot act as an efficient buffer during high-rate discharge and charge progress. However, NAC can overcome this defect effectively.


image file: c4ra04245j-f2.tif
Fig. 2 (a) LSV curves of AC and NAC (scan range: −0.86 V to −1.36 V; scan rate: 1.0 mV s−1) (b) CV curves of AC and NAC (scan range: −0.86 V to −1.36 V, scan rate: 10 mV s−1).

For the above reason, original AC often shows very low capacity and narrow charge and discharge potential window in 5 M H2SO4 solution under the cathodic working conditions of lead-acid battery in spite of the relatively high BET surface. As shown in Fig. 2b, NAC exhibits a better capacity performance with the specific capacitance value of 28.52 F g−1, which is 142.5% higher than that of original AC (11.76 F g−1), and its charge separation and neutralization window was extended to the whole potential region.

EIS spectra of AC and NAC were collected under various potentials. As shown in Fig. 3a and b, the spectra were mainly composed of one small arc in the high frequency region and one large capacitive arc in the low frequency region. The small capacitive arc was observed to be independent of potential and considered as a description of the resistive/capacitive behavior associated with the charge transfer processes. The large capacitive arc in the low frequency region, decreased exponentially with the decrease of applied potential, was related to the adsorption of intermediates.18


image file: c4ra04245j-f3.tif
Fig. 3 Nyquist spectra obtained on (a) AC and (b) NAC at various potentials. Electrolyte: 5 M H2SO4, temperature: 25 °C.

The equivalent electrical circuit (EEC) proposed by Armstrong and Henderson18,19 to model the impedance of HER is shown in the insert map of Fig. 3a. In which Rs is the sum of electrode resistance and solution resistance; Cdl is the double-layer capacitance, R1 denotes the charge transfer resistance; Ra and Ca are equivalent resistance and pseudo-capacitance associated with the adsorption of intermediates, respectively. Constant Phase Elements (Qa) were used to replace the capacitors (Ca) in the simulation.

Parameter values of EEC obtained by fitting the EIS experimental data of the investigated electrodes are given in Table 1. It was found that Ra is much higher than R1, which indicates that the rate-determining step of HER on AC surface is the adsorption step of intermediates. The Ra value of NAC is much higher than that of AC, which means that AC doped by nitrogen can increase the adsorption resistance of hydrogen and inhibit the hydrogen evolution. Accordingly, the Cdl of NAC is much lower than original AC. Due to the stronger electronegativity of nitrogen atom than that of carbon, nitrogen atoms doped in carbon matrix can attract the electrons of the neighboring or further carbon atoms, making them electron deficient. Thus, the adsorption of hydrogen atoms on NAC surface may be inhibited since it is likely to be stabilized through sharing a couple of electrons with carbon.

Table 1 Fit parameters for AC and NAC in 5 M H2SO4 under different potentials
  Potential (V) Rs (Ω) Qa (S secn) n Ra (Ω) Cdl (F cm−2) R1 (Ω)
AC −0.7 0.884 0.022 0.8045 234.2 2.8 × 10⁻³ 0.03
−0.9 0.837 0.026 0.797 134.8 1.4 × 10⁻³ 0.04
−1.1 0.847 0.020 0.785 15.6 8.5 × 10⁻⁴ 0.05
−1.36 0.886 0.012 0.803 1.2 7.7 × 10⁻⁴ 0.07
NAC −0.7 0.8702 0.0298 0.7344 727 1.3 × 10⁻⁴ 0.35
−0.9 0.8709 0.0294 0.7199 619 1.4 × 10⁻⁴ 0.39
−1.1 0.8786 0.0237 0.729 79.1 1.3 × 10⁻⁴ 0.38
−1.36 0.9194 0.016 0.7978 7.8 1.2 × 10⁻⁴ 0.34


In this paper, ACUB (UltraBattery with one Pb negative plate, one AC capacitive negative plate, and one PbO2 positive plate between them) and NACUB (the same structure with ACUB while the capacitive negative plate was changed to NAC) were assembled. All negative plates have a size of 4.0 cm × 6.8 cm (height × width) and geometric area of 27.2 cm2. The current distribution between the Pb negative plate and capacitor negative plate in a charge–discharge cycle were tested (as shown in Fig. 4), the regular lead-acid battery (LB) was used as the reference.


image file: c4ra04245j-f4.tif
Fig. 4 Current distribution in Pb and C negative plates of (a) ACUB and (b) NACUB in a charge–discharge cycle (electrolyte: 5 M H2SO4, temperature: 25 °C).

At charge steps, AC negative plate takes most of the charge current in ACUB despite its capacity is much lower than Pb negative plate. This is because that hydrogen evolution potential of AC is very low and HER wasted a large amount of energy. For this reason, the charging acceptance must decrease and the water loss will be exacerbated. Fortunately, this bad effect was inhibited obviously in NACUB. The NAC negative plate consumes little power and about 80% charging energy is accepted by Pb negative plate. This indicates that little charging energy is wasted and the decrease of charging acceptance is effectively relieved.

At standing step, AC negative plate is charged by Pb negative plate with an inner self-discharge current about 25–40 mA in the whole standing loop in ACUB. Besides, we can obviously observe the gas evolution from AC negative plate. This galvanic cell formed by Pb and AC plates inevitably do harm to the battery's charge retention ability. The inner self-discharge current is also observed in NACUB, but the value is significantly decreased to only 3 mA.

L. T. Lam5 noted that the capacitor would enhance the power and lifespan of the lead-acid battery as it acts as a buffer in discharging and charging. But this behavior may be restrained by the properties of AC. During early stages of discharge, the current mainly comes from the lead-acid negative plate and only little from the capacitor plate owing to its higher charge-neutralization potential. This inference is confirmed here, and it would be worse. In the ACUB, AC negative plate is not discharged rather charged by Pb negative plate during the early state of discharge. The AC negative plate only starts to discharge when the ACLB is brought to 60% SoC. Obviously, this is not the desirable condition. However, this problem is overcome by NAC and a large discharge current from capacitor electrode is observed at the beginning of discharge process. It indicates that NAC could act as a better buffer in discharging and charging process.

Conclusions

In this work, nitrogen groups-enriched activated carbon is prepared through diethylenetriamine modification. The nitrogen atoms added in the carbon material are mainly pyrrole N which are directly embedded in the graphene plane rings. Due to the stronger electronegativity of nitrogen atom than that of carbon, nitrogen atoms doped in carbon matrix can attract the electrons of the neighboring and/or further carbon atoms, making them electron deficient and then weakening the bond strength to hydrogen. For this reason, hydrogen adsorption step of HER is hindered and hydrogen evolution is great inhibited. In addition, the nitrogen groups-enriched activated carbon exhibits better capacity performance and its charge separation and neutralization window was extended to the whole potential region of lead-acid battery. The use of NAC in UltraBattery can dramatically decrease the hydrogen evolution current, improve battery's charge acceptance and charge retention ability. In sum, the nitrogen groups-enriched activated carbon will be a prospective active electrode material for lead-acid battery, UltraBattery and lead–carbon battery.

Acknowledgements

This research was supported by the National Science & Technology Pillar Program of China (no. 2012BAA03B04), the Chinese National Natural Science Foundation (no. 51204208), the China Postdoctoral Science Foundation (no. 2013M540638, no. 2014T70788) and the Fundamental Research Funds for the Central Universities of Central South University (no. CX2012B049).

Notes and references

  1. K. Nakamura, M. Shiomi, K. Takahashi and M. Tsubota, J. Power Sources, 1996, 59, 153 CrossRef CAS .
  2. M. Calábek, K. Micka, P. Křivák and P. Bača, J. Power Sources, 2006, 158, 864 CrossRef PubMed .
  3. D. Pavlov, T. Rogachev, P. Nikolov and G. Petkova, J. Power Sources, 2009, 191, 58 CrossRef CAS PubMed .
  4. L. T. Lam, R. Louey, N. P. Haigh, O. V. Lim, D. G. Vella, C. G. Phyland, L. H. Vu, J. Furukawa, T. Takada, D. Monma and T. Kano, J. Power Sources, 2007, 174, 16 CrossRef CAS PubMed .
  5. L. T. Lam and R. Louey, J. Power Sources, 2006, 158, 1140 CrossRef CAS PubMed .
  6. J. Furukawa, T. Takada, D. Monma and L. T. Lam, J. Power Sources, 2010, 195, 1241 CrossRef CAS PubMed .
  7. D. Pavlov, J. Power Sources, 1997, 64, 131 CrossRef CAS .
  8. Y. F. Gao, Y. L. Song, D. L. Ren and Y. P. Wang, J. Inorg. Mater., 2013, 28, 1301 CrossRef CAS .
  9. K. Mazloomi and C. Gomes, Renewable Sustainable Energy Rev., 2012, 16, 3024 CrossRef CAS PubMed .
  10. S. Trasatti, J. Electroanal. Chem., 1972, 39, 163 CrossRef CAS .
  11. R. Parsons, Trasactions of the Faraday Society, 1958, 54, 1053 CAS .
  12. J. K. Nørskov, J. Rossmeisl, A. Logadottir and L. Lindqvist, et al., J. Phys. Chem. B, 2004, 108, 17886 CrossRef .
  13. L. I. Krishtalik, Russ. J. Phys. Chem., 1960, 34, 53 Search PubMed .
  14. K. Jurewicz, K. Babeł, A. Źiółkowski and H. Wachowska, Electrochim. Acta, 2003, 48, 1491 CrossRef CAS .
  15. K. Y. Kang, B. I. Lee and J. S. Lee, Carbon, 2009, 47, 1171 CrossRef CAS PubMed .
  16. M. Sankaran and B. Viswanathan, Carbon, 2006, 44, 2816 CrossRef CAS PubMed .
  17. M. J. Matthews, M. A. Pimenta, G. Dresselhaus, M.S. Dresselhaus and M. Endo, Phys. Rev. B: Condens. Matter Mater. Phys., 1999, 59, 6585 CrossRef .
  18. R. D. Armstrong and M. Henderson, J. Electroanal. Chem., 1972, 39, 81 CrossRef CAS .
  19. A. Lasia and A. Rami, J. Electroanal. Chem., 1990, 294, 123 CrossRef CAS .

This journal is © The Royal Society of Chemistry 2014
Click here to see how this site uses Cookies. View our privacy policy here.