DOI:
10.1039/C4RA03905J
(Paper)
RSC Adv., 2014,
4, 31318-31322
Enhanced tumor targetability of PEGylated mesoporous silica nanoparticles on in vivo optical imaging according to their size†
Received
29th April 2014
, Accepted 30th June 2014
First published on 30th June 2014
Abstract
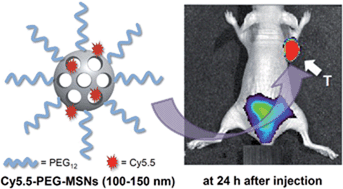
This paper reports the results of a particle size-dependent in vivo optical imaging study using mesoporous silica nanoparticles (MSNs) in a mouse xenografted U87MG (Human glioblastoma-astrocytoma) tumor model. Near-infrared (NIR) fluorescent dye (Cy5.5)-functionalized PEGylated MSNs (Cy5.5-PEG-MSNs) with three different particle sizes (≈30 nm, 100–150 nm and >300 nm) were fabricated. Among the three different particles sizes of the MSNs, the 100–150 nm-sized Cy5.5-PEG-MSNs provided the strongest fluorescence intensity in the tumor 24 h after injection with a low background signal from the normal tissues. In contrast, the ≈30 nm-sized Cy5.5-PEG-MSNs were washed out rapidly. The necropsy revealed the 100–150 nm-sized Cy5.5-PEG-MSNs to have approximately 4–6.5 fold higher uptake at the tumor site than the MSNs with other different sizes (≈30 or >300 nm in sizes). On the other hand, the larger (>300 nm)-sized MSNs were taken up mainly in the spleen and liver via the reticuloendothelial system (RES). Consequently, the 100–150 nm range is the optimal particle size for MSNs to maximize passive tumor targeting due to the enhanced permeability and retention (EPR) effect.
Introduction
A growing list of biomedical imaging agents, delivery vehicles and cancer therapeutics has been generated by advances in nanotechnology research.1,2 A wide range of nanoscale materials with high functionality, such as mesoporous silica nanoparticles (MSNs),3,4 liposomes,5,6 iron-oxide nanoparticles,7,8 carbon nanotubes9,10 etc., have been investigated for potential biomedical applications. Non-targeted nanoparticles generally accumulate within tumor lesions by passive targeting.11–13 The leakiness of the tumor vessels enables nanoparticles to accumulate within the tumor sites at a >50-fold higher rate than within healthy tissues. This is called as the enhanced permeability and retention (EPR) effect.13 The EPR effect is one of the most crucial effects for the passive targeting of nanoparticles. To maximize the performance of nanoparticles in EPR-targeted imaging or therapy, they should have a relatively long blood circulation time without non-specific binding to various cells or proteins in the body.14 Therefore, the size and surface characteristics of the nanoparticles are important issues for these purposes. In general, polyethylene glycosylation (PEGylation) of nanoparticles is used widely to obtain well mono-dispersed inorganic nanoparticles with high in vivo biocompatibility and long blood circulation lifetime.15 On the other hand, there is no single optimal particle size to maximize the EPR effect due to the different size-dependencies of the nanomaterial-properties, such as hard- or softness, shape, surface charge etc.13,15
In recent years, the unique and favorable features of mesoporous silica nanoparticles (MSNs), such as high-loading capacity from the large surface area and pore volume, low cytotoxicity, biocompatibility, biochemical stability, easy of surface modification, and multifunctionality, make them quite suitable for a broad spectrum of biomedical applications.16,17 For example, MSNs have been used extensively as drug and gene-delivery platforms18–20 and cell markers.21,22 MSNs are promising vehicles for contrast agents in a range of biomedical imaging modalities.23,24 More recently, Shi et al. reported the in vivo behavior of MSNs (such as biodistribution and excretion) according the particle size using normal ICR mice,25 and Lu et al. showed that MSNs with a size of 100–130 nm could accumulate into a human xenograft tumor in mice.26 In a previous report, similar sized-MSNs radiolabeled with fluorine-18 using a bioorthogonal pretargeting protocol could also visualize the tumors in mice successfully by positron emission tomography (PET).27 Therefore, given the importance of MSNs as vehicles in the biomedical area, an understanding their size effect in an in vivo system using tumor models with molecular imaging tools would be an interesting topic.
Among the many molecular imaging modalities available, noninvasive optical imaging is a versatile and readily accessible modality system for tracking and monitoring molecules in the body with potentially high specificity and sensitivity compared to other imaging modalities without the use of radiation.28,29 In this report, we introduce the in vivo optical imaging study using near-infrared (NIR) Cyanine 5.5 dye (Cy5.5)-functionalized PEGylated MSNs with three different particle size-ranges (≈30 nm, 100–150 nm and >300 nm) to determine the size range of MSNs that accumulated predominantly into the tumor site through passive targeting via the EPR effect in a mouse xenografted U87MG (Human glioblastoma-astrocytoma) tumor model.
Results and discussion
1. Synthesis of Cy5.5 conjugated PEGylated MSNs (Cy5.5-PEG-MSNs)
Fig. 1A presents a schematic diagram of the preparation of Cy5.5 labeled PEGylated MSNs (Cy5.5-PEG-MSNs). Size-controlled and amine-functionalized MSNs (NH2-MSNs) with different sizes, ≈30 nm, 100–150 nm and >300 nm, were prepared using a previously reported procedure.20,21 The PEGylated MSNs (PEG-MSNs) were obtained by treating the NH2-MSNs with a bulky chain-length N-hydroxylsuccinimide (NHS)-functionalized PEG (MeO-PEG12-NHS ester). NIR fluorophores, such as Cy5.5 exhibit high background binding to the normal tissues and organs.30 To produce Cy5.5-PEG-MSNs while avoiding their non-specific binding from the Cy5.5 moiety, Cy5.5 was introduced to the PEG-MSNs via a conjugation reaction of Cy5.5-NHS ester with the unreacted amine-groups on the MSN surface between the bulky PEG groups. The conjugation of Cy5.5 with PEG-MSNs was confirmed by both UV-VIS spectroscopy and optical imaging of Cy5.5-PEG-MSNs (Fig. 1E and F, respectively). Cy5.5-PEG-MSNs showed similar absorbance with Cy5.5 compound in UV-VIS spectra, and provided a strong near infrared fluorescent signal in optical imaging system.31 Transmission electron microscopy (TEM) showed that the Cy5.5-PEG-MSNs had been prepared successfully with three different particle sizes, approximately 30 nm, 100–150 nm and >300 nm (Fig. 1B–D, respectively), and the Cy5.5-PEG-MSNs were generally spherical in shape with hexagonal arrays of pores regardless of the particle size. All MSN derivatives were characterized by N2 adsorption–desorption and pore-size distribution analysis, X-ray powder diffraction (XRD), zeta potential and Fourier transform infrared (FT-IR) spectroscopy. The data suggested that all steps of the MSNs had been performed successfully (Fig. S1–S4 in ESI†).
 |
| Fig. 1 (A) Schematic diagram of the preparation of Cy5.5 conjugated PEGylated MSNs (Cy5.5-PEG-MSNs). PEG = polyethylene glycol. MSNs = mesoporous silica nanoparticles; TEM images of Cy5.5-PEG-MSNs with different sizes: (B) ≈30 nm, (C) 100–150 nm, (D) >300 nm; (E) UV-VIS spectra of Cy5.5 and Cy5.5-PEG-MSNs; (F) optical image of Cy5.5-PEG-MSNs. | |
2. In vivo near-infrared fluorescent optical images according to the size of MSNs
For the in vivo optical image study of the particle size-dependent behavior of the MSNs, female nude mice bearing a subcutaneous U87MG tumor on their right front leg were injected intravenously via the tail vein with the ≈30 nm, 100–150 nm or >300 nm scaled Cy5.5-PEG-MSNs suspended in PBS (Fig. 2A–C, respectively). In vivo NIR fluorescent optical images were obtained from each anesthetized mouse at 1, 3, 6, 12, and 24 h intervals after the injection. In the tumor region of the mouse treated with the ≈30 nm-sized Cy5.5-PEG-MSNs, the fluorescence signal was barely detected, and a relatively low background signal was also noted at all intervals after the injection because they had been washed out rapidly from the body (Fig. 2A). In contrast, the optical images in Fig. 2B revealed a fluorescence signal at 3 h after the injection in the tumor site in the mouse injected with the 100–150 nm-sized Cy5.5-PEG-MSNs. Moreover, the strongest fluorescence intensity was observed in the tumor with a low background signal from the normal tissues at 24 h after the injection. On the other hand, although some mild fluorescence intensity was also observed in the tumor site, the >300 nm-sized Cy5.5-PEG-MSNs were inefficient as an optical contrast agent in the optical images because they provided a high background signal from the normal tissues (Fig. 2C). This in vivo imaging study confirmed that the 100–150 nm size range of Cy5.5-PEG-MSNs could be the optimal size for visualizing tumors in vivo with high tumor accumulation due to the EPR effect.
 |
| Fig. 2 In vivo near-infrared fluorescent optical images of U87MG tumor-bearing mice injected with Cy5.5-PEG-MSNs with different sizes, ≈30 nm (A), 100–150 nm (B) and >300 nm (C) recorded at 1, 3, 6, 12, and 24 h after injection. T = tumor. | |
3. Ex vivo optical images and necropsy data
To confirm the in vivo biodistribution profile of the Cy5.5-PEG-MSNs according to their size, ex vivo imaging studies were performed from the necropsied mice after the last optical imaging scans at 24 h post-injection (Fig. 3). Ex vivo imaging showed good correlations with the in vivo optical imaging results. The ≈30 nm-sized Cy5.5-PEG-MSNs were distributed mostly in the lung and liver, whereas a very low signal intensity was observed in the tumor in the ex vivo image (Fig. 3A). As shown in Fig. 3C, the >300 nm-sized Cy5.5-PEG-MSNs were taken up mainly in the spleen and liver via active phagocytosis of the reticuloendothelial system (RES),16 and only mild fluorescence of the tumor region was observed. On the other hand, the 100–150 nm-sized Cy5.5-PEG-MSNs showed extremely high tumor-accumulation at 24 h after the injection because of the EPR effect with significantly strong fluorescence intensity of the tumor compared to other tissues (Fig. 3B).
 |
| Fig. 3 Ex vivo optical images of the major organs of the U87MG tumor-bearing mice injected with the Cy5.5-PEG-MSNs with different sizes of ≈30 nm (A), 100–150 nm (B) and >300 nm (C) at 24 h after the injection. | |
As shown in Fig. 4, the semi-quantitative analysis results at 24 h after the injection were well-correlated with the observations for the major organs including the tumors obtained from the ex vivo optical images. This analysis showed the different distribution patterns of MSNs in the organs depending on their particle size, In particular, the 100–150 nm diameter Cy5.5-PEG-MSNs showed approximately 4–8 fold higher uptake on the tumor site than the MSNs with different sizes (≈30 or >300 nm in sizes). This shows that the 100–150 nm range is the optimal particle size for the MSNs to maximize the passive tumor targeting via the EPR effect.
 |
| Fig. 4 Necropsy data (n = 4). Quantification of ex vivo images at 24 h after i.v. injection of each Cy5.5-PEG-MSNs with different sizes, ≈30 nm (white bar), 100–150 nm (gray) and >300 nm (black). | |
Conclusion
In summary, we have described the enhanced passive targetability of PEGylated mesoporous silica nanoparticles into the tumor region by size control through an in vivo optical imaging study. Near-infrared (NIR) fluorescent dye (Cy5.5)-functionalized PEGylated MSNs with three different particle sizes (≈30 nm, 100–150 nm and >300 nm) were prepared. The PEG-MSNs showed size-dependent biodistribution profiles in the body. In both in vivo and ex vivo optical imaging studies, the 100–150 nm-sized Cy5.5-PEG-MSNs provided a successful visualization of the tumor at 24 h after the injection with significantly high tumor accumulation and low background uptake through the EPR effect compared to those of other sizes. This size effect of MSNs is expected to be useful in the field of drug delivery using MSNs with “real-time” monitoring through non-invasive imaging modalities. Further studies on the applications of nanoparticle-tracking studies to drug delivery are currently underway.
Experimental
1. Preparation of Cy5.5-PEG-MSNs
NH2-MSNs with three different particles sizes (≈30, 100–150 or >300 nm in size) were synthesized according to the literature.20,21 MeO-PEG12-COONHS (4.0 mg, 5.8 μmol) was added to the suspension of the NH2-MSNs (2 mg) in phosphate buffer solution (PBS, pH 7.2, 3 mL) at 25 °C, and stirred for 6 h. The product, PEG-MSNs were purified by centrifugation (11
000 rpm, 5 min) and washed five times with EtOH/water (3
:
1). For the labeling with Cy5.5, to the suspension of PEG-MSNs (1.0 mg) in PBS (pH 7.2, 2 mL) was added Cyanine 5.5 monosuccinimidyl ester (Cy5.5-NHS ester, 0.3 mg, 0.26 μmol). The reaction solution was stirred at 25 °C for 6 h. Cy5.5-PEG-MSNs (≈30, 100–150 or >300 nm in size) were collected by centrifugation (11
000 rpm, 5 min), washed five times with EtOH/water (3
:
1), and dried overnight under vacuum. A sulfur elemental analysis of the Cy5.5-PEG-MSNs product showed that approximate 0.07 mmol of Cy5.5 moiety was tethered to per gram of Cy5.5-PEG-MSNs. Anal.: S 0.89 ± 0.012 (n = 5).
2. In vivo and ex vivo optical imaging study
All animal experiments were performed in compliance with the policies and procedures of Institutional Animal Care and Use Committee for animal treatment. In vivo optical images for each size of Cy5.5-PEG-MSNs (≈30, 100–150 or >300 nm in size) were acquired using an IVIS system (Caliper Life science, Hopkinton, MA). After anesthetizing with isoflurane (2.0%), Cy5.5-PEG-MSNs (500 μg in 0.1 mL of PBS) were injected intravenously into the U87MG tumor-bearing mice. In vivo near infrared fluorescent optical imaging was performed at 1, 3, 6, 12 and 24 h after injection, using the Cy5.5 filter with the following settings: exposure time (1 s), f/stop (2), binning (8) and field of view (12.8). After acquisition of in vivo optical images, the mice were sacrificed and their major organs, such as heart, lung, liver, pancreas, stomach, spleen, kidney, intestine, muscle, bone and tumor, were imaged ex vivo.
Acknowledgements
This work was supported by Basic Science Research Program (grant code: NRF-2014R1A2A2A03007401) and Nuclear Research & Development Program (grant code: NRF-2013M2A2A7059471) through the National Research Foundation of Korea (NRF) funded by the Ministry of Science, ICT and future Planning, and INHA UNIVERSITY Research Grant (INHA-49297-01).
Notes and references
- G. M. Whitesides, Nat. Biotechnol., 2003, 21, 1161 CrossRef CAS PubMed.
- D. Peer, J. M. Karp, S. Hong, O. C. Farokhzad, R. Margalit and R. Langer, Nat. Nanotechnol., 2007, 2, 751 CrossRef CAS PubMed.
- M. W. Ambrogio, C. R. Thomas, Y.-L. Zhao, J. I. Zink and J. F. Stoddart, Acc. Chem. Res., 2011, 44, 903 CrossRef CAS PubMed.
- Z. Li, J. C. Barnes, A. Bosoy, J. F. Stoddart and J. I. Zink, Chem. Soc. Rev., 2012, 41, 2590 RSC.
- A. S. L. Derycke and P. A. M. de Witte, Adv. Drug Delivery Rev., 2004, 56, 17 CrossRef CAS PubMed.
- E. Amstad and E. Reimhult, Nanomedicine, 2012, 7, 145 CrossRef CAS PubMed.
- Y.-w. Jun, J.-H. Lee and J. Cheon, Angew. Chem., Int. Ed., 2008, 47, 5122 CrossRef CAS PubMed.
- R. Hao, R. Xing, Z. Xu, Y. Hou, S. Gao and S. Sun, Adv. Mater., 2010, 22, 2729 CrossRef CAS PubMed.
- L. Lacerda, A. Bianco, M. Prato and K. Kostarelos, Adv. Drug Delivery Rev., 2006, 58, 1460 CrossRef CAS PubMed.
- A. de la Zerda, C. Zavaleta, S. Keren, S. Vaithilingam, S. Bodapati, Z. Liu, J. Levi, B. R. Smith, T.-J. Ma, O. Oralkan, Z. Cheng, X. Chen, H. Dai, B. T. Khuri-Yakub and S. S. Gambhir, Nat. Nanotechnol., 2008, 3, 557 CrossRef CAS PubMed.
- E. Katz and I. Willner, Angew. Chem., Int. Ed., 2004, 43, 6042 CrossRef CAS PubMed.
- E. Ruoslahti, S. N. Bhatia and M. J. Sailor, J. Cell Biol., 2010, 188, 759 CrossRef CAS PubMed.
- Z. Cheng, A. A. Zaki, J. Z. Hui, V. R. Muzykantov and A. Tsourkas, Science, 2012, 338, 903 CrossRef CAS PubMed.
- D. P. K. Lankveld, R. G. Rayavarapu, P. Krystek, A. G. Oomen, H. W. Verharen, T. G. van Leeuwen, W. H. De Jong and S. Manohar, Nanomedicine, 2011, 6, 339 CrossRef CAS PubMed.
- L. Y. T. Chou, K. Ming and W. C. W. Chan, Chem. Soc. Rev., 2011, 40, 233 RSC.
- J. E. Lee, N. Lee, T. Kim, J. Kim and T. Hyeon, Acc. Chem. Res., 2011, 44, 893 CrossRef CAS PubMed.
- J. M. Rosenholm, V. Mamaeva, C. Sahlgren and M. Lindén, Nanomedicine, 2012, 7, 111 CrossRef CAS PubMed.
- N. K. Mal, M. Fujiwara and Y. Tanaka, Nature, 2003, 421, 350 CrossRef CAS PubMed.
- T. Xia, M. Kovochich, M. Liong, H. Meng, S. Kabehie, S. George, J. I. Zink and A. E. Nel, ACS Nano, 2009, 3, 3273 CrossRef CAS PubMed.
- C.-H. Lee, S.-H. Cheng, I.-P. Huang, J. S. Souris, C.-S. Yang, C.-Y. Mou and L.-W. Lo, Angew. Chem., Int. Ed., 2010, 49, 8214 CrossRef CAS PubMed.
- Y.-S. Lin, C.-P. Tsai, H.-Y. Huang, C.-T. Kuo, Y. Hung, D.-M. Huang, Y.-C. Chen and C.-Y. Mou, Chem. Mater., 2005, 17, 4570 CrossRef CAS.
- L. Pan, Q. He, J. Liu, Y. Chen, M. Ma, L. Zhang and J. Shi, J. Am. Chem. Soc., 2012, 134, 5722 CrossRef CAS PubMed.
- K. Taylor, J. Kim, W. Rieter, H. An and W. Lin, J. Am. Chem. Soc., 2008, 130, 2154 CrossRef CAS PubMed.
- C.-H. Lee, S.-H. Cheng, Y.-J. Wang, Y.-C. Chen, N.-T. Chen, J. Souris, C.-T. Chen, C.-Y. Mou, C.-S. Yang and L.-W. Lo, Adv. Funct. Mater., 2009, 19, 215 CrossRef CAS.
- Q. He, Z. Zhang, F. Gao, Y. Li and J. Shi, Small, 2011, 7, 271 CrossRef CAS PubMed.
- J. Lu, M. Liong, Z. Li, J. I. Zink and F. Tamanoi, Small, 2010, 6, 1794 CrossRef CAS PubMed.
- S. B. Lee, H. L. Kim, H.-J. Jeong, S. T. Lim, M.-H. Sohn and D. W. Kim, Angew. Chem., Int. Ed., 2013, 52, 10549 CrossRef CAS PubMed.
- P. Ray, J. Biosci., 2011, 36, 499 CrossRef.
- S. Luo, E. Zhang, Y. Su, T. Cheng and C. Shi, Biomaterials, 2011, 32, 7127 CrossRef CAS PubMed.
- H. S. Choi, K. Nasr, S. Alyabyev, D. Feith, J. H. Lee, S. H. Kim, Y. Ashitate, H. Hyun, G. Patonay, L. Strekowski, M. Henary and J. V. Frangioni, Angew. Chem., Int. Ed., 2011, 50, 6258 CrossRef CAS PubMed.
- S. Achilefu, Angew. Chem., Int. Ed., 2010, 49, 9816 CrossRef CAS PubMed.
Footnote |
† Electronic supplementary information (ESI) available: All procedure and characterization data of nanoparticles. See DOI: 10.1039/c4ra03905j |
|
This journal is © The Royal Society of Chemistry 2014 |
Click here to see how this site uses Cookies. View our privacy policy here.