Understanding the fate of an anesthetic, nalorphine upon interaction with human serum albumin: a photophysical and mass-spectroscopy approach

Zhengyan Chen a, Hongyu Xub, Yulin Zhu*a, Jingying Liua, Kaiyan Wanga, Peixu Wanga, Shujun Shanga, Xiuna Yia, Zili Wanga, Wei Shaoa and Shudong Zhangc
aDepartment of Anesthesiology, Yantaishan Hospital, 91# Jiefang Road, Yantai 264000, Shandong Province, China. E-mail: zyl0655@sina.com; Fax: +86-0535-6602199; Tel: +86-0535-6602199
bDepartment of Anesthesiology, Zibo Central Hospital, Zibo 255036, Shandong Province, China
cDepartment of Articulation, Yantaishan Hospital, Yantai 264000, Shandong Province, China

Received 18th April 2014 , Accepted 16th May 2014

First published on 16th May 2014


Abstract

Nalorphine is an injectable opioid agonist–antagonist. For understanding its pharmacology, the binding mechanism of nalorphine to a model protein, human serum albumin (HSA), was probed by fluorescence and circular dichroism (CD) Fourier transform infrared spectroscopy (FTIR) and isothermal titration calorimetry (ITC) approaches. The binding affinity of the drug with the native HSA was 7.94 × 10⁵ M−1 at 298 K. Meanwhile, the number of binding site was found to be approximately 1 from fluorescence, ITC and microTOF-Q data. Furthermore, the alterations of protein secondary structure in the presence of nalorphine were assessed by CD, 3D fluorescence and FTIR spectroscopy. Fluorescence resonance energy transfer (FRET) analysis proved the high probability of energy transfer from Trp residue to the drug molecule. The binding site of the drug on HSA was located on the motional restricted hydrophobic pocket of subdomain IIIA, namely site II, and the drug–protein complex was mainly stabilized by electrostatic forces.

1. Introduction

Nalorphine, also known as N-allyl-normorphine, is a mixed opioid agonist–antagonist with a molecular weight of 311.4. The structural formula of nalorphine was shown in Fig. 1. The main use of this medication is in operating suites and critical care where pain relief is required for a short period of time. It is essential for the administering medical professional to be trained in airway management with readily available airway equipment because the drug causes significant respiratory depression and may cause respiratory arrest if given too rapidly or in too high a dose.1–4
image file: c4ra03541k-f1.tif
Fig. 1 Molecular structure of nalorphine.

Serum albumin (SA), as the most abundant protein in blood plasma, functions as a shuttle for various endogenous and exogenous ligands such as fatty acids, hormones, and foreign molecules including drugs. Therefore, SA plays an important role in the distribution, free concentration, excretion, metabolism and interaction with the target tissues of these ligands.5–7 The nature and magnitude of drug–protein interaction significantly influences the biological activity of the drug. Weak binding leads to a short lifetime or poor distribution of ligands, whereas strong binding decreases the concentrations of free ligands in plasma. Consequently, investigations on the affinity and the interaction mechanisms of ligands to serum albumins, which may provide some useful information about therapeutic effective of drugs in pharmacology and pharmacodynamics and design of dosage forms, are of fundamental importance.8,9 Moreover, understanding of various classes of pharmaceutical interactions with albumin helps suggest new approaches to design and drug therapy. For these reasons, in recent years, the interactions of many drugs with SA have been studied. Human serum albumin is a widely studied protein for over 40 years due to its ability to extraordinary binding capacity, availability, stability and altered pharmacokinetic properties; it is also because its primary structure is well-known for a long time and its tertiary structure has been determined by X-ray crystallography. Structurally, HSA is a nonglycosylated consisting of a single peptide chain of 585 amino acids, largely helical (∼60%), with the remaining polypeptide occurring in turns and extended or flexible regions between sub-domains with little β-sheets and having 67 kDa mass, organizes to form a heart shaped protein. HSA consists of three homologous domains, namely, I (residues 1–195), II (196–383), and III (384–585), each domain being divided into sub-domains A and B, and the overall structure is stabilized by 17 disulfide bridges.10 The specific physiological activity of the aromatic and heterocyclic ligands upon complexation with serum albumin originates from the presence of two hydrophobic pockets in sub-domains IIA (site I) and IIIA (site II). HSA contains a single intrinsic tryptophan residue at position 214 in domain IIA, where a large hydrophobic cavity is present, and its fluorescence is sensitive to the ligands bound nearby. Therefore, information about the HSA can be obtained by the measurement of intrinsic fluorescence intensity of the tryptophan residue before and after addition of the drug.

When nalorphine is injected into veins clinically, it binds SA firstly. To the best of our knowledge, there is no report on the interaction between nalorphine and HSA, and no detailed binding information was presented. In the present work, we have employed a combination of experimental and computational approaches, in an attempt to determine where and how nalorphine, as the most common antimalarial drug, binds to HSA under physiological conditions. In order to determine the affinity of nalorphine to HSA and investigate the thermodynamics of their interaction, we carried out investigations on HSA–nalorphine association using fluorescence and mass spectroscopy at different temperatures. The site marker competitive experiments were also carried out to determine the specific binding site of nalorphine to HSA. Along with synchronous fluorescence spectra, we further investigated the conformational change of HSA in buffer solution. In addition, the distance between HSA as donor and nalorphine as acceptor was also evaluated by means of the Förster energy transfer theory. The results of diverse experimental studies were compared and comments were given on the mechanism of binding. This study may provide valuable information related the biological effects of nalorphine and therapeutic effect of this drug in pharmacology and pharmacodynamics.

2. Materials and methods

2.1. Materials

HSA was purchased from Sinopharm Chemical Reagent Beijing Co., Ltd. (Beijing, China). Nalorphine with 98% purity was donated by Shanghai Institute of Pharmaceutical Industry, China. All other reagents of analytical grade were used. Double-distilled water was used throughout the experiments. HSA was dissolved in 0.02 M phosphate buffered saline (PBS) solution to form a 1.0 × 10⁻⁵ M solution and then preserved at 4 °C for later use.

2.2. Methods

All fluorescence spectra were taken on an F-4600 fluorophotometer (Hitachi, Japan) equipped with a 10 mm quartz cell and a 150 W xenon lamp. Varied concentrations of nalorphine and 1 mL of HSA stock solution were added in turn to a 10 mL colorimetric tube and made up to the mark with ultrapure water. After equilibration for 30 min, the fluorescence emission spectra were scanned in the range of 290 to 420 nm using an excitation wavelength of 278 nm. The excitation and emission slit widths were both set at 5 nm. The synchronous fluorescence spectra were operated over the range 250 to 320 nm at Δλ = 15 and 60 nm. The slits for excitation and emission scan were also 5.0 nm. The concentration of HSA was set at 1 × 10⁻⁶ M; and the drug concentrations from a–g are 0, 1, 2, 3, 4, 5 and 6 × 10⁻⁶ M, respectively. All the fluorescence calculations are considered for inner filter effect (IFE) using the method from Zhao.11

Positive ion mode mass spectra were recorded on a micro TOF-Q (Bruker Daltonics, Bremen, Germany) equipped with an electrospray ionization source. For these experiments, the HSA concentration was fixed at 1.5 × 10⁻⁶ M and the nalorphine concentration at 2 × 10⁻⁶ M. Free HSA and HSA–nalorphine were prepared in 0.1% formic acid in water–acetonitrile (1[thin space (1/6-em)]:[thin space (1/6-em)]1) and introduced into the mass spectrometer source with a syringe pump. Electrospray was performed by setting the spray voltage at 4.5 kV. Scanning was performed over an m/z range from 50 to 3000, with collision energy of 10 eV, and data were averaged for 2 min and then smoothed using the Gaussian algorithm in the Bruker Data Analysis 3.4 software program.

The CD spectra of HSA in the absence and presence of nalorphine were measured over the range of 200–250 nm on a J-810 circular dichroism spectrometer (Jasco, Tokyo, Japan) using a quartz cell with a path length of 1 mm. The scanning speed was set at 200 nm min−1. The concentration of HSA was fixed at 2 × 10⁻⁷ M, and the drug concentrations are 0, 4, 10 and 20 × 10−7 M. Each spectrum was the average of two successive scans.

The FTIR spectra of HSA in presence and absence of nalorphine at 298 K were recorded in the range of 1400–1800 cm−1 on a Bruker Vertex 70 FT-IR spectrometer (Bruker, Ettlingen, Germany) via the attenuated total reflection method with resolution of 5 cm−1 and 60 scans. HSA concentration was fixed at 0.1 mM while that of nalorphine was 0.1 mM in the presence of phosphate buffer.

Titration of HSA with nalorphine was performed using a Model Nano-ITC 2G biocalorimetry instrument (TA Instruments, New Castle, DE) at 298 K. All these solutions were thoroughly degassed prior to the titrations to avoid the formation of bubbles in the calorimeter cell. The sample cell was loaded with the phosphate buffer or protein solution and the reference cell contained double distilled water. Nalorphine was titrated into the sample cell by means of syringes via 25 individual injections and the amount of each injection was 10 μL. The contents of the sample cell were stirred throughout the experiment at 200 rpm to ensure thorough mixing.

Binding location studies between nalorphine and HSA in the presence of two site markers, namely phenylbutazone (PHE) and ibuprofen (IB), were measured using a fluorescence titration method. The concentrations of HSA, nalorphine and site markers were set at equimolar concentration (1.1 × 10⁻⁶ M) initially, and the PHE and IB concentration finally reached 330 and 33 × 10−6 M, respectively. Before displacement, ibuprofen or phenylbutazone was incubated with HSA solution for 30 min. Then, 3.0 mL sample was added into a 1.0 cm quartz cuvette, followed by titration of aliquots of nalorphine at 298 K. The emission intensity of mixture was then monitored and recorded from 290 to 420 nm at an excitation wavelength of 278 nm.

3. Results and discussion

3.1. Quenching mechanism of HSA by nalorphine

Fluorescence quenching is a decrease in the quantum yield of fluorescence from a fluorophore induced by a variety of molecular interactions such as excited-state reactions, energy transfer, ground-state complex formation and collisional quenching. The different mechanisms of fluorescence quenching are usually classified as either dynamic or static quenching.12 Dynamic and static quenching is the result of diffusion and ground-state complex formation, respectively. In general, dynamic and static quenching can be distinguished by their differing dependence on temperature. It is known that since higher temperatures result in larger diffusion coefficients, dynamic quenching constants are expected to increase when there is a rise in temperature.13 In contrast, increased temperature is likely to result in decreased stability of complexes and thus lower the values of the static quenching constants.

Fig. 2 shows the fluorescence emission spectra of HSA in the presence of various concentrations of nalorphine at 298 K. HSA had a strong fluorescence emission that peaked at about 340 nm after being excited with a wavelength of 278 nm. When different amounts of nalorphine were titrated into a fixed concentration of HSA, the fluorescence intensity of HSA decreased regularly. Furthermore, there was a slight blue shift at the maximum wavelength of HSA fluorescence emission when the nalorphine solution was added. This suggests that the chromophore of protein was placed in a more hydrophobic environment after addition of nalorphine. Fig. 3A corresponds to the Stern–Volmer plot at different temperatures. It shows that within the investigated concentrations range, the Stern–Volmer plot exhibited a good linear relationship. For dynamic quenching, the fluorescence data at different temperatures were analyzed using the Stern–Volmer equation as follows:14

 
F0/F = 1 + Kqτ0[Q] = 1 + KSV[Q] (1)
where F0 and F are the fluorescence intensities before and after addition of the quencher (nalorphine), respectively; KSV is the Stern–Volmer quenching constant; [Q] is the concentration of quencher; Kq is the quenching rate constant of the biological macromolecule; Kq, and KSV are the average lifetime of the molecule without any quencher; and the fluorescence lifetime of the biopolymer is 1 × 10⁻⁸ s.


image file: c4ra03541k-f2.tif
Fig. 2 Fluorescence emission spectra of HSA in the presence of nalorphine. CHSA: 1 × 10⁻⁶ M, Cnalorphine, a–g: 0, 1, 2, 3, 4, 5 and 6 × 10⁻⁶ M; pH 7.4, T = 298 K. Inset: fluorescence intensity with and without IFE.

image file: c4ra03541k-f3.tif
Fig. 3 (A) Stern–Vlomer plots of HSA–nalorphine interaction data at different temperatures. (B) Hill plots of fluorescence data at different temperatures.

Table 1 summarizes the calculated KSV and Kq at each temperature studied. For dynamic quenching, the maximum scatter collision-quenching constant of various quenchers was 2.0 × 10⁻¹⁰ L mol−1 s−1. Results showed that the values of Stern–Volmer quenching constants KSV and Kq decreased with increasing temperatures and values of Kq (5.14 × 10¹² L mol−1 s−1 at 298 K) were much greater than 2.0 × 10⁻¹⁰ L mol−1 s−1, which indicated that the probable quenching mechanism of HSA–nalorphine interaction was not initiated by dynamic collision but by the formation of a complex (static quenching).15

Table 1 Stern–Volmer quenching constants, binding parameters, and thermodynamic parameters of HSA–nalorphine system at different temperatures
T (K) Stern–Volmer quenching constants Binding parameters Thermodynamic parameters
Kq (M−1 s−1) KSV (M−1) R KA (M−1) n R ΔG (J mol−1) ΔS (J mol−1 K−1) ΔH (J mol−1)
288 6.64 × 10¹² 6.64 × 10⁴ 0.9975 1.20 × 10⁶ 0.96 0.9959 −3.35 × 10⁴ 13.5  
298 5.14 × 10¹² 5.14 × 10⁴ 0.9950 7.94 × 10⁵ 1.02 0.9986 −3.37 × 10⁴ 13.8 −2.96 × 10⁴
308 3.66 × 10¹² 3.66 × 10⁴ 0.9892 4.47 × 10⁵ 1.15 0.9983 −3.40 × 10⁴ 14.2  


3.2. Determination of binding parameters and thermodynamic parameters

When small molecules bind independently to a set of equivalent sites on a macromolecule, binding constant (KA) and number of binding sites (n) can be determined by the following equation:16
 
image file: c4ra03541k-t1.tif(2)
where KA is the binding constant to a site; n is the number of binding sites per HSA molecule; and [Q] is the total quencher concentration. The dependence of log(F0F)/F on the value of log[Q] is linear with the slope equal to the value of n and the value KA is fixed on the ordinate (Fig. 3B). In Table 1, the binding constants KA and sites n were listed for nalorphine associated with HSA. The linear correlation coefficient was more than 0.9 and standard deviation was less than 0.5, indicating that the assumptions underlying the derivation of eqn (2) were satisfactory. Results showed that KA decreased with increases in temperature, which indicated the formation of an unstable HSA–nalorphine complex in the binding reaction. The complex could have been partly decomposed when temperature increased.17

Values of n at the experimental temperatures were approximate to 1, which indicated that there was one class of binding sites to nalorphine in HSA. Interaction forces between small organic and biological macromolecules can include hydrogen bonds, Van der Waals forces, electrostatic and hydrophobic interactions. Thermodynamic parameters as well as enthalpy (ΔH) and entropy changes (ΔS) of the reaction are important for the study of interaction force. If a change in enthalpy (ΔH) does not vary significantly in the temperature range studied, then the values of enthalpy and entropy changes (ΔS) can be determined from Van't Hoff equation:18

 
image file: c4ra03541k-t2.tif(3)
where K is analogous to the effective quenching constant Ka at the corresponding temperature and R is the gas constant. Free energy change (ΔG) was then estimated from the following relationship:19
 
ΔG = ΔHTΔS = −RT[thin space (1/6-em)]ln[thin space (1/6-em)]K (4)

Table 1 shows the values of ΔH and ΔS obtained from the slopes and ordinates at the origin of the fitted lines. Values of ΔH and ΔS were found to be −2.96 × 10⁴ J mol−1 and 13.8 J mol−1 K−1, which indicated that the formation of the HSA–nalorphine complex was an exothermic reaction. In addition, the negative sign for ΔG means that the binding process was spontaneous.

Ross and Subramanian characterized the sign and magnitude of the thermodynamic parameter associated with various individual types of interactions that can occur in the protein association process. From the point of view of water structure, positive ΔS and ΔH values is frequently considered as evidence of hydrophobic interaction, since the water molecules are arranged in an orderly fashion around the drug and protein acquires a more random configuration. Furthermore, specific electrostatic interaction was characterized by the negative ΔH and positive ΔS values, while the negative ΔH and ΔS values arise from typical van der Waals forces and hydrogen bonding interaction.20 The negative value of ΔH (−2.96 × 10⁴ J mol−1) observed in the current experiment could be attributed to electrostatic interactions.

3.3. Electrospray ionization mass spectrometry analysis

The complexation of drug/ligand with HSA at nanomolar levels was demonstrated using microTOF-Q mass spectrometry. MicroTOF-Q mass spectrometry is considered to be an accurate and sensitive method for detecting binding of the drug or ligand to HSA. Fig. 4A and B depict the mass spectra of free HSA and HSA–nalorphine complexes. The numbers on the dark vertical lines indicate the matched charge states of HSA or HSA–nalorphine complexes. Deconvolution of the multiply charged states resulted in the mass determinations of HSA and HSA–nalorphine complexes. When nalorphine bound to free HSA, the molecular mass increased from 66[thin space (1/6-em)]513 Da to 66[thin space (1/6-em)]823 Da, which suggested that nalorphine was, indeed, binding to HSA. Since the molecular weight of nalorphine is 311 Da, this is a clear indication that the additional mass on HSA originated from one molecule of nalorphine ligand. Fluorescence data reveals that the interaction of nalorphine to HSA is 1[thin space (1/6-em)]:[thin space (1/6-em)]1, which is in accordance with the mass spectrometry result. Thus, this additional mass of one drug molecule reveals the presence of a single nalorphine molecule associated with HSA on average.
image file: c4ra03541k-f4.tif
Fig. 4 MicroTOF-Q mass spectra of (A) free HSA and (B) its complex with nalorphine. The concentration of free HSA and nalorphine were 0.15 μM, and 2 μM, respectively.

3.4. Synchronous fluorescence analysis

Synchronous fluorescence spectroscopy is a sensitive technique to analyze the micro-environmental changes of chromophores and have several advantages, including sensitivity, spectral simplification, and spectral bandwidth reduction and avoiding different perturbing effects. The spectrum is obtained through the simultaneous scanning of excitation and emission monochromators of a fluorimeter, with a fixed wavelength difference (Δλ) between them. In the case of HSA, if Δλ = 15 nm, the synchronous fluorescence spectra exhibits the spectral character of the tyrosine residues alone, and if Δλ = 60 nm, it exhibits that of the tryptophan residues alone.21,22 The effect of nalorphine on synchronous fluorescence spectra of HSA at Δλ = 60 and 15 nm are shown in Fig. 5. Obviously, the quenching of the fluorescence intensity of tryptophan residues is stronger than that of tyrosine residue, suggesting that tryptophan residues contribute greatly to the quenching of intrinsic fluorescence of HSA. Moreover, a major red shift in maximum emission wavelength of Tyr residue was observed upon addition of nalorphine, indicating that the conformation of HSA is changed such that the polarity around Tyr residues is decreased and they are placed in a less hydrophobic environment. However, only a slight blue shift was observe in Fig. 5B and it suggested that the overall microenvironment of Trp was also altered; nevertheless, this alteration was trivial compared to that of Tyr (8 nm). These results suggested that nalorphine induces a conformational change in HSA. It is most likely that nalorphine molecule changed the microenvironment and polarity around Tyr residues, which was originally buried deeply in the protein.
image file: c4ra03541k-f5.tif
Fig. 5 Synchronous fluorescence spectra of HSA in the presence of nalorphine at 298 K. (a), Δλ = 60 nm; (b), Δλ = 15 nm; and (c), fluorescence intensity changes. Experimental conditions are in agreement with Fig. 2.

3.5. Three-dimensional fluorescence spectra of the HSA–nalorphine system

Another conformation investigation experiment was undertaken using 3D fluorescence spectroscopy. We generated three contour maps with evidence of different effects of nalorphine on the HSA conformation (Fig. 6). The inclined contour surface is the Rayleigh scattering peak (λex = λem). The fluorescence spectral peak position, intensity and Stokes' shift are summarized in Table 2. Peak 1 is the Rayleigh scattering peak when emission wavelength equals to excitation wavelength, whereas the strong Peak 2 mainly reveals the spectral characteristic of fluorophore (Trp and Tyr) residues and Peak 3 may mainly exhibit the fluorescence characteristic of polypeptide backbone structures.23,24 Upon adding nalorphine there is almost no change in the position of the excitation and emission wavelengths and Stokes' shift, but the molecular microenvironment in the vicinity of the fluorophore residues of HSA showed a distinct change in the polarity after conjugation of nalorphine with HSA. In fact, analysis of fluorophore excitation and emission spectra can provide additional information about changes of the protein conformational state and the fluorophore microenvironment, these data being closely related to solvent exposure and hydrophobicity. Our observations revealed that the polypeptide backbone structures of HSA were altered with Peak 3 showed a major decrease in the fluorescence intensity. The decrease in the fluorescence intensity of the peaks in combination indicated that the interaction of nalorphine with HSA induced a slight unfolding of the protein, which resulted in a conformational change of the protein to increase the exposure of some hydrophobic regions that had been buried. All the above phenomenon and analysis of the fluorescence characteristics of the peaks revealed that the binding of nalorphine to HSA induced some microenvironmental and conformational changes in HSA.
image file: c4ra03541k-f6.tif
Fig. 6 The three-dimensional fluorescence spectral diagrams of HSA before (A) and after nalorphine addition (B). CHSA: 1 × 10⁻⁶ M, Cnalorphine: 6 × 10⁻⁶ M; pH 7.4, T = 300 K.
Table 2 Three-dimensional fluorescence spectral characteristics of HSA and HSA–nalorphine system
Peaks HSA HSA–nalorphine
Peak position λex/λem (nm nm−1) Stokes Δλ (nm) Fluorescence intensity Peak position λex/λem (nm nm−1) Stokes Δλ (nm) Fluorescence intensity
1 λex = λem 0 1924 λex = λem 0 1532
2 278/338 60 4882 278/338 60 3574
3 222/340 118 4677 222/340 118 541


3.6. Energy transfer from HSA to nalorphine

The distance between the binding site and the fluorophore in the protein can be evaluated according to the Förster mechanism of non-radiation energy transfer. According to Förster's theory, if the emitted fluorescence from a donor could be absorbed by an acceptor, the energy may transfer from the donor to the acceptor. The energy transfer effect is related not only to the distance between acceptor and donor (r), but also to the critical energy transfer distance (R0), based on eqn (5):
 
image file: c4ra03541k-t3.tif(5)
where r is the distance between the acceptor and the donor, R0 is the critical distance when the transfer efficiency is 50%, which can be calculated by:
 
R06 = 8.8 × 10⁻²⁵k2N−4ΦJ (6)

In eqn (6), K2 is the spatial orientation factor of the dipole, n is the refractive index of the medium, f is the fluorescence quantum yield of the donor and J is the overlap integral of the fluorescence emission spectra of the donor and the absorption spectra of the acceptor (Fig. S1, ESI data), which can be calculated by the equation:25

 
image file: c4ra03541k-t4.tif(7)
where F(λ) is the fluorescence intensity of the fluorescent donor of wavelength λ, ε(λ) is the molar absorption coefficient of the acceptor of wavelength λ. In the present case, N = 1.336, and Φ = 0.118. Hence, from eqn (5) and (7), we were able to calculate the following parameters, J = 5.53 × 10⁻³ cm3 M−1, R0 = 2.23 nm, E = 0.184, and r = 2.44 nm. The donor to acceptor distance is less than 8 nm and 0.5R0 < r < 2.0R0, which indicate that the energy transfer from HSA to nalorphine occurs with high probability.

3.7. Changes of the protein's secondary structure induced by nalorphine

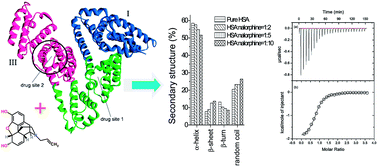
To ascertain the possible influence of nalorphine binding on the secondary structure of HSA, CD measurement was performed in the presence of nalorphine at different concentrations. As shown in Fig. 7, CD spectra of free HSA exhibit two negative bands in the ultraviolet region at 208 and 222 nm which are contributed to n–π* and π–π* transfer for the peptide bond of α-helix.26 It is observed that in presence of nalorphine the CD signal of HSA increased. The increase of the CD signal indicates decrease of helical secondary structure content. This phenomenon is likely with the interaction of HSA with nalorphine. However, the CD spectra of HSA in the presence or absence of nalorphine are similar in shape, indicating that the structure of HSA is also predominantly α-helical. From SELCON 3 software, the quantitative analysis results of the α-helix in the secondary structure of HSA were obtained (Table 3). They differed from 58.1% in free HSA to 57.4% in the nalorphine–HSA at pH 7.4 and temperature 25 °C when the molar ratio was 1[thin space (1/6-em)]:[thin space (1/6-em)]2. The α-helix gradually decreased as the nalorphine portion increased, which reveals that the interaction between nalorphine and HSA leads to changes of the protein's secondary structure and protein unfolding.
image file: c4ra03541k-f7.tif
Fig. 7 (a) CD spectra of HSA–nalorphine system obtained at room temperature and pH 7.4. CHSA: 2 × 10⁻⁷ M, Cnalorphine: 0, 4, 10 and 20 × 10−7 M. (b) Secondary structural content of HSA in the absence and presence of nalorphine.
Table 3 Secondary structural content of HSA in the absence and presence of nalorphine
HSA[thin space (1/6-em)]:[thin space (1/6-em)]nalorphine Content (%)
α-Helix β-Sheet β-Turn Random coil
Pure HSA 58.1 7.9 13.4 20.6
1[thin space (1/6-em)]:[thin space (1/6-em)]2 57.4 8.5 10.6 23.5
1[thin space (1/6-em)]:[thin space (1/6-em)]5 54.2 12.6 9.8 23.4
1[thin space (1/6-em)]:[thin space (1/6-em)]10 51.4 13.5 8.2 26.9


To further understand the structural alternations of HSA induced by the binding of nalorphine to HSA, FT-IR spectroscopy were performed on HSA and nalorphine–HSA system (Fig. 8a and b). The spectrum in Fig. 8a was obtained by subtracting the absorption of the PBS from the spectrum of the protein solution. The spectrum in Fig. 8b was obtained by subtracting the absorption of the nalorphine-free form from that of the nalorphine-bound form. Infrared spectra of proteins exhibit a number of amide bands, which represent different vibrations of the peptide moiety. Among these amide bands of the protein, amide I peak position occur in the range 1600–1700 cm−1 (mainly C[double bond, length as m-dash]O stretch) and amide II band in the region 1500–1600 cm−1 (C–N stretch coupled with N–H bending mode).27 The amide bands have a relationship with the secondary structure of protein, and amide I is less sensitive than amide II for change of secondary of protein. As shown in Fig. 8, the peak position of amide I band shifted from 1655 cm−1 to 1654 cm−1 and amide II band shifted from 1556 cm−1 to 1544 cm−1, implicating that the secondary structure of the HSA protein altered due to interaction of nalorphine. CD as well as FT-IR results unravel that nalorphine bound to HSA brings about changes in secondary structure mainly in the α-helix.28


image file: c4ra03541k-f8.tif
Fig. 8 The infrared spectra of HSA in the absence and the presence of nalorphine (CHSA = Cnalorphine = 1.0 × 10⁻⁴ M) in buffer solution of pH 7.4 at 298 K.

3.8. ITC study of HSA–nalorphine interaction

ITC was used to directly evaluate the effect of the drug on the thermodynamics of the interaction of nalorphine with HSA. Fig. 9a shows the ITC curve of the interaction of nalorphine with HSA (corrected by subtraction of the heat of dilution) in the absence of drug at 25 °C. All peaks were downward, indicating that the reaction was mainly exothermic.29 The respective binding isotherm is shown in Fig. 9b, where nalorphine is corrected for all the dilution effects. The calorimetric data were fitted to single-site binding equations (Table 4). The binding of nalorphine to HSA is observed to be exothermic process with binding constants 6.8 × 10⁵ M−1, as determined by eqn (2). From Table 4 it can be deduced that the reaction was mainly entropy-driven even though enthalpy and entropy were favorable and electrostatic interactions were dominant. The binding process is spontaneous as evidenced by the negative value of ΔG0. These results were in good agreement with the fluorescence spectrometric findings.
image file: c4ra03541k-f9.tif
Fig. 9 Molecular structure of HSA with two binding sites shown. Quenching curves of HSA for two and three components system at molar ratio (a) PHE[thin space (1/6-em)]:[thin space (1/6-em)]HSA from 0[thin space (1/6-em)]:[thin space (1/6-em)]1 to 30[thin space (1/6-em)]:[thin space (1/6-em)]1 and PHE[thin space (1/6-em)]:[thin space (1/6-em)]nalorphine[thin space (1/6-em)]:[thin space (1/6-em)]HSA from 0[thin space (1/6-em)]:[thin space (1/6-em)]1[thin space (1/6-em)]:[thin space (1/6-em)]1 to 30[thin space (1/6-em)]:[thin space (1/6-em)]1[thin space (1/6-em)]:[thin space (1/6-em)]1, (b) IB[thin space (1/6-em)]:[thin space (1/6-em)]HSA from 0[thin space (1/6-em)]:[thin space (1/6-em)]1 to 300[thin space (1/6-em)]:[thin space (1/6-em)]1 and IB[thin space (1/6-em)]:[thin space (1/6-em)]nalorphine[thin space (1/6-em)]:[thin space (1/6-em)]HSA from 0[thin space (1/6-em)]:[thin space (1/6-em)]1[thin space (1/6-em)]:[thin space (1/6-em)]1 to 300[thin space (1/6-em)]:[thin space (1/6-em)]1[thin space (1/6-em)]:[thin space (1/6-em)]1, T = 298 K, pH = 7.4.
Table 4 ITC thermodynamic parameters
KA (M−1) n ΔG0 (J mol−1) ΔS0 (J mol−1 K−1) ΔH0 (J mol−1)
6.8 × 10⁵ 0.88 −3.44 × 10⁴ 103 −2.68 × 10⁴


3.9. Identification of the binding sites

For HSA, there are two types of binding sites, site I (subdomain II A) and site II (subdomain III A) for ligand binding. In order to identify the exact location of the nalorphine, site marker displacement experiments were carried out based on fluorescence assays. Two selected probe compounds are phenylbutazone (PHE) and ibuprofen (IB). Generally, PHE prefers to bind to site I through hydrophobic interactions, whereas IB binds to site II based on a combination of hydrophobic, hydrogen bonding and electrostatic interactions.30 In the present work, firstly, the interactions of PHE and IB with the HSA at different molecular ratio were followed with an excitation wavelength of 278 nm. Furthermore, the competitor IB and PHE were added into nalorphine–HSA system, with a molecular ratio of nalorphine[thin space (1/6-em)]:[thin space (1/6-em)]HSA = 1[thin space (1/6-em)]:[thin space (1/6-em)]1. Compared with the quenching curves of ternary system (competitor–drug–HSA) and the binary system (competitor–HSA), it can be concluded that the absence of competitor IB can significantly influence the quenching approaches of binary and ternary systems (Fig. 10). While as shown in Fig. 10, no significant changes of the HSA fluorescence were found in binary and ternary system at the presence of another competitor PHE. On the other hand, the quantitative analysis for the binding behavior of probe compounds IB and PHE was carried out with term of binding constant (K) to support the conclusion. From Fig. 10, it could be noted that, for competitor PHE, K value of binary system had no any significant effect compared with that of ternary system from 2.57 × 10⁵ M−1 to 2.25 × 10⁵ M−1; while for competitor IB, the binding constant changed greatly from 1.42 × 10⁶ M−1 to 6.88 × 10⁵ M−1.
image file: c4ra03541k-f10.tif
Fig. 10 ITC profile of the titration of 2 × 10⁻⁵ M nalorphine with 2 × 10⁻⁶ M HSA in presence of PBS (pH = 7.4) at T = 298 K.

The results indicated that the great changes of binding constants in binary and ternary systems were mainly due to the displacement of competitor IB, which suggested that nalorphine shared the common binding site with IB, not PHE. In a word, nalorphine was proposed to be bind to one site, namely site II on the HSA.

3.10. Effects of metal ions on HSA–nalorphine system

Plasma contains some of metal ions which have definite ability to maintain normal structures and physiological functions of the proteins. Metal ions are vital to mammals, playing an essentially structural role in many protein-based coordinate bonds.31 Therefore, the presence of metal ions in plasma may affect interaction of drugs with HSA. For the investigation on the effects of metal ions, the concentrations of cations were stabilized at 1 × 10⁻⁶ M, and K+, Ca2+, Ba2+, Hg2+, Zn2+, Mn2+ Cu2+ and Fe3+ were used as foreign substances, the anions were the same chloride ions, which did not affect the protein fluorescence. The binding constants of nalorphine with HSA at 298 K are summarized in Table 5. As evident from Table 5, the binding constant of HSA and nalorphine changed in various degrees in the presence of metal ions, which is likely caused by a conformational change in the vicinity of the binding site. The decrease of the binding constant in the presence of Hg2+, Cu2+ and will shorten the storage time and enhance the toxic effects. Nalorphine does not easily bind HSA in the presence of these ions and competitive interaction between the drug and the ions may occur during the binding process. In contrast, the increasing of the binding constants will buffer the drug concentration in the blood and increase the duration in the plasma. Thus, the desired therapeutic effect will be achieved. Therefore, the increases in binding constants of HSA–nalorphine in presence of the metal ions (K+, Ca+, Ba2+, Zn2+) prolong the storage time of the drug in blood plasma and enhance the maximum effectiveness of the drug. Besides, the binding sites of these metal ions may not similar with the drug, however, by changing the conformation of HSA (loosening or tightening the chains) they influence the binding property of the drug.
Table 5 Binding constants of HSA–nalorphine system in the presence of metal ions
Metal ions K+ Ca2+ Ba2+ Hg2+ Zn2+ Mn2+ Cu2+ Ag+ Control
Ka 8.01 × 10⁵ 7.82 × 10⁵ 7.11 × 10⁵ 5.13 × 10⁵ 6.35 × 10⁵ 8.42 × 10⁵ 4.00 × 10⁵ 5.30 × 10⁵ 7.53 × 10⁵
R 0.9932 0.9833 0.9910 0.9983 0.9828 0.9959 0.9752 0.9794 0.9941
K0/K 0.940 0.963 1.059 1.468 1.186 0.894 1.883 1.421 1


4. Conclusions

This paper demonstrates a detailed investigation on the interaction between HSA and nalorphine using spectroscopic and calorimetric techniques. The experimental data show that the nalorphine could insert into the HSA and quench its intrinsic fluorescence by static mechanism, which was induced by the formation of the nalorphine–HSA complex because the Stern–Volmer quenching constant KSV was inversely correlated with temperature. The apparent binding constants (Ka) between nalorphine and HSA were determined to be 1.20 × 10⁶ (288 K), 7.94 × 10⁵ (298 K) and 4.47 × 10⁵ M−1 (308 K). The number of binding sites (n) for nalorphine was found to be about 1. By means of spectroscopy, we have discovered and interpreted the alteration of the secondary structure of HSA by nalorphine complexation. The results of synchronous fluorescence spectroscopy indicated that the polarity around Tyr residues was increased whereas hydrophobicity around Trp residues was increased when nalorphine interacted with HSA, showing a slight change in the conformation of HSA upon addition of nalorphine under experimental conditions. According to the Förster's theory of non-radiation energy transfer, the binding distance (r) between nalorphine and the tryptophan residue of HSA was calculated as 2.44 nm (298 K). The thermodynamic parameters ΔG < 0, ΔS > 0, and ΔH < 0 at different temperatures indicated that the binding process was spontaneous and electrostatic force played the major role during the interaction. Site probing studies proposed that nalorphine binds to the subdomain IIIA or site II of HSA. This study is expected to provide important insight into the interactions of the physiologically important protein HSA with drugs and it is also looking forward to further supplement.

Acknowledgements

The authors thank Prof. James D. Allen from Lehigh University for editing the manuscript.

References

  1. J. Ahonen, K. T. Olkkola, M. Hynynen, T. Seppälä, H. Ikävalko, B. Remmerie and M. Salmenperä, Br. J. Anaesth., 2000, 85, 533–540 CrossRef CAS PubMed.
  2. M. Michiels, R. Hendriks and J. Heykants, J. Pharm. Pharmacol., 1983, 35, 86–93 CrossRef CAS PubMed.
  3. J. Scholz, M. Steinfath and M. Schulz, Clin. Pharmacokinet., 1996, 31, 275–292 CrossRef CAS PubMed.
  4. J. Helmers, H. Noorduin, A. Van Peer, L. Van Leeuwen and W. Zuurmond, Can. J. Anaesth., 1989, 36, 494–497 CrossRef CAS PubMed.
  5. N. Shaklai, R. L. Garlick and H. F. Bunn, J. Biol. Chem., 1984, 259, 3812–3817 CAS.
  6. R. F. Chen, J. Biol. Chem., 1967, 242, 173–181 CAS.
  7. X. C. Zhao and R. T. Liu, Environ. Int., 2012, 40, 244–255 CrossRef CAS PubMed.
  8. M. Anraku, K. Yamasaki, T. Maruyama, U. Kragh-Hansen and M. Otagiri, Pharm. Res., 2001, 18, 632–639 CrossRef CAS.
  9. G. Sudlow, D. Birkett and D. Wade, Mol. Pharmacol., 1976, 12, 1052–1061 CAS.
  10. D. C. Carter, B. Chang, J. X. Ho, K. Keeling and Z. Krishnasami, Eur. J. Biochem., 1994, 226, 1049–1052 CrossRef CAS PubMed.
  11. X. C. Zhao, R. T. Liu, Z. X. Chi, Y. Teng and P. F. Qin, J. Phys. Chem. B, 2010, 114, 5625–5631 CrossRef CAS PubMed.
  12. G. Weber, Biochem. J., 1952, 51, 155 CAS.
  13. R. Beauchemin, C. N. N'Soukpoe-Kossi, T. J. Thomas, T. Thomas, R. Carpentier and H. A. Tajmir-Riahi, Biomacromolecules, 2007, 8, 3177–3183 CrossRef CAS PubMed.
  14. D. Charbonneau, M. Beauregard and H. A. Tajmir-Riahi, J. Phys. Chem. B, 2009, 113, 1777–1784 CrossRef CAS PubMed.
  15. S. Ashoka, J. Seetharamappa, P. Kandagal and S. Shaikh, J. Lumin., 2006, 121, 179–186 CrossRef CAS PubMed.
  16. X. Zhao, R. Liu, Y. Teng and X. Liu, Sci. Total Environ., 2011, 409, 892–897 CrossRef CAS PubMed.
  17. P. Caravan, N. J. Cloutier, M. T. Greenfield, S. A. McDermid, S. U. Dunham, J. W. Bulte, J. C. Amedio, R. J. Looby, R. M. Supkowski and W. D. Horrocks, J. Am. Chem. Soc., 2002, 124, 3152–3162 CrossRef CAS PubMed.
  18. Y. Shu, M. Liu, S. Chen, X. Chen and J. Wang, J. Phys. Chem. B, 2011, 115, 12306–12314 CrossRef CAS PubMed.
  19. P. Bourassa, C. D. Kanakis, P. Tarantilis, M. G. Pollissiou and H. A. Tajmir-Riahi, J. Phys. Chem. B, 2010, 114, 3348–3354 CrossRef CAS PubMed.
  20. P. D. Ross and S. Subramanian, Biochemistry, 1981, 20, 3096–3102 CrossRef CAS.
  21. Z. Li, G. Jiao, G. Sun, L. Song and F. Sheng, J. Biochem. Mol. Toxicol., 2012, 26, 331–336 CrossRef CAS PubMed.
  22. X. Yang, Z. Ye, Y. Yuan, Z. Zheng, J. Shi, Y. Ying and P. Huang, Luminescence, 2013, 28, 427–434 CrossRef CAS PubMed.
  23. H. Shen, Z. Gu, K. Jian and J. Qi, J. Pharm. Biomed. Anal., 2013, 75, 86–93 CrossRef CAS PubMed.
  24. Y. Zhang, Z. D. Qi, D. Zheng, C. H. Li and Y. Liu, Biol. Trace Elem. Res., 2009, 130, 172–184 CrossRef CAS PubMed.
  25. J. Wu, R. Wei, H. Wang, T. Li and W. Ren, J. Biochem. Mol. Toxicol., 2013, 27, 463–470 CAS.
  26. X. Zhao, F. Sheng, J. Zheng and R. Liu, J. Agric. Food Chem., 2011, 59, 7902–7909 CrossRef CAS PubMed.
  27. S. Dominguez-Medina, S. McDonough, P. Swanglap, C. F. Landes and S. Link, Langmuir, 2012, 28, 9131–9139 CrossRef CAS PubMed.
  28. Y. J. Hu, Y. Ou-Yang, C. M. Dai, Y. Liu and X. H. Xiao, Mol. Biol. Rep., 2010, 37, 3827–3832 CrossRef CAS PubMed.
  29. S. Boulos, T. Davis, J. A. Yang, S. E. Lohse, A. M. Alkilany, L. A. Holland and C. J. Murphy, Langmuir, 2013, 48, 14984–14996 CrossRef PubMed.
  30. C. Han, S. Fang, H. Cao, Y. Lu, Y. Ma, D. Wei, X. Xie, X. Liu, X. Li and D. Fei, J. Hazard. Mater., 2013, 248, 313–321 CrossRef PubMed.
  31. S.-L. Zhang, J.-J. Chang, G. L. Damu, B. Fang, X.-D. Zhou, R.-X. Geng and C.-H. Zhou, Bioorg. Med. Chem. Lett., 2013, 23, 1008–1012 CrossRef CAS PubMed.

Footnotes

Electronic supplementary information (ESI) available. See DOI: 10.1039/c4ra03541k
Both the authors contributed equally and share the first authorship.

This journal is © The Royal Society of Chemistry 2014