A mechanistic and kinetic study of the heterogeneous degradation of chlorpyrifos and chlorpyrifos oxon under the influence of atmospheric oxidants: ozone and OH-radicals

A. El Masri, M. Al Rashidi, H. Laversin, A. Chakir and E. Roth*
GSMA, UMR CNRS 7331, Université de Reims Champagne Ardenne, U.F.R. Sciences Exactes et Naturelles Moulin de la Housse, B.P. 1039, 51687 Reims, France. E-mail: estelle.roth@univ-reims.fr; Tel: +33-(0)3-26-91-32-31

Received 17th April 2014 , Accepted 23rd May 2014

First published on 23rd May 2014


Abstract

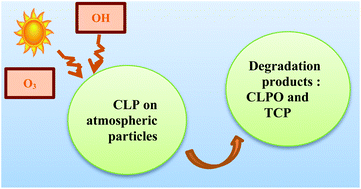
Chlorpyrifos (CLP) is a widely used pesticide and chlorpyrifos oxon (CLPO) is one of its degradation products. They are both detected in the gas and particulate phase of the atmosphere. The kinetics and mechanism of heterogeneous oxidation of CLP and CLPO by ozone and OH radicals have been studied at room temperature using a photochemical reactor coupled to a GC/MS analytical system. CLPO and trichloropyridinol (TCP) were identified as degradation products in sample residues of both ozonolysis and OH-oxidation experiments of CLP. The yields of these products were measured and the results show that pathways producing TCP and CLPO are both of ∼50% for ozonolysis of CLP, whereas OH oxidation produces ∼50% CLPO and ∼25% TCP. Heterogeneous OH-oxidation rates of CLP and CLPO are greater than those measured for ozonolysis, and CLP is twenty times more reactive than CLPO. The calculated CLP lifetimes suggest that once emitted into the atmosphere, CLP can be degraded quite rapidly (∼2 day) by OH radicals in the heterogeneous phase. Meanwhile, CLPO's tropospheric lifetime in the heterogeneous phase towards OH-radicals is in the order of several weeks.

1. Introduction

Pesticides are widely used to improve crop yields worldwide. Such use inevitably results in the contamination of the environment and grown food products, which might endanger human health. In the environment, pesticides are partitioned between water, soil and atmosphere based on their physico-chemical properties, meteorological conditions and soil properties. During and after application, 30–50% of pesticides are transferred to the atmosphere via drift, vaporisation and wind-blown soil erosion.1

Chlorpyrifos ethyl (CLP) is one of the most widely used insecticides in agriculture.2,3 This compound has been detected in various environmental compartments such as marine, rivers, groundwater, fog, rain, and air.4 Due to the low vapour pressure of CLP (lit.,5 1.4 10−3 Pa at 25 °C), this species is expected to be found in both, the particulate and gas phases of the atmosphere. Hart et al.6 detected CLP in particulate matter (PM10) sampled in Valencia Region (Spain) with a frequency close to 50% and concentration levels varying between 1.3 and 210.6 pg m−3. Borrás et al.7 detected CLP concentrations that range from 0.22 to 2.66 and 29.1 to 1428.3 ng m−3 in the particulate and the gas phases of the atmosphere, respectively. Bailey and Belzer8 measured 10–264 pg m−3 of CLP in Canadian atmospheric samples combining particulate and gas phases. The expected degradation product of CLP, the chlorpyrifos oxon (CLPO) has as well been detected in the atmosphere, and was found to be 3.9 to 5.6 times more abundant than CLP.9,10

Very little information exists concerning the atmospheric fate of these compounds. Kinetic studies, in gas phase, of the reaction of OH radicals with CLP at 333 K were performed by Hebert et al.11 using a conventional relative rate method. From their kinetic results a CLP lifetime of about several hours was estimated.11 In addition, this study shows that the oxidation of CLP by OH-radicals does not depend on the temperature.11 Muñoz et al. performed mechanistic and kinetic studies, of the photolysis, ozonolysis and OH-oxidation of chlorpyrifos methyl (CLPM), a compound structurally similar to CLP, and more recently of CLP and CLPO in the gas phase.12 Their results show that chlorpyrifos methyl oxon is the main degradation product of CLPM and that the tropospheric degradation of this compound in gas phase is mainly controlled by reaction with OH radicals whereas photolysis and reaction with ozone are of minor importance.10 More recently, Muñoz et al.13 determined the gas phase OH kinetic of CLP and CLPO leading to lifetimes of 2 h and 11 h, respectively. The product of the OH oxidation of CLP were SO2, CLPO, TCP and diethylphosphate with molar yields of 17, 10, 8 and 30%, respectively.13

To the best of our knowledge, only one study investigates the mechanism and kinetics of ozonolysis of CLP in the particulate phase.14 In this study, CLP-coated azelaic acid particles were oxidized in an aerosol reaction chamber at atmospheric pressure and room temperature. The heterogeneous rate constant was 1.5 10−18 cm3 per molecule per s inducing an atmospheric life-time of 8 days. CLPO was the only detected product.14

The relatively high tropospheric concentrations of CLP and CLPO and the scarcity of relevant kinetic studies, constitute great incentives for the investigation of the atmospheric fate of these compounds, particularly in the heterogeneous phase. In this work we report room temperature rate constants of heterogeneous O3- and OH-oxidation of chlorpyrifos deposited on quartz plaques. Tropospheric lifetimes of CLP with respect to these oxidants are estimated, and consequently its atmospheric fate and persistence are evaluated. CLPO and trichloropyridinol (TCP) are identified as degradation products of CLP oxidation in the sample residues and their yields determined. Finally a mechanism of the heterogeneous oxidation of CLP by ozone and OH radicals is proposed.

2. Materials and methods

2.1 Sample preparation

Solution of 1 mg L−1 of CLP (>99% Sigma Aldrich), CLPO (>98.8% Greyhound Chromatography), CPMPM ((4-chlorophenyl)(3,4-dimethoxyphenyl)methanone) (>90% ChemBridge), terbuthylazine (>99% Sigma Aldrich) were prepared in dichloromethane. The two latter compounds were used as references in the OH-oxidation experiments. Compound coated plaques were obtained by transferring 1 mL aliquots of 1 mg L−1 standard solution of the studied compound in dichloromethane into several 6 × 3 × 1 (L × l × h) cm3 quartz plaques using a micro-pipette. These samples were loaded into the reactor after evaporation of the dichloromethane solvent. For a specific surface area of 56 cm2 for the quartz plaques, as determined by Al Rashidi et al.,15 the surface coverage attained for 1 μg of deposited compound was approximately 63%, 64%, 49% and 47% for CLP, CLPO, CPMPM and terbuthylazine, respectively. Kinetic determinations were performed at theoric surface coverage lower than 100% to minimize multi-layer formation. High coverage level may induce a decrease in the rate of oxidation since some of the pesticide molecules deposited on the quartz surface would be hinder under other molecules, thus rendering them less exposed to the oxidant.16,17

2.2 Experimental device

The experimental setup has been described previously in Al Rashidi et al.15 Briefly, the setup consists of a Pyrex cell, 100 cm in length and 5 cm in diameter, equipped with quartz windows at both extremities. The UV beam issued from a deuterium lamp is aligned and focalized such that it is detected by an AvaSpec CCD camera provided by Avantes, as it exits the reactor. Twelve fluorescent black lamps emitting in the range 280–400 nm are arranged symmetrically around the cell, and used to generate OH radicals from the precursor, nitrous acid (HONO). Ozone and HONO concentrations were measured using UV-spectroscopy, and the pressure inside the reactor was controlled by a 0–1000 mbar MKS Baratron manometer. A platinum resistance temperature sensor (Pt 100-DN 43760) was used to monitor the temperature of the reaction medium. Experiments were conducted at 19 ± 1 and 25 ± 1 °C for ozonolysis and OH-oxidation, respectively.
• Oxidation by O3. Experiments were carried out in the dark under static conditions in order to minimise losses by photolysis and volatilisation, respectively. Ozone was generated from oxygen using an ozoniser, and the O3–O2 mixture was diluted with air before being introduced into the reactor at an adjusted pressure of 400 Torr. The ozone concentration was measured by UV-VIS spectroscopy at 254 nm where σO3 = 1.13 × 10⁻¹⁷ cm2 per molecule.18 Ozone concentrations within the reactor were controlled by varying the discharge voltage of the ozoniser. Several experiments with different ozone concentrations were carried out (Table 1). Volatilisation was also studied in the absence of ozone for both compounds CLP and CLPO. Samples were removed from the reactor at predetermined time intervals, extracted with dichloromethane, and analyzed by GC/MS.
Table 1 Experimental conditions and rate constants for the heterogeneous ozonolysis reactions
  Experiment [O3]g (molecules per cm3) kobs (s−1) kobs (s−1)
CLP 1 0 (0.7 ± 0.2) × 10−5 (0.0 ± 0.3) × 10−5
2 (5.0 ± 0.5) × 1014 (7.5 ± 1.2) × 10−5 (6.8 ± 1.2) × 10−5
3 (9.6 ± 1.4) × 1014 (1.3 ± 0.1) × 10−4 (1.2 ± 0.1) × 10−4
4 (1.2 ± 0.1) × 1015 (1.9 ± 0.2) × 10−4 (1.8 ± 0.2) × 10−4
5 (1.5 ± 0.1) × 1015 (2.0 ± 0.2) × 10−4 (2.0 ± 0.2) × 10−4
6 (2.7 ± 0.2) × 1015 (3.0 ± 0.2) × 10−4 (2.9 ± 0.2) × 10−4
7 (3.8 ± 0.2) × 1015 (3.2 ± 0.4) × 10−4 (3.1 ± 0.4) × 10−4
CLPO 1 0 (9.8 ± 2.4) × 10−6 (0.0 ± 3.4) × 10−6
2 (1.6 ± 0.2) × 1015 (1.5 ± 0.1) × 10−5 (0.6 ± 0.3) × 10−5
3 (2.9 ± 0.3) × 1015 (1.9 ± 0.3) × 10−5 (0.8 ± 0.4) × 10−5
4 (3.4 ± 0.3) × 1015 (2.1 ± 0.1) × 10−5 (1.0 ± 0.3) × 10−5


• Oxidation by OH radicals. HONO, produced via the drop-wise addition of a 10% sulphuric acid solution onto a 0.2 M sodium nitrite solution, was carried into the reactor by an air flow and pressure was completed to 300 or 400 Torr with pure air. As in the case of ozonolysis, experiments were conducted in static mode and HONO concentrations were monitored by UV-VIS spectroscopy at 354 nm where σHONO = 4.87 × 10⁻¹⁹ per cm2 per molecule.19 The OH radicals were generated by the photolysis of HONO using the fluorescent black lamps, which induce a slight increase of the temperature (25 °C). The experimental conditions of these measurements are summarized in Table 2.
Table 2 Experimental conditions and rate constants of heterogeneous OH oxidation of the different compounds investigated in this study
  Pressure (Torr) Number of experiment [HONO] (molecules per cm3) R kOH (cm3 per molecule per s)
CLP/CPMPM 400 2 (1.4 − 6.7) × 1016 3.05 ± 0.51 (5.8 ± 4.0) × 10−12
CLPO/CPMPM 400 2 (4.1 − 8.9) × 1016 0.13 ± 0.03 (2.4 ± 1.8) × 10−13
CLPO/terb 400 2 (0.1 − 1.3) × 1017 1.66 ± 0.38 (2.5 ± 1.9) × 10−13


The kinetics of OH-oxidation of CLP and CLPO were investigated relative to reference compounds. Reference compound rate constant should have been determined in similar conditions and its reactivity should be similar to that expected for the analyzed compounds. CLP reactivity was determined using CPMPM as reference compound, whose rate constant is k(CPMPM+OH) = (1.9 ± 1.1) × 10−12 cm3 per molecule per s (Al Rashidi et al.).20 Meanwhile CLPO reactivity was studied relative to both CPMPM and terbuthylazine21 (k(terbuthylazine+OH) = (1.5 ± 0.8) × 10−13 cm3 per molecule per s since its rate constant stands between both values.

Thus, 1 μg samples of the reference compound were placed alongside pesticide-coated plaques inside the reactor. At increasing time intervals, one sample of each, analyte and reference, was removed from the reactor, extracted with dichloromethane and analysed by GC-MS.

2.3. Sample extraction and analysis by GC-MS

Analyte residues in oxidized and non-oxidized samples were extracted in 3 aliquots of 3 mL of dichloromethane by manual shaking and the total extract volume was brought to 10 mL. The non-oxidized or “blank” samples were used to assess the recovery of the extraction method employed, which was found to be 91 ± 3, 97 ± 6, 96 ± 9 and 96 ± 3% for CLP, CLPO, terbuthylazine and CPMPM, respectively.

The analyte residue was analysed by gas chromatography coupled with a mass spectrometer provided by Thermo Electron (Trace-DSQII). Separation was performed with a 15 m × 0.25 mm × 0.25 μm Agilent DB-5ms column. Helium alpha gas 2 provided by Air Liquide was used as carrier gas with a constant flow of 1.2 mL min−1. 2 μL aliquots of the extracted residue were injected in the splitless mode at 230 °C. Oven temperature was programmed to start at 80 °C and increase up to 200 °C at 40 °C min−1, then increase again up to 250 °C at 20 °C min−1. The mass transfer line was maintained at 260 °C, and mass analyses were performed in the selective ion monitoring (SIM) mode. Selected mass were 96, 197 for CLP and CLPO, respectively, 173 and 214 for terbuthylazine and 165 for CPMPM. Moreover, to identify the degradation products in the residue, analyses were carried out in the total ion current (TIC) mode in order to compare product spectra with the NIST database.

3. Results and discussion

3.1 Oxidation by ozone

• Methods. Treatment of results has been developed in a previous study.15 Briefly, the temporal evolution of the residual analyte concentration [P]t (P = CLP, CLPO) is fitted by a pseudo-first-order kinetics:
 
[P]t = [P]t0[thin space (1/6-em)]exp(−kobst) (1)
where [P]t0 is the initial concentration at t0.

kobs is the sum of first order or pseudo first order rate constants of pesticide degradation pathways.

Under the experimental conditions employed in this study CLP and CLPO undergo volatilization, in addition to ozonolysis. Volatilization is characterized by first order kinetics, and thus, kobs is expressed as follows:

 
kobs = kv + kobs (2)

Experiments were performed with different concentrations of ozone for CLP and for CLPO (Table 1). Fig. 1a and b depict the normalized residual component fraction at exposure time t, [P]t/[P]t0, as a function of time at different ozone concentrations. These curves were fitted by pseudo first order kinetics resulting in the determination of kobs (Table 1). The first experiment for both pesticides was conducted in the absence of ozone and thus provides the rate of pesticide volatilization kv. Pseudo first order rate constants of heterogeneous ozonolysis of the pesticides, kobs, were obtained using relation (2) (Table 1).


image file: c4ra03511a-f1.tif
Fig. 1 Variation of normalized residual pesticide fraction as a function of time at different ozone concentrations (molecules per cm3) for CLP (a) and CLPO (b).

Two heterogeneous kinetic models were used to analyze kobs:

(1) The gas immediate surface reaction (GSR) model:

This model is based on the Eley–Rideal mechanism, wherein gaseous ozone reacts directly with the adsorbed compound P (P = CLP, CLPO). The reaction rate is characterized by a second order rate constant kO3 (cm3 per molecule per s).22

 
P(s) + O3 → products (kO3) (3)

The kinetic rate equation is given by the following relation:

 
image file: c4ra03511a-t1.tif(4)
with kobs = kO3[O3]g.

A plot of kobs as a function of [O3]g yields the value of kO3, the slope of the linear fit.

(2) The surface layer reaction (SLR) or the Langmuir–Hinshelwood model:

This model states that O3 first adsorbs on the surface before reacting with the adsorbed species P:22

 
O3(g) ↔ O3(ads) (KO3) (5)
 
image file: c4ra03511a-t9.tif(6)
where KO3 and image file: c4ra03511a-t10.tif are the ozone-partitioning coefficient between the gas and the surface (cm3) and the second order rate constant of the reaction involving the two adsorbed species (cm2 per molecule per s), respectively. The elaboration and mathematical manipulation of the kinetic rate equations of reactions (5) and (6) leads to the well-known relation that relates image file: c4ra03511a-t11.tif and KO3 to kobs:
 
image file: c4ra03511a-t2.tif(7)
where image file: c4ra03511a-t12.tif represents the maximal pseudo first order rate constant that is attained when the number of occupied adsorption sites on the surface ([SS]) is maximum.

• Results. The plot of kobs as a function of gaseous ozone concentration can be fitted by the two kinetic models presented above (Fig. 2a and b).
image file: c4ra03511a-f2.tif
Fig. 2 Representation of the variation of kobs as a function of the gaseous ozone concentration fitted by the GSR and SLR models for CLP (a) and CLPO (b).

According to the GSR approach, the linear fit of kobs vs. [O3]g gives the following second order rate constant between the adsorbed component and the gaseous ozone:

kO3(CLP) = (1.2 ± 0.1) × 10−19 cm3 per molecule per s (Fig. 2a)

kO3(CLPO) = (2.9 ± 0.7) × 10−21 cm3 per molecule per s (Fig. 2b)

The reported uncertainties in kO3 values are equivalent to the standard deviation of the non-averaged kO3 values, calculated for each individual pair of kobs and ozone concentration values.

Meanwhile, based on the SLR model, the plot of kobs vs. [O3]g was fitted using the non-linear-least-square fit of eqn (7) resulting in the determination of kmax and KO3.

KO3(CLP) = (2.0 ± 0.5) × 10−16 cm3 and kmax(CLP) = (8.2 ± 2.1) × 10−4 s−1

KO3(CLPO) = (5 ± 33) × 10−17 cm3 and kmax(CLPO) = (6 ± 36) × 10−5 s−1

Uncertainty values in kmax and KO3 were determined using the method of least squares.

• Discussion. CLP losses by volatilization are insignificant compared to those instigated by reaction with ozone since volatilization rate constant is at least 10% of the pseudo first order kinetic rate constant, kobs, measured with the lowest ozone concentration (Table 1). The volatilization constant is one order of magnitude lower than that of ozonolysis for the lowest ozone concentration. CLPO volatilization rates, on the other hand, are comparable to those of ozonolysis as they account for 30% of the total loss at highest ozone concentration conditions. Therefore, errors in kmax(CLPO) and KO3(CLPO) are highly sensitive to small variations in kv values. For example, a deviation of 2% in the value of kv changes KO3 and kmax values by 100 and 10 times, respectively. This explains the large error intervals obtained for kmax and KO3 in the case of CLPO. Meanwhile, the same deviation in kv value (2%) has no significant effect on kmax and KO3 of CLP.

With an ozonolysis rate constant (kO3) that is relatively low, CLP may be considered non-reactive component towards ozone. However, the ozone reactivity of CLP is two hundred times greater than that of CLPO. Such results are to be expected since reaction with ozone is mainly influenced by the presence of the P[double bond, length as m-dash]S bonds.12 The low reactivity of CLP can be explained by the presence of the electron withdrawing Cl substituent groups on the aromatic ring of CLP, which significantly reduces the reactivity of the aromatic system towards the electrophilic ozone molecule.

The GSR model fits the experimental data with a correlation coefficient of 0.94 (Fig. 2). The SLR model shows also a good correlation with a coefficient of 0.98. Thus, we can conclude that both models adequately describe the kinetics of the heterogeneous ozonolysis of CLP and that it is not possible to discern the mechanism by which CLP degrades. In the case of CLPO, the GSR model gives an accurate rate constant value, whereas the parameters kmax and KO3 extracted from the SLR model are obtained with a wide range of error. In light of these results, we can conclude that, due to the low reactivity of CLPO, the SLR model is difficult to apply to the experimental results. In order to successfully evaluate the applicability of the SLR model, experiments should be conducted under conditions where the consumption rate of CLPO by ozonolysis is much greater than the volatilization losses. This necessitates ozone concentrations that exceed 1016 molecules per cm3. Such concentrations cannot be generated using the setup employed herein.

Table 3 compares the kinetic parameters reported in this study and those found in the literature for the homogeneous or heterogeneous ozonolysis of pesticides.

Table 3 Summary of ozonolysis rate constants obtained for the compounds investigated in this study as well as other pesticides
Compound Substrate LH ER Reference
kmax s−1 KO3 cm3 kO3 cm3 per molecule per s
Chlorpyrifos Quartz plaques (9.4 ± 3.0) × 10−4 (1.7 ± 0.6) × 10−16 (1.2 ± 0.1) × 10−19 Present study
Chlorpyrifos oxon Quartz plaques ∼5.8 × 10⁻⁵ ∼6.2 × 10⁻¹⁷ ∼2.9 × 10⁻²¹ Present study
Chlorpyrifos Azelaic acid     ∼1.5 × 10⁻¹⁸ (Meng et al.14)
Chlorpyrifos-methyl Gas phase     <2 × 10⁻¹⁸ (Muñoz et al.12)
Z-Dimethomorph Quartz plaques (2.8 ± 1.4) × 10−4 (1.1 ± 0.6) × 10−15 (1.7 ± 0.5) × 10−19 (Al Rashidi et al.23)
E-Dimethomorph Quartz plaques (2.7 ± 1.0) × 10−4 (1.9 ± 0.9) × 10−15 (2.1 ± 0.8) × 10−19 (Al Rashidi et al.23)
Folpet Quartz plaques (1.9 ± 0.9) × 10−4 (1.8 ± 0.9) × 10−16 (2.6 ± 0.2) × 10−20 (Al Rashidi et al.23)
CPMPM Quartz plaques (1.7 ± 1.0) × 10−4 (2.1 ± 1.2) × 10−16 (2.7 ± 0.2) × 10−20 (Al Rashidi et al.23)
Difenoconazole Quartz plaques (4.9 ± 0.5) × 10−5 (9.1 ± 1.0) × 10−16 (2.6 ± 0.4) × 10−20 (Al Rashidi et al.15)
Terbuthylazine Silica     <0.5 × 10⁻¹⁹ (Pflieger et al.24)
Trifluarine Silica (1.1 ± 0.9) × 10−3 (3.4 ± 3.6) × 10−16 (2.9 ± 0.1) × 10−19 (Pflieger et al.24)


Muñoz et al.12 report a superior limit for the ozonolysis of chlorpyrifos-methyl, a compound that is structurally similar to CLP.12 They show that kO3 < 2 × 10⁻¹⁸ cm3 per molecule per s, and thus, the reactivity of chlorpyrifos-methyl towards ozone is low. As the CLP structure is very similar to that of CLPM, it is expected that both compounds would have ozonolysis rate constants that are of the same order of magnitude. However, the results show that CLP is about ten times less reactive. Meng et al.14 investigated the kinetics of ozonolysis of chlorpyrifos on azelaïc acid coated particles and report a value of kO3 ∼ 1.5 × 10⁻¹⁸ cm3 per molecule per s.14 This value is ten times greater than that determined in this study, and of the same order of magnitude as that reported by Muñoz et al.12 for CLPM. The role of the solid support nature could explain this difference since heterogeneous reactivity strongly depends on the nature of the substrate.25 Quartz plaques apparently slow the rate of ozonolysis of CLP compared to gas phase oxidation.

The equilibrium constant of ozone obtained in this study for CLP is three times higher than that determined for CLPO. However, KO3 should be identical for the same support. As can be seen in the Table 3, values of KO3 found in previous studies for the adsorption of ozone on silica vary between 6.2 × 10⁻¹⁷ and 1.9 × 10⁻¹⁵ cm3 (Table 3). As explained by Al Rashidi et al.,23 this discrepancy can be attributed to the chemical nature of the compound deposited which slightly modifies the nature of the surface and thus the affinity of O3 to that surface. Meanwhile, the kmax(CLP) is 16 times greater than kmax(CLPO), indicating that CLP is more reactive towards ozone that obtained for CLPO. As can be seen kmax value varies between 10−4 to 10−6 s−1 and seems to be dependent on the chemical nature of the pesticide which influences the reactivity of these species toward ozone.

3.2 OH heterogeneous oxidation

• Methods. The rate of OH-oxidation of the studied species (P) was determined relative to a reference compound (Ref) whose heterogeneous OH-oxidation rate constant is known. The reactions involved are as follows:
 
P(s) + OH → products (kOH) (8)
 
Ref(s) + OH → products (kref) (9)
where kOH and kref are the rate constants of the heterogeneous OH reactions of the analyte and the reference respectively. Other secondary reactions of first or pseudo first order such as photolysis and wall losses may occur, leading to analyte and/or reference consumption:
 
P(s) → products (kP) (10)
 
Ref(s) → products (kP) (11)
kP and kP represent the sum of the pseudo first order rate constants associated with interfering reactions related to the pesticide and the reference, respectively. A mathematical treatment of the kinetic rate equations of both species yields to the following relation:
 
image file: c4ra03511a-t3.tif(12)
where [P]t0 and [Ref]t0 are the initial concentrations of the studied species and reference at time t0, respectively; [P]t and [Ref]t, the concentrations of the studied species and reference at time t. A plot of image file: c4ra03511a-t4.tif as a function of image file: c4ra03511a-t5.tif results in a linear fit whose slope is equal to R = kOH/kref. Knowing kref, it is possible to determine kOH, the rate constant of the heterogeneous OH-oxidation of the studied compound. In this work we chose CPMPM ((4-chlorophenyl)(3,4-dimethoxyphenyl)methanone) as a reference for both CLP and CLPO. Terbuthylazine was also used as a reference to validate the OH-oxidation of CLPO, since the reactivity of CPMPM was found to be 7 to 8 times higher than that for CLPO. These references were selected because their kinetic rate constants were determined under experimental conditions similar to those employed herein, and because the OH-reactivity of the selected reference compounds is of the same order of magnitude as that expected for the investigated compounds. The rate coefficients of the reference compounds are given below in units of cm3 per molecule per s:
k(CPMPM+OH)) = (1.9 ± 1.1) × 10−12 (Al Rashidi et al.)20

k(terbuthylazine+OH) = (1.5 ± 0.8) × 10−13 (Pflieger et al.)21
• Results. As shown in Fig. 3, 4a and b, good linearity was observed with a correlation coefficient greater than 70%.
image file: c4ra03511a-f3.tif
Fig. 3 Plots of ln([CLP]t0/[CLP]t)/t as a function of ln([CPMPM]t0/[CPMPM]t)/t.

image file: c4ra03511a-f4.tif
Fig. 4 Plots of ln([CLPO]t0/[CLPO]t)/t as a function of ln([CPMPM]t0/[CPMPM]t)/t (a) and ln([Ter]t0/[Ter]t)/t (b).

All experiments were carried out in duplicates and an average ratio R = kOH/kref was calculated. The ratio R and rate coefficients kOH obtained are summarized in Table 2. Uncertainties in kOH values were determined using propagation of error. These uncertainties ranged between 69 to 76% and are mainly attributed to:

(i) the uncertainties in kref: this error is given by the literature and varies from 53 to 58% according to the used reference compound.

(ii) the calculation of the ratio R. This parameter is equivalent to the slope of the linear fit of image file: c4ra03511a-t6.tif as a function of image file: c4ra03511a-t7.tif. Errors in GC-MS concentration measurements, assessed at 3 and 9% for CLP and CLPO, respectively, increase the uncertainty in rate constant values. In order to reduce these errors, several preliminary tests were performed to optimize the analytical conditions employed, such as the column temperature and the choice of the selected mass for monitoring. It should be noted that the relative kinetics method employed in this study takes into account all first and pseudo first order secondary reactions as photolysis and volatilization.

Table 4 compares the kinetic values reported in this study and those reported in the literature.

Table 4 Summary of the OH-oxidation rate constants obtained for the compounds investigated in this study as well as other pesticides from literature
Compound Substrate kOH (cm3 per molecule per s) Reference
Chlorpyrifos Quartz plaques (5.8 ± 4.0) × 10−12 Present study
Gas phase (7.2 ± 1.7) × 10−11 (Hebert et al.)11
Gas phase (9.1 ± 2.1) × 10−11 (Muñoz et al.)13
Chlorpyrifos-oxon Quartz plaques (2.41 ± 1.8) × 10−13 Present study – CPMPM
(2.49 ± 1.9) × 10−13 Present study – terbuthylazine
Gas phase (1.7 ± 0.9) × 10−11 (Muñoz et al.)13
Z-Dimethomorph Quartz plaques (2.0 ± 1.1) × 10−14 (Al Rashidi et al.)20
Gas phase 1.1 × 10⁻¹⁰ AOPWIN-EPI suite v4.10
E-Dimethomorph Quartz plaques (1.7 ± 1.0) × 10−14 (Al Rashidi et al.)20
Gas phase 1.1 × 10⁻¹¹ AOPWIN-EPI suite v4.10
Folpet Quartz plaques (1.6 ± 0.9) × 10−13 (Al Rashidi et al.)20
Gas phase 1.1 × 10⁻¹¹ AOPWIN-EPI suite v4.10
CPMPM Quartz plaques (1.9 ± 1.1) × 10−12 (Al Rashidi et al.)20
Gas phase 2.0 × 10⁻¹¹ AOPWIN-EPI suite v4.10
Difenoconazole Quartz plaques (7.1 ± 0.8) × 10−14 (Al Rashidi et al.)15
Terbuthylazine Silica (1.5 ± 0.8) × 10−13 (Pflieger et al.)21


• Discussion. As shown in Table 4 the heterogeneous OH-oxidation rate constant of CLP is a factor 20 higher than that of CLPO. These results provide evidence that the P[double bond, length as m-dash]S bond is the principal attack site of OH radicals leading to a much more stable product, the CLPO. This trend was also observed in the gas phase for other organophosphorous compounds.26–28

The study of the gas-phase atmospheric chemistry of CLP with OH radicals is presently limited to two investigation carried out by Hebert et al.11 at 333–353 K and Muñoz et al.13 at 303 K. As can be seen in Table 4, the heterogeneous OH-oxidation rate constant of CLP determined in this work is one order of magnitude lower than the gas phase rate constant in other works.11,13 While CLP reactivity was only investigated by Muñoz et al.13

For both CLP and CLPO, we observed that gas phase OH reactivity are respectively 16 times and 70 times greater than heterogeneous reactivity determined in this study (Table 4). Previous studies (Table 4) have highlighted the difference in gas and heterogeneous phase OH-reactivity of several pesticides. This difference can be explained by the inhibiting role of the surface that can hide some active reaction sites of the compound, rendering them less accessible to reaction. Moreover, the higher inhibition for CLPO is due to either a lower accessibility of oxidant to the active reaction sites at the surface or a higher interaction between the pesticide and the substrate. In our case, probably the inhibition of CLPO reaction is due to the fact that CLPO – quartz interaction is higher than that between CLP and quartz.

Studies concerning the heterogeneous kinetics of OH-oxidation of pesticides are rare. Rate constants presented in Table 4 for dimethomorph, folpet, CPMPM, difenoconazole, terbuthylazine. CLP and CLPO range between 6 × 10⁻¹² and 2 × 10⁻¹⁴ cm3 per molecule per s. Considering that the same experimental method and supporting surface were employed in the study of the OH-reactivity of these compounds, it may be concluded that kinetic constants presented in Table 4 depend mainly on the chemical nature of the species.

3.3 Mechanism of oxidation of CLP

• Formation yields and products determination. Chlorpyrifos oxon (CLPO) and trichloropyridinol (TCP) were detected in the condensed phase and identified as two products of CLP oxidation by ozone as well as OH radicals. The sensitivity of the GC-MS analytical technique employed in this study was sufficiently high to detect CLPO in the residues of oxidized CLP samples. Meanwhile, TCP residual concentrations were below the detection limit, and thus, could not be identified.

The monitoring of the degradation of the CLP and the formation of CLPO during an experiment lead to the determination of the formation yields of CLPO. This parameter is equivalent to the slope of the linear fit of ΔCLPO vs. ΔCLP where ΔCLPO is the CLPO concentration formed at a time t and ΔCLP the reacted amount of CLP at the same time (Fig. 5). The formation yields of CLPO derived from plots were 47 ± 2% and 48 ± 2% for ozonolysis and for the oxidation by OH radicals respectively. As seen in Fig. 5, a good linearity was observed with a correlation coefficient higher than 90% showing that CLPO is formed by oxidation of CLP with O3 or OH radicals: other reactions consuming CLPO were minor in front of its formation.


image file: c4ra03511a-f5.tif
Fig. 5 Ozonolysis formation yield of CLPO versus CLP consumption.

As explained above the TCP sensitivity was very low toward the analytical technique used in the present work. Therefore, to determine the formation yield of TCP, several plaques coated with 1 μg of CLP were placed inside the reactor, exposed during 8 hours extracted, evaporated to dryness and taken up in a 1 mL of dichloromethane. No residual CLP was measured and TCP was identified and quantified. A formation yield of 57 ± 1% was obtained for TCP upon oxidation by ozone. This value is substantially identical to that obtained for CLPO formation: the reaction pathways which lead to the formation of TCP and CLPO are thus equivalent in the case of ozonolysis.

In the case of oxidation by radical OH, a TCP formation yield of about 25 ± 1% was determined. TCP might be consumed by other reactions like photolysis since TCP is able to absorb UV-VIS radiations.29

• OH reaction mechanism. Results found in the literature concerning the OH oxidation reaction mechanism of organophosphorus compounds show that the reaction of these compounds with OH mainly involves the transformation of the P[double bond, length as m-dash]S bond to a P[double bond, length as m-dash]O bond.12,27,30 By analogy with the mechanism proposed for CLPM by Muñoz et al., the OH-radical oxidation proceeds via an attack of the P[double bond, length as m-dash]S double bond either on phosphorus or sulphur leading to two different addition channels.12 Addition to phosphorus gives 3,5,6-trichloro-2-pyridinol (pathway A, Fig. 6(a)) an organophosphorus molecule (O,O-diethylphosphorothioate or O,O-diethyl phosphate) and SO2. The radical adduct produced from addition to sulphur eventually forms CLPO and SO2 (pathway B, Fig. 6(a)).
image file: c4ra03511a-f6.tif
Fig. 6 Proposed mechanism of oxidation of CLP by OH-radicals (a) and ozone (b).
• Ozonolysis mechanism. On the basis of the product identification results and the mechanism data found in the literature regarding ozonolysis of unsaturated species, a reaction mechanism of CLP ozonolysis is proposed as shown in Fig. 6(b). CLP ozonolysis is initiated by addition of ozone to the P[double bond, length as m-dash]S moiety leading to the formation of a primary ozonide. The latter undergoes decomposition reactions via two reaction channels. The first one involves the breaking of the P–O bond and the formation of TCP and an organophosphorus molecule (O,O-diethylphosphorothioate or O,O-diethyl phosphate), whereas the second produces CLPO and SO2.

4. Atmospheric implications

The atmospheric fate of the investigated pesticides can be assessed based on their tropospheric lifetime. The kinetic results obtained in this work allowed us to estimate the tropospheric lifetimes, in particulate phase, relative to reactions with OH and ozone according to the equation:
 
τox = 1/kox[Ox]g (13)
where kox is the 2nd order rate constant of oxidation of the analyte by either ozone or OH-radicals, and [Ox]g is the atmospheric concentration of the oxidant. The following relation was employed in the calculation of the life-times of the analytes within the frame of the SLR model ([O3]g represents the gaseous concentration of ozone in the atmosphere):
 
image file: c4ra03511a-t8.tif(14)

The lifetimes were calculated using a global daytime average tropospheric OH radical concentration of 106 molecule per cm3 and a 24 h average O3 concentration of 7 1011 molecules per cm3.31,32

Table 5 summarizes the lifetimes of the investigated species relative to ozone and OH radicals as well as those reported in the literature for other pesticides and structurally similar compounds.

Table 5 Kinetic rate constants and life-times of CLP and CLPO compared to other studies
  Phase τO3 τOH Reference
CLP Quartz plaque 3.3 months 2 days Present study
CLP Azelaïc acid 8 days   Meng et al.14
CLP Gas   3–4 hours Hebert et al.;11 Muñoz et al.13
CLPO Gas   16 hours Muñoz et al.13
CLPO Quartz plaque 11 years 1.6 month Present study


A comparison between ozonolysis and OH-oxidation life-times shows that the atmospheric fate of CLP and CLPO seems to be mainly controlled by their reaction with OH radicals. The lifetime of CLPO is 47 days whereas that of CLP is 2 days. This indicates that particulate phase CLPO is much more persistent than the parent molecule CLP in the atmosphere. Particulate phase CLP has a longer tropospheric lifetime than gas phase (Table 5). However, with a lifetime that do not exceed 2 days, CLP can be considered reactive and non-persistent in the atmosphere.

For more accurate lifetime assessment, other atmospheric removal processes such as dry and wet deposition, photolysis and reaction with NO3 should be included. Nevertheless, it may be concluded that particulate CLP has a short lifetime, and that it reacts relatively quickly to produce CLPO, a compound that is more persistent and substantially more toxic than the parent molecule.33 These results are consistent with field measurements that have detected CLPO at concentrations 3.9 to 5.6 times greater than those of CLP in the atmosphere.9,10

5. Conclusion

To the best of our knowledge, this work represents the first reported kinetic study of heterogeneous CLPO oxidation by ozone and OH radicals, as well as the first study of CLP OH-oxidation kinetics.

Room temperature kinetic rate constants of analyte oxidation were determined experimentally using a photochemical reactor coupled to a GC-MS analytical technique. The obtained results show that the investigated compounds are more reactive towards OH-radicals than ozone. The comparison between the kinetic values reported in this work and those determined previously for other pesticides shows that the reactivity of these species is sensitive to both molecular structure and chemical nature of the support.

Chlorpyrifos oxon (CLPO) and trichloropyridinol (TCP) were quantified in the condensed phase and identified as the major products of the CLP oxidation by ozone as well as OH radicals. From the experimental yields obtained, mechanisms of reactions are proposed to explain the products formation.

The atmospheric lifetimes of the studied compounds were calculated with respect to OH and ozone using room temperature rate coefficients obtained in this work. The calculated CLP lifetimes suggest that once emitted into the atmosphere, CLP can be degraded quite rapidly (∼2 day). Meanwhile, CLPO, a product of oxidation of CLP, is less reactive than the mother molecule towards OH radicals and ozone and has a lifetime of the order of several weeks, indicating that it is relatively persistent. These lifetimes could be suspected to increase for highly contaminated particles due to the influence of coverage on rate constant.

Acknowledgements

The authors would like to acknowledge the Region of Champagne-Ardenne for financing this study, as well as program AQUAL and the VOLUBLIS PHC program MA/10/226.

References

  1. F. Van Den Berg, R. Kubiak, W. G. Benjey, M. S. Majewski, S. R. Yates, G. L. Reeves, J. H. Smelt and A. M. A. Van Der Linden, Water, Air, Soil Pollut., 1999, 115, 195–218 CrossRef CAS.
  2. J. P. Giesy and K. R. Solomon, Ecological Risk Assessment for Chlorpyrifos in Terrestrial and Aquatic Systems in the United States, Springer, 2014 Search PubMed.
  3. A. S. Felsot, Pesticides and Health: Myths vs. Realities, Am Cncl on Science, Health, 2011 Search PubMed.
  4. D. M. Whitacre, Reviews of environmental contamination and toxicology 215, Springer, London New York Dordrecht Heidelberg, 2012 Search PubMed.
  5. EU Pesticides Database, Active Substances, 2011, http://ec.europa.eu/sanco_pesticides/public/index.cfm, accessed February 2014.
  6. E. Hart, C. Coscollà, A. Pastor and V. Yusà, Atmos. Environ., 2012, 62, 118–129 CrossRef CAS PubMed.
  7. E. Borrás, P. Sánchez, A. Muñoz and L. A. Tortajada-Genaro, Anal. Chim. Acta, 2011, 699, 57–65 CrossRef PubMed.
  8. R. Bailey and W. Belzer, J. Agric. Food Chem., 2007, 55, 150–155 CrossRef PubMed.
  9. J. S. LeNoir, L. L. McConnell, G. M. Fellers, T. M. Cahill and J. N. Seiber, Environ. Toxicol. Chem., 1999, 18, 2715–2722 CrossRef CAS.
  10. D. E. Glotfelty, M. S. Majewski and J. N. Selber, Environ. Sci. Technol., 1990, 24(3), 353–357 CrossRef CAS.
  11. V. R. Hebert, C. Hoonhout and G. C. Miller, J. Agric. Food Chem., 2000, 48, 1922–1928 CrossRef CAS PubMed.
  12. A. Muñoz, T. Vera, H. Sidebottom, A. Mellouki, E. Borrás, M. Rodenas, E. Clemente and M. Vazquez, Environ. Sci. Technol., 2011, 45, 1880–1886 CrossRef PubMed.
  13. A. Muñoz, M. Ródenas, E. Borrás, M. Vázquez and T. Vera, Chemosphere, 2014, 111, 522–528 CrossRef PubMed.
  14. J. Meng, B. Yang, Y. Zhang, X. Dong and J. Shu, Chemosphere, 2010, 79, 394–400 CrossRef CAS PubMed.
  15. M. Al Rashidi, O. El Mouden, A. Chakir, E. Roth and R. Salghi, The heterogeneous photo-oxidation of difenoconazole in the atmosphere, Atmos. Environ., 2011, 45, 5997–6003 CrossRef CAS PubMed.
  16. A. Alebic-Juretic, T. Cvitas and L. Klasinc, Environ. Sci. Technol., 1990, 24, 62–66 CrossRef CAS.
  17. U. Pöschl, T. Letzel, C. Schauer and R. Niessner, J. Phys. Chem. A, 2001, 105, 4029–4041 CrossRef.
  18. J. Brion, A. Chakir, J. Charbonnier, D. Daumont, C. Parisse and J. Malicet, J. Atmos. Chem., 1998, 30, 291–299 CrossRef CAS.
  19. S. P. Sander, R. R. Friedl, D. M. Golden, M. G. Kurylo, G. K. Moortgat, H. Keller-Rudek, P. H. Wine, A. R. Ravishankara, C. E. Kolb, M. J. Molina, B. J. Finlayson-Pitts, R. E. Huie and V. L. Orkin, JPL Publ., 2006, 15 Search PubMed.
  20. M. J. Al Rashidi, A. Chakir and E. Roth, Atmos. Environ., 2014, 82, 164–171 CrossRef CAS PubMed.
  21. M. Pflieger, A. Monod and H. Wortham, Environ. Sci. Technol., 2013, 47(12), 6239–6246 CAS.
  22. U. Pöschl, Y. Rudlich and M. J. Ammann, Atmos. Chem. Phys., 2007, 7, 5989–6023 CrossRef.
  23. M. J. Al Rashidi, A. Chakir and E. Roth, J. Phys. Chem. A, 2013, 117, 2908–2915 CrossRef CAS PubMed.
  24. M. Pflieger, A. Monod and H. Wortham, Atmos. Environ., 2009, 43, 5597–5603 CrossRef CAS PubMed.
  25. N.-O. A. Kwamena, M. E. Earp, C. J. Young and J. P. D. Abbatt, J. Phys. Chem., 2007, 111, 11050–11058 CrossRef CAS PubMed.
  26. S. M. Aschmann, W. D. Long and R. Atkinson, J. Phys. Chem. A, 2006, 110, 7393–7400 CrossRef CAS PubMed.
  27. E. C. Tuazon, R. Atkinson, S. M. Aschmann, J. Arey, A. M. Winer and J. N. Pitts, Environ. Sci. Technol., 1986, 20, 1043–1046 CrossRef CAS PubMed.
  28. M. A. Goodman, S. M. Aschmann, R. Atkinson and A. M. Winer, Arch. Environ. Contam. Toxicol., 1988, 17, 281–288 CrossRef CAS.
  29. W. L. Dilling, L. C. Lickly, T. D. Lickly, P. G. Murphy and R. L. McKellar, Environ. Sci. Technol., 1984, 18, 540–543 CrossRef CAS.
  30. R. Atkinson, S. M. Aschmann, J. Arey, P. A. McElroy and A. M. Winer, Environ. Sci. Technol., 1989, 23, 243–244 CrossRef CAS.
  31. R. Atkinson, J. Phys. Chem. Ref. Data, 1997, 26, 215–290 CrossRef CAS PubMed.
  32. R. Vingarzan, Atmos. Environ., 2004, 38, 3431–3442 CrossRef CAS PubMed.
  33. M. B. Kralj, M. Franko and P. Trebse, Chemosphere, 2007, 67, 99–107 CrossRef PubMed.

This journal is © The Royal Society of Chemistry 2014