DOI:
10.1039/C4RA03467H
(Paper)
RSC Adv., 2014,
4, 25957-25962
Detection of the neurotransmitter dopamine by a glassy carbon electrode modified with self-assembled perovskite LaFeO3 microspheres made up of nanospheres
Received
16th April 2014
, Accepted 29th May 2014
First published on 29th May 2014
Abstract
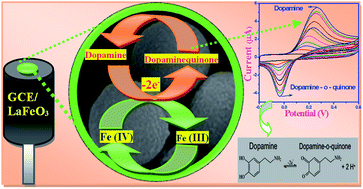
In this paper we report the detection of the neurotransmitter dopamine by an LaFeO3 microsphere-modified electrode in which the microspheres are made up of nanospheres. The morphology, structure and composition of the prepared nanostructure were characterized using SEM, TEM, XRD and XPS, and the electrocatalytic properties were investigated using cyclic voltammetry and amperometric studies. The modified electrodes markedly increased the efficiency of the electrocatalytic oxidation of dopamine. The biosensor exhibited high sensitivity at a low detection limit of 59 nM and wide linear range from 2 × 10⁻⁸ to 1.6 × 10⁻⁶ M (R = 0.9983). More importantly, the sensor effectively avoids the interference of ascorbic acid and uric acid. A possible electrocatalytic mechanism has been proposed. The LaFeO3 microspheres are highly promising for the detection of dopamine because of their high selectivity, fast response and good sensitivity.
1. Introduction
Electroanalytical methods have been used during the past decade to investigate the role of neurotransmitters in the brain due to their electro-active nature.1 Dopamine (DA), ascorbic acid (AA) and uric acid (UA) are critically important compounds not only in the field of diagnostic and pathological research, but also for biomedical chemistry and neurochemistry. Dopamine, in particular, is an important catecholamine neurotransmitter in the mammalian central nervous system, and its depletion in neurons results in diseases such as Parkinson's. Dopamine is found in high amounts (50 nmol g−1) in the caudate nucleus (a region of the brain). In the extracellular fluid of the caudate nucleus, however, dopamine occurs in low concentrations for a healthy individual, and in even lower concentrations or is completely depleted for persons affected with Parkinson's disease.2,3 Selective and sensitive detection of dopamine has been a long-standing goal, and is most advantageously accomplished using electrochemistry. A major problem in dopamine detection, however, is the interference of AA and UA, which are present in biological fluids at much higher concentrations than in dopamine.4 Moreover, the electrode surface can be easily fouled by the products of ascorbic acid and uric acid oxidation, which result in poor selectivity and sensitivity in the detection of dopamine, as reported in our previous publication.5
Controlling the morphology of a nanomaterial is crucial for modifying its properties. Over the past few years, tremendous effort has been expended to control the size and shape of perovskite materials and a variety of morphologies have been reported for the perovskite LaFeO3.6–8 Nanostructures of LaFeO3 have attracted much attention due to their low band gap energy (∼2.1 eV) as well as good catalytic, optical and magnetic properties, which are useful for applications in visible-light photocatalysis, gas sensing, magnetic data storage, photovoltaic cells, solid oxide fuel cells, and most recently as a biosensor.9,10 LaFeO3 nanostructures have been synthesized using a variety of wet chemical techniques such as hydrothermal, sol–gel, co-precipitation, combustion, and sonochemical procedures.11–13 Reflux condensation, however, is a dominant as well as facile tool for the synthesis of anisotropic nanoscale material. A significant advantage of this method over other wet chemical techniques is the possibility to control the size of the material to achieve different morphologies at low temperature. Moreover, this process is relatively simple and cost effective. Our research group is interested in exploring the underlying connection of soft templates such as citric acid, CTAB and urea with different morphologies using wet chemical processes.14
In the present work, we report for the first time the facile synthesis of LaFeO3 microspheres made up of nanospheres via a one-step wet chemical route, as well as the characterization of these microspheres. Furthermore, the fabrication of a modified glassy carbon electrode with LaFeO3 microspheres and its ability to detect dopamine are also reported.
2. Experimental section
2.1 Preparation of LaFeO3 microspheres made up of nanospheres
LaFeO3 microspheres were prepared using analytical-grade lanthanum nitrate hexahydrate (La(NO3)3·6H2O) and potassium ferric cyanide K3[Fe(CN)6] as starting materials and polyethylene glycol (PEG, MW 200) as surfactant. In a typical synthesis, starting materials were dissolved in 30 mL double distilled water under magnetic stirring followed by addition of PEG. The molar amount of PEG surfactant added was equal to the total molar amount of metal nitrate. The solution was refluxed with continuous stirring at 90 °C for 12 h in a three-necked refluxing pot. After the reaction mixture was allowed to cool down to room temperature, the green-coloured precipitate obtained was washed repeatedly with ethanol and distilled water to remove unwanted ions, followed by drying at 80 °C and calcination at 800 °C for 2 h to obtain pure LaFeO3 samples.
2.2 Characterization and property measurements
The structure and purity of the prepared nanostructures were determined using an XRD – Bruker D8 Advance X-ray diffractometer with Cu-Kα radiation (λ = 0.15418 nm). The thermal analysis was determined using thermogravimetric/differential thermal analysis (TG/DTA) (carried out on an SDT Q 600 V20) from RT to 1000 °C under N2 atmosphere. The X-ray photoelectron spectroscopy (XPS) measurement was performed using an ESCA + Omicron UK XPS system containing a Mg Kα source with a photon energy of 1486.6 eV. Scanning electron microscopy (using a JEOL JSM-6380LV microscope) and transmission electron microscopy (using a JEM-2100F microscope), performed with an acceleration voltage of 200 kV by placing the powder on a copper grid, were utilized to observe the morphology and size of the prepared samples. N2 adsorption–desorption was determined by Brunauer–Emmett–Teller (BET) measurements using Micromeritics ASAP 2020 nitrogen adsorption apparatus and the pore size distribution was determined by the Barrett–Joyner–Halenda (BJH) method.
2.3 Electrochemical measurement and fabrication of a modified glassy carbon electrode
Electrochemical measurements were performed (using an EG & G Instrument model 6310 work station) in a conventional two-compartment three-electrode cell with a mirror-polished 0.07 cm−2 glassy carbon (GC) as the working electrode, Pt wire as the counter electrode and 3 M KCl Ag/AgCl as the reference electrode. All the measurements were carried out in phosphate buffer solution (pH = 7.2) under N2 atmosphere at RT. The GC electrode was polished to a mirror-like surface with 0.05 μM alumina powder and sonicated in double distilled water for 10 min. 100 mg of LaFeO3 nanospheres was dispersed in 10 mL of anhydrous alcohol and ultrasonicated for 30 min. 10 μL of this alcohol-dispersed LaFeO3 was dropped onto the GC surface and air dried at ambient temperature.
3. Results and discussion
3.1 Morphological analysis of LaFeO3 microspheres
According to the SEM images (Fig. 1(a)), the synthesized LaFeO3 samples exhibit microsphere-like morphology with size between 0.5 and 1.5 μm. No other morphology was observed, indicating high yield of microspheres. The higher magnification image in Fig. 1(b) clearly reveals that individual LaFeO3 microspheres are made up of numerous nanospheres with a uniform size of ∼60 nm (Fig. 1(c)). This value is in close agreement with the crystalline size determined from XRD discussed in a later section. The TEM image (Fig. 1(d)) of a particular area of an LaFeO3 microsphere shows several anisotropically directed nanospheres self-assembled to form microstructures due to local supersaturation.15 Furthermore, these microspheres are stable, and do not break into scattered individual nanospheres even at high temperatures for long periods of time, which confirms that these nanosphere units are tightly connected with each other to form the entire LaFeO3 microsphere.
 |
| | Fig. 1 SEM image (a) low magnification, (b and c) high magnification (inset – schematic illustration of microspheres), (d) TEM image, (e) HRTEM and (f) SAED pattern of a microsphere made up of LaFeO3 nanospheres. | |
A high-resolution transmission electron microscopy (HRTEM) image of an LaFeO3 nanosphere is shown in Fig. 1(e). The orderly and clear lattice fringes parallel to each other show that the microsphere building blocks are well crystallized, and the interplanar distance between adjacent lattice planes is 0.27 nm, corresponding to the d-spacing of the (121) LaFeO3 plane. In the corresponding selected-area electron diffraction (SAED) pattern (Fig. 1(f)), the major diffraction spots corresponding to (121), (220) and (202) indicate the high crystalline nature. No diffraction spots were attributed to a secondary phase or impurity. The observed results obtained by comparing the TEM and HRTEM images are thus in good agreement with the results of SEM and XRD.
3.2 Formation of LaFeO3 microspheres
When the surfactant PEG was added to the precursor solution containing (La(NO3)3·6H2O) and K3[Fe(CN)6], the metal ions could be easily absorbed on the surface of the non-ionic PEG surfactant because of strong interaction between activated oxygen in the PEG molecular chains and the metal ions. Because of the long-chain structure and flexibility of PEG, the La3d and Fe2p–PEG complex forms a network structure of polymers, and due to hydrogen-bonding effect the complex forms spherical aggregates in water, which act as nucleation centers for the formation of LaFeO3 nanospheres.16 These nanospheres nucleate and mineralize on the surface of LaFeO3 aggregates, forming the microspheres.
3.3 Structural, thermal, composition and surface area analysis of LaFeO3 microspheres
The crystal phase of LaFeO3 microspheres was investigated by XRD. As shown in Fig. 2(a), it is clearly evident that all the diffraction peaks are consistent with the standard data for bulk LaFeO3 crystals (JCPDS 37-1493) which has an orthorhombic perovskite structure with lattice constants a = 5.658, b = 7.855 and c = 5.689 Å. No characteristic peaks arising from reactants, impurities, La2O3/Fe2O3 or other phases were detected. The strong and narrow diffraction peaks observed indicate high crystallinity of the LaFeO3 samples. The average crystallite size was found to be 65 nm using Scherrer's formula.17
 |
| | Fig. 2 (a) XRD pattern, (b) TG/DTA curves, (c) XPS survey spectrum (inset – high resolution spectra of Fe and O) and (d) N2 adsorption–desorption isotherm of microsphere composed of LaFeO3 nanospheres. | |
Fig. 2(b) shows the TG/DTA data obtained for LaFeO3 microspheres conducted at a heating rate of 20 °C min−1. The 1.9% weight loss accompanying the TGA process observed between RT and 380 °C is attributed to the evaporation of absorbed water, also evident from the exothermic peak at 370 °C in the DTA curve. A weight loss of about 2% occurs from 380 to 510 °C and the corresponding DTA peak appears at 500 °C which can be assigned to the decomposition of nitrates and other organic impurities.18 A weight loss of 1.8% between 510 and 760 °C is due to the complete decomposition of oxycarbonates and the corresponding DTA peak at 590 °C may be attributed to the gradual crystallization of LaFeO3. At higher temperatures, no obvious weight loss is observed indicating there is no additional phase or structural change in LaFeO3. Therefore, in order to obtain the LaFeO3 samples with high purity, 800 °C was chosen as the calcination temperature.
The elemental makeup and the oxidation state of LaFeO3 microspheres were studied using an XPS survey spectrum (Fig. 2(c)). No peaks other than La(3d), Fe(2p), O(1s) and C(1s) were observed, which indicates that the synthesized LaFeO3 microspheres are of high purity. All the peaks were calibrated using C1s (284.6 eV) as the reference. La peaks were observed at 845.8 eV which corresponds to spin–orbit splitting of 3d5/2 and 3d3/2 of La3+ ions in the oxide form. The peaks at 719.8 eV correspond to 2p3/2 and Fe 2p1/2, which is consistent with Fe3+ ions in the oxide form.19 The binding energy at 525.8 eV of the O(1s) XPS signal is due to the contribution of La–O and Fe–O in the LaFeO3 crystal lattice. From the relative intensities of the XPS spectra, the atomic ratio was calculated as 1
:
1
:
3 between La, Fe and O.
A N2 adsorption–desorption isotherm (Fig. 2(d)) of LaFeO3 microspheres exhibit a type-IV isotherm with a hysteretic loop in the range 0.6–1.0 P/Po, indicating the presence of mesoporosity. The BJH pore diameter distribution (inset in Fig. 2(d)) shows a pronounced peak, confirming a high degree of uniformity of the pores. The specific BET surface area is 95.80 m2 g−1 and the total pore volume is 0.105 cm3 g−1. The generated mesoporosity in the material is due to the inter-nanosphere space. The large surface area and pore volume indicate that the LaFeO3 microspheres would possess a fascinating ability to adsorb analytes for biosensing.
3.4 Electrocatalytic properties of an electrode modified with LaFeO3 microspheres
Recently, research in the development of perovskite oxide nanostructures has emphasized its application in biosensing. The present study confirms that the LaFeO3 microsphere-modified GC electrode can sense dopamine (DA), ascorbic acid (AA) and uric acid (UA). The electrocatalytic mechanism of the electrode modified with LaFeO3 microspheres (Fig. 3(a)) for dopamine biosensing involves the electrochemical oxidation of Fe(III), producing an Fe(IV) complex on the surface of electrode followed by the electron transfer of dopamine and consequent regeneration of Fe(III) in the complex. The oxidation of dopamine to dopaminequinone by liberating two hydrogens can be catalyzed by the Fe(IV)/(III) redox couple in alkaline medium, which is also confirmed from the oxidation and reduction peaks in Fig. 3(b). The modified electrode exhibited high electrocatalytic activity towards dopamine oxidation, which improves the reversibility and enhances the electron transfer kinetics. The incorporation of the Fe(IV) complex in the LaFeO3 microspheres helped to improve the dopamine electrocatalytic activity.
 |
| | Fig. 3 (a) Schematic illustration of the electrocatalytic mechanism for dopamine oxidation at the LaFeO3 microsphere-modified GCE. (b) Cyclic voltammetry (CV) plot recorded for a low concentration of DA and high concentrations of AA and UA (inset – current versus concentration for UA and AA) and (c) for different concentrations of DA (1 μM to 10 μM). (d) Amperometric i–t curve for the determination of DA concentration by the LaFeO3 microsphere-modified electrode (inset – current versus concentration for DA). | |
Fig. 3(b)(1) shows that modified GCE has no redox peaks for DA, AA and UA, and the oxidation peak potentials are close to each other. The cathodic peak at −60 mV and anodic peak at 140 mV appear for 2 μM DA (Fig. 3(b)(2)), leading to a peak potential separation (ΔE) of about 200 mV for modified GCE. Oxidation of dopamine to dopaminequinone results in the oxidation peak and the reverse reaction leads to the appearance of the reduction peak.
In the cases of 50 μM AA and 100 μM UA, broader oxidation peaks at 188 mV (AA, Fig. 3(b)(3)) and 235 mV (UA, Fig. 3(b)(4)) were observed. The low separation between the oxidation peaks at 48, 47 and 95 mV observed for DA–AA, UA–AA and UA–DA are considered to be insufficient for simultaneous detection of these species. Note that the concentrations of AA and UA are found to be respectively 25 and 50 times higher than the concentration of DA. Finally, the negative surfaces of LaFeO3 microspheres attract the DA cation and simultaneously repel AA and UA anions, which is clearly evident from the redox peak at −50 mV. Therefore, the LaFeO3 microspheres exhibit strong electrocatalytic activity in response to dopamine.
The dopamine peak current was found to increase with dopamine concentration in the range 1.5 × 10⁻⁷ to 5.6 × 10⁻⁶ M as shown by the linear plot with a correlation coefficient of 0.9979 in Fig. 3(d) (inset), and the sensitivity analysis was studied using amperometry.20 The current response for the addition of each 100 nM is presented in Fig. 3(d). The steady state current response was attained within 5 s with a sample interval of 180 s. The dependence of response current on the concentration of DA was linear with a correlation coefficient of 0.9983 as shown in the inset of Fig. 3(c). In the present report, the low detection limit of 59 nM at an S/N = 3 for dopamine concentrations in the range 2 × 10⁻⁸ to 1.6 × 10⁻⁶ M was obtained for the LaFeO3-modified electrode, confirming high selectivity and good sensitivity towards DA. The fabricated LaFeO3-modified electrode has been compared with other reported modified electrodes to examine its superiority and the results are shown in Table 1.
Table 1 Comparison of LaFeO3 dopamine sensor with other reported sensors
| Electrode |
pH |
Linear concentration |
Detection limit (M) |
Ref. |
| MCPE |
4.0 |
2.6 × 10⁻⁴–1.2 × 10⁻³ |
2.5 × 10⁻⁵ |
21 |
| Ru-red/NaY/CPE |
4.8 |
1.2 × 10⁻⁴–1.0 × 10⁻² |
8.5 × 10⁻⁵ |
22 |
| Ionic liquid carbon |
6.8 |
2.6 × 10⁻⁶–1.5 × 10⁻³ |
— |
23 |
| GNP–MEA–NIHCF |
7.0 |
8.2 × 10⁻⁷–2.5 × 10⁻³ |
53 × 10−8 |
24 |
| WO3·H2O–GCE |
7.2 |
1.0 × 10⁻⁷–1.0 × 10⁻⁶ |
12 × 10−8 |
25 |
| PEDOT–SWNT |
7.0 |
2.0 × 10⁻⁵–1.0 × 10⁻¹ |
10 × 10−8 |
26 |
| LaFeO3 |
7.2 |
2 × 10⁻⁸–1.6 × 10⁻⁶ |
59 × 10−9 |
This work |
The reproducibility of the LaFeO3 microsphere-modified electrode was evaluated from a concentration of 0–10 μM in the linear range of 3.6 × 10⁻⁷ to 4.3 × 10⁻⁶ M by CV measurements. The relative standard deviation of the LaFeO3 biosensor at 1 μM response for 5 successive measurements was 2.7%, indicating good reproducibility. The stability of the biosensor was studied by comparing the CV peak current at an interval of 4 h. The decrease in the cathodic peak current was less than 3.4%, indicating good stability. Moreover, the biosensor was able to retain 97.6% of the initial response after one week, suggesting good long-term stability.
4. Conclusion
In summary, we report for the first time the use of reflux condensation to form LaFeO3 microspheres consisting of nanospheres. A GCE modified with these microspheres showed excellent electrocatalytic properties with high selectivity and good sensitivity for DA detection with a wide linear range and without interference of AA and UA despite their concentrations being orders of magnitude higher than that of DA. Therefore, the results highlight the promising use of LaFeO3 microspheres in the construction of new dopamine biosensors.
Acknowledgements
One of the author S.T gratefully acknowledges Jawaharlal Nehru Memorial Fund for Doctoral studies (Ref: SU-A/270/2011-2012/388 dated 09-12-2010) and also Brazilian research financing institutions: CAPES, FAPESP/CEPID 2013/19049-0, INCTMN/CNPq and FAPESP for financial aid.
References
- P. A. Prakash, U. Yogeswaran and S. M. Chen, Sensors, 2009, 9, 1821–1844 CrossRef CAS PubMed.
- G. S. Wilson and R. Gifford, Biosens. Bioelectron., 2005, 20, 2388–2403 CrossRef CAS PubMed.
- A. M. Bertorello, J. F. Hopfield, A. Aperia and P. Greengard, Nature, 1990, 347, 386–388 CrossRef CAS PubMed.
- P. Zhang, F. H. Wu, G. C. Zhao and X. W. Wei, Bioelectrochemistry, 2005, 67, 109–114 CrossRef CAS PubMed.
- S. Thirumalairajan, K. Girija, V. Ganesh, D. Mangalaraj, C. Viswanathan and N. Ponpandian, Cryst. Growth Des., 2013, 13(1), 291–302 CAS.
- H. Su, L. Jing, K. Shi, C. Yao and H. Fu, J. Nanopart. Res., 2010, 12, 967–974 CrossRef CAS.
- G. Wang, J. Sun, W. Zhang, S. Jiao and B. Fang, Microchim. Acta, 2009, 164, 357–362 CrossRef CAS.
- D. Kuang, A. Xu, Y. Fang, H. Q. Liu and D. Fenske, Adv. Mater., 2003, 15, 747–1750 CrossRef.
- R. de la Rica, C. Pejoux, C. F. Sanchez, A. Baldi and H. Matsui, Small, 2010, 6, 1092–1095 CrossRef CAS PubMed.
- M. Law, L. E. Greene, J. C. Johnson and P. D. Yang, Nat. Mater., 2005, 4, 455–459 CrossRef CAS PubMed.
- K. Girija, S. Thirumalairajan, A. K. Patra, D. Mangalaraj, N. Ponpandian and C. Viswanathan, Curr. Appl. Phys., 2013, 13(4), 652–658 CrossRef PubMed.
- X. Li, C. Tang, M. Ai, L. Dong and Z. Xu, Chem. Mater., 2010, 22, 4879–4889 CrossRef CAS.
- J. Chandradass and K. H. Kim, Mater. Chem. Phys., 2010, 122, 329–332 CrossRef CAS PubMed.
- S. Thirumalairajan, K. Girija, N. Y. Helber, D. Mangalaraj, C. Viswanathan and N. Ponpandian, RSC Adv., 2013, 3, 7549–7561 RSC.
- Y. Cheng, Y. S. Wang, Y. H. Zheng and Y. Qin, J. Phys. Chem. B, 2005, 109, 11548–11551 CrossRef CAS PubMed.
- J. Park, V. Privman and E. Matijevic, J. Phys. Chem. B, 2001, 105, 11630–11635 CrossRef CAS.
- P. Sharma, J. Yeo, D. M. Kim and C. H. Cho, J. Mater. Chem., 2012, 22, 2838–2843 RSC.
- M. Lebid and M. Omari, Arabian J. Sci. Eng., 2014, 39, 147–152 CrossRef CAS.
- H. Su, L. Jing, K. Shi, C. Yao and H. Fu, J. Nanopart. Res., 2010, 12, 967–974 CrossRef CAS.
- S. Comby, E. M. Surender and T. Gunnlaugsson, Inorg. Chem., 2014, 53(4), 1867–1879 CrossRef CAS PubMed.
- M. F. S. Teixeira, M. F. Bergamini and N. Bocchi, Talanta, 2004, 63, 1083–1088 CrossRef CAS PubMed.
- X. X. Yan, D. W. Pang, Z. X. Lu and H. J. Tong, J. Electroanal. Chem., 2004, 569, 47 CrossRef CAS PubMed.
- A. Safavi, N. Maleki, O. Moradlou and F. Tajabadi, Anal. Biochem., 2006, 359, 224–229 CrossRef CAS PubMed.
- P. Prabhu, R. Suresh Babu and S. SrimanNarayanan, Sens. Actuators, B, 2011, 156, 606–614 CrossRef CAS PubMed.
- V. Hariharan, S. Radhakrishnan, M. Parthibavarman, R. Dhilipkumar and C. Sekar, Talanta, 2011, 85, 2166–2174 CrossRef CAS PubMed.
- J. Mathiyarasu and L. Nyholm, Electroanalysis, 2010, 22, 449–454 CrossRef CAS.
|
| This journal is © The Royal Society of Chemistry 2014 |
Click here to see how this site uses Cookies. View our privacy policy here.