Vanadium nitride@N-doped carbon nanocomposites: tuning of pore structure and particle size through salt templating and its influence on supercapacitance in ionic liquid media

Nina Fechler*a, Girum Ayalneh Tiruyeb, Rebeca Marcillab and Markus Antoniettia
aMax Planck Institute of Colloids and Interfaces, Colloid Chemistry, Research Campus Golm, Am Mühlenberg 1, 14476 Potsdam, Germany. E-mail: Nina.Fechler@mpikg.mpg.de
bIMDEA Energy Institute, Avda. Ramón de la Sagra 3, 28935 Móstoles, Madrid, Spain

Received 16th April 2014 , Accepted 5th June 2014

First published on 5th June 2014


Abstract

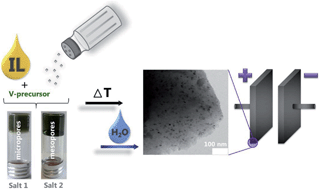
The facile one-step synthesis of composites of highly porous carbons with functional metal nitride nanoparticles with tunable surface area, pore size, pore volume and nanoparticle size is presented using simple salts as porogens. Vanadium nitride (VN) nanoparticles in high surface area nitrogen-doped carbons are made by a simple heat-treatment of mixtures consisting of a vanadium precursor (VOCl3 or NH4VO3), the ionic liquid 1-ethyl-3-methyl-imidazolium dicyanamide (Emim-dca) as solvent and the nitrogen/carbon source, and salts, i.e. cesium or zinc acetate, as porogens. The synthesis takes advantage of a homogeneous starting solution, while in situ pore generation is obtained through demixing in later stages of the reaction. As compared to other templates such as silica, the salt is easily removed with water. Furthermore, the composite properties can conveniently be controlled by the variation of the salt nature and composition of the precursor mixture. Cesium acetate as a porogen at low concentrations results in microporous materials with small VN nanoparticles with a surface area of around 1000 m2 g−1, while increasing salt amounts promote small mesopores with bigger nanoparticles and surface areas of up to 2400 m2 g−1. The utilization of zinc acetate enables the synthesis of entirely mesoporous composites with very small vanadium nitride nanoparticles and surface areas of 800 m2 g−1. Mixtures of these two salt porogens give access to independently tunable surface area, pore size, pore volume and particle size. Comparative electrochemical testing in two ionic liquid (IL) electrolytes quantifies the accessibility of the surface area in two systematic sample series and indicates optimized surface access even for large electrolytes. A variation of ion radius in similar IL-systems quantifies the accessibility of surface in the different hybrid materials. Optimal energy density of the composites in supercapacitor electrodes can only be realized in a fine balance of charge density and electronic/ionic conductivity, which is here realized by fine-tuning the structural parameters.

Introduction

The ability to influence matter on the nanometer scale via composition and morphology has led to an impressive extension of materials properties. A prominent example is carbon which can possess a broad variety of properties depending on the actual nanostructure. In addition, the right combination of different materials into nanocomposites or nanohybrids results in combined or even enhanced properties through synergistic interactions. This approach turned out to be especially attractive for the design of energy materials (for storage and generation) applied as catalysts, in batteries and supercapacitors.1–3 Supercapacitor nanocomposites mostly combine a porous carbon matrix with a redox active species.4–6 While the former contributes a high surface area and provides the electrical conduction pathways for storing energy in the electrical double layer, the latter adds Faradaic reactions e.g. reversible reduction/oxidation processes between the electroactive electrode material and the electrolyte.7–9,16–18 Here, metal oxides (RuO2, MnO2 and V2O5), conductive polymers (polyaniline, polypyrrole), and heteroatom containing carbons are the most examined candidates.7,10–13 Until today, one of the most favorable electrode materials is RuO214 but its high costs essentially shun commercial application.1,7 Vanadium oxides (VxOy) also exhibit a variety of oxidation states,11,15 potentially advantageous for the performance in pseudocapacitors, but the poor electronic conductivity of V2O5 is a prohibitive drawback.11 Recently, vanadium nitride (VN) was found to be a promising electrode material due to its low cost and significantly enhanced electronic conductivity compared to V2O5.15 The high capacities were attributed to a thin oxide layer on top of the surface of the VN.15 However, the rate capability is still rather limited which can be ascribed to still insufficient electronic contacting in between the single VN particles. Eventually, this problem can be solved by the formation of a nanocomposites, most favorably with carbon from a concurrent synthesis approach that generates and controls all synthetic components at the same time.

Recently, we reported a one-pot synthesis approach towards metal nitride nanoparticles within a porous nitrogen-doped carbon matrix (MN@N-dC) using an ionic liquid (IL) as the nitrogen/carbon source.19 However, those composites were not appropriate for supercapacitor applications as the surface area those days was only limited and depended on the metal amount used in the initial precursor solution. Furthermore, the materials were entirely microporous, and larger transport pores important for high rate transport were not accessible.

Herein, we present the possibility to synthesize MN@N-dC composites where besides drastically increased surface areas (2400 m2 g−1 vs. 550 m2 g−1) and pore volumes (1.65 cm3 g−1 vs. 0.2 cm3 g−1), it is now also possible to tune the VN particle size as well as the pore size in the nanometer regime even independently simply through the nature and amount of the added salt. By adding cesium acetate (CsAc) and zinc acetate (ZnAc2) as salt porogens, respectively, porous composites of vanadium nitride nanoparticles and nitrogen-doped carbon (VN@N-dC) with unusually high surface areas of up to 2400 m2 g−1 were synthesized. The salts were chosen as they homogeneously mix with the precursor solution, thus they can act in situ as templates within the carbonization process. Additionally, we can demonstrate that mixtures of these salts allow fine tuning of the composite properties such as porosity and particle size. The usefulness of those nanocomposites is finally exemplified by the application as supercapacitor electrodes in ionic liquid media. Variation of the solvent ion size in those media allows to quantify the accessibility of redox active sites in a variety of diversely structured storage materials.

Experimental section

Materials and methods

Emim-dca was purchased from IoLiTec with a purity of > 98%. The metal precursors VOCl3 (99%), NH4VO3 (99%) as well as cesium acetate (99.9%) and zinc acetate dihydrate (>98%) were acquired from Sigma Aldrich. All chemicals were used without further purification.

In a typical synthesis of the composites, VOCl3 (50 mg) or NH4VO3 (35 mg) were dissolved in Emim-dca (1 g). Varying concentrations of CsAc (max. 1 g), ZnAc2 (1.162 g) or a molar 1[thin space (1/6-em)]:[thin space (1/6-em)]1-CsAc/ZnAc2 mixture were subsequently added. For reasons of comparison, the molar ratio of acetate cation and ionic liquid ion was kept identical for both porogens. A pure reference nitrogen-doped carbon was produced by mixing Emim-dca (1 g) with CsAc (340 mg). All precursors were thoroughly mixed by gentle heating prior to the calcination process. The resulting solutions were placed in a ceramic crucible and heated to 800 °C with a heating rate of 10 K min−1 in a Nabertherm N7/H Chamber Oven. After holding this temperature for 1 h the samples were allowed to cool to room temperature. All steps were carried out under a flow of nitrogen. In order to remove the residual porogen, the materials were grinded and washed in water (the sample solely prepared with ZnAc2*(H2O)2 was additionally washed with 1 M HCl) for several hours and finally filtered off and dried in vacuum.

The resulting composites are named MN@N-dC-x-y-z and the nitrogen-doped carbon N-dC-x-y, respectively, where x indicates the salt amount in mg (notation expressed in amount CsAc), y the type of salt, and z the type of vanadium precursor used for the synthesis, respectively. The composite synthesized with 200 mg instead of 50 mg VOCl3 is labeled VN@N-dC-x-y-z-200.

Characterization

WAXS-patterns were measured on a Bruker D8 Advance instrument using Cu-Kα-radiation. Nitrogen sorption measurements were accomplished with N2 at 77 K after degassing the samples at 150 °C under vacuum for 20 hours using a Quantachrome Quadrasorb SI porosimeter. The surface area was calculated by applying the BET model to the linear part of the isotherm data points of the adsorption branch in the relative pressure range p/p0 < 0.11 for the microporous and p/p0 < 0.3 for the mesoporous materials. The pore size distribution was calculated from N2 sorption data using the nonlocal density functional theory (NLDFT) equilibrium model method for slit pores provided by Quantachrome data reduction software QuadraWin Version 5.05. TEM images were obtained using a Zeiss EM 912 Ω instrument. Elemental analysis was accomplished as combustion analysis using a Vario Micro device. ICP OES analysis was carried out using an ICP OES Optima 2100 DV (Perkin Elmer). XPS-measurements were made with a Kratos Axis165 system using Al-Kα-radiation. SEM images were obtained on a LEO 1550-Gemini instrument after sputtering with platinum. Raman-spectra were taken with a confocal Raman-microscope (Witec Alpha300R) equipped with a 532 nm laser.

Electrochemistry in ionic liquids

3-Electrode set-up. As a standard procedure for electrode preparation, each electrode was prepared by thoroughly stirring the mixture of each respective carbon composite (VN@N-dC-1000-CsAc-VOCl3, VN@N-dC-1000-CsAc-NH4VO3, or VN@N-dC-1000-ZnAc2-NH4VO3) and polytetrafluoroethylene (PTFE 60 wt% dispersion in water, Sigma Aldrich) with 2-propanol as a solvent in order to get a homogeneous paste.29–30 The final composition of the paste was 90 wt% of respective carbon composite and 10 wt% of PTFE as a binder. For the reason of comparison, electrodes were also prepared with the commercial activated carbon Picactif BP 10 (PICA). In the case of PICA electrode, the percentage composition was 80 wt% PICA, 10 wt% binder (PTFE) and 10 wt% carbon black that was added to enhance the electrical conductivity of PICA carbon. Next, the paste was rolled up onto a circle-shaped stainless steel mesh current collector (d = 1 cm). The coated electrodes were then pressed with a uniaxial press (CARVER model 3853-0) applying a pressure of 15 tons (about 2123 kg cm−2) for 7 minutes and dried at 130 °C under vacuum overnight. The mass-loading of the dried electrodes was about 6–8 mg cm−2 of active mass.

Cyclic Voltammetry (CV) was carried out on a multichannel Bio-Logic Lab (model: VMP3) by using a three electrodes Swagelok® cell (half-cell set-up). In this set-up, each carbon composite electrode (VN@N-dC-1000-CsAc-VOCl3, VN@N-dC-1000-CsAc-NH4VO3, VN@N-dC-1000-ZnAc2-NH4VO3) and PICA was used as a working electrode, a silver wire was used as a pseudo reference electrode and an additional PICA electrode having much higher mass than the working electrode (WE) was used as the counter electrode (CE). A 130 μm thick cellulose filter paper soaked with the ILs N-butyl-N-methylpyrrolidinium bis(trifluoromethylsulfonyl)imide (PYR14TFSI, 99.9%, Solvionic, France) or N-butyl-N-methylpyrrolidinium bis(fluorosulfonyl)imide (PYR14FSI, 99.9%, Solvionic, France) was used as a separator. Before assembling the cell, each electrode was impregnated with the electrolyte under vacuum at least for 1 h. Impregnation and assembling of the cell were performed inside the glove box. CV experiments were performed at room temperature over a potential range of −1.75 V to 1.75 V and at scan rates of 100, 50, 20, 10, 5 mV s−1. As indicated above, the specific capacitance (Cam) of the single electrode was calculated from integration of the CV curve. In the case of PYR14TFSI electrolyte same experiments were also carried out at 60 °C.

2-Electrode-setup. Symmetric supercapacitors were assembled using two electrodes Swagelok® cells where the separator soaked with the IL (PYR14TFSI) or (PYR14FSI) was sandwiched between two electrodes (same carbon and same mass). Galvanostatic charge–discharge experiments were conducted at room temperature from 0 to 3.5 V at different current densities: 50, 20, 10 and 5 mA cm−2. In the case of PYR14TFSI electrolyte same experiments were also carried out at 60 °C. From the charge–discharge experimental data, specific capacitance (Csc) and real specific energy (Ereal) of the full supercapacitor were calculated as shown below.
 
image file: c4ra03461a-t1.tif(1)
 
image file: c4ra03461a-t2.tif(2)

Here, I is the discharge current, mtam is the total active mass in the supercapacitor, dV/dt is the slope of the discharge curve. ti and tf are the integration limits corresponding to the time in which the discharge starts and finishes. In a symmetrical system, the specific capacitance referred to a single electrode (Cam) is related to the capacitance of the SC (Csc) by the following expression: Cam (F g−1) = 4Csc.

Results and discussion

As stated above, simultaneous control of the composite properties within a single step is synthetically highly appealing. Generally, the synthesis of the materials in the present manuscript starts with dissolving the metal precursor and the template salt in the IL. The herein used ionic liquid serves as model precursor and future market of this substance class is very likely to become cheaper thanks to the extensive (research-)progress in ionic liquids derived from sustainable precursors.31 In order to evaluate the influence of the salt porogen amount, a series of composites was prepared with a fixed amount of VOCl3, the IL Emim-dca and varying concentrations of CsAc. Mixing VOCl3 with Emim-dca results in a homogeneous green solution which indicates that already before the heat treatment the initial oxidation state V5+ is reduced to V3+(Fig. 1a). Further addition of CsAc gives a liquid green salt solution after gentle heating, which turns more viscous at low and gelatinous/glassy at high salt concentrations after being cooled back to room temperature (Fig. 1b). The gel/glass can reversibly be liquefied by reheating, indicative of the formation of a physical network where the CsAc salt ions cross-link the IL solvent clusters via strong solvent coordination. The heat-treatment of this easy-to-process liquid precursor solution under inert atmosphere and aqueous removal of the salt porogen finally results in highly porous composites which are isolated as voluminous black powders (Fig. 1c).
image file: c4ra03461a-f1.tif
Fig. 1 (a) Preparation of the composite precursor solution by dissolution of VOCl3 in Emim-dca. (b) Precursor solution with CsAc of VN@N-dC-1000-CsAc-VOCl3 before and (c) after calcination at 800 °C and aqueous porogen removal.

A representative transmission electron microcopy (TEM) picture of VN@N-dC-340-CsAc-VOCl3 is shown in Fig. 2. It reveals nanoparticles with an average particle size of around 10 nm in diameter, embedded within a porous carbon matrix. This is very different from previous works where solely carbon materials were prepared.32–34 Scanning electron microcopy (SEM) images of VN@N-dC-340-CsAc-VOCl3 and VN@N-dC-1000-CsAc-VOCl3 show additional larger particles on the outer surface of the final material as coexisting species, which grow bigger with higher porogen salt concentrations (Fig. 2).


image file: c4ra03461a-f2.tif
Fig. 2 (a) TEM images of VN@N-dC-340-CsAc-VOCl3. SEM images of (b) VN@N-dC-340-CsAc-VOCl3 and (c) VN@N-dC-1000-CsAc-VOCl3, characterizing growth of non-hybridized outer VN particle species as a defect structure.

Wide angle X-ray scattering (WAXS) patterns of the washed products can be assigned to pure VN (Fig. SI-1a). At a fixed VOCl3 concentration, the diffraction peaks turn narrower with increasing CsAc concentration, i.e. the nanoparticles become larger. On the one hand, this probably arises from a decrease in viscosity at reaction temperature. On the other hand, high amounts of salt might lower the solubility within the precursor solution at the reaction temperature. The crystallite sizes were calculated using the Scherrer equation (Fig. SI-1b), which however came out smaller than depicted in microscopy. Here, it is worth to mention that the Scherrer equation is only applicable to spherical particles and solely corresponds to primary crystallite size. Thus, the results from TEM/SEM and WAXS can deviate, yet a general trend of increased structural size with the porogen amount is observed in all cases.

It is known that carbonized Emim-dca without any template shows no porosity.20–21 This is also observed if only small amounts of VOCl3 (50 mg) are added (VN@N-dC-0-VOCl3, Brunauer–Emmett–Teller (BET) evaluation 20 m2 g−1), which is in accordance with our previous work (Fig. 3).19


image file: c4ra03461a-f3.tif
Fig. 3 (a) Nitrogen sorption isotherms of VN@N-dC-x-CsAc-VOCl3 at different CsAc concentrations x. (b) Trend of the apparent surface areas of the same series of composite materials.

However, through the addition of the salt CsAc, the surface area of the composite increases significantly (Fig. 3). At a fixed VOCl3 amount, the isotherms are of type I for 0 to 500 mg CsAc which implies a solely microporous structure of the composites, i.e. the salt presumably acts as a ”molecular template”. At 750 mg CsAc, the sorption isotherm shows a further uptake of N2 in the medium relative pressure region, reflecting a contribution of additional supermicropores and small mesopores which are attributed to small salt clusters in the 2 nm range now acting as template. Finally, for the highest CsAc concentration, a small hysteresis is observed in the isotherm, underlining that the content of small mesopores has significantly been increased. While for VN@N-dC-340-CsAc-VOCl3 a high contribution of pores around 1 nm in diameter can be observed, additional pores of around 3 nm are found for VN@N-dC-1000-CsAc-VOCl3 (Fig. SI-2). The apparent surface area increases about linearly with increasing CsAc concentrations (Fig. 3b), which means that the salt indeed mainly acts as molecular or nanoclustered template, with the larger pores created by percolation effects setting in at high salt concentrations. Here, it is noted that an apparent surface area of 2400 m2 g−1 is much higher than that of any zeolite,22 approaching the theoretical value of molecularly dispersed single layer graphene23 and is of the order of the highest surface areas found for activated carbons.24 Taking into account the simplicity of the applied one step process, this is a remarkable result. As a reference experiment to demonstrate the importance of added metal precursor, a pure nitrogen-doped carbon N-dC-340-CsAc was prepared without vanadium precursor. The nitrogen sorption of the calcined and washed product reveals only a moderate apparent surface area of 200 m2 g−1 compared to 1000 m2 g−1 for the respective metal containing composite VN@N-dC-340-CsAc-VOCl3. In the pure hybrid VN@N-dC-0-VOCl3, we assumed the porosity to originate from a cohesive delamination at the material interfaces caused by the growth of the metal nitride nanoparticles in between the forming carbon layers. In the pure salt melt system N-dC-340-CsAc, entrapped salt is present in the final carbon as even medium amounts of salt are not sufficient to create percolating, accessible pores: the mixing of carbon and salt is very homogeneous. Obviously, nanoparticles promote the entry to those salt pores by creating additional pores via interfacial delamination. This is supported by the measurement of residual Cs content in the reference carbon of 3 wt%, compared to 0.1 wt% in the composite as determined by inductively coupled plasma optical emission spectrometry (ICP-OES). In VN@N-dC-1000-CsAc-VOCl3, the very high apparent surface area of 2400 m2 g−1 could be generated even at low metal nitride concentrations. The overall pore volume of the material nicely coincides with expectation based on the relative salt porogen content. Etching processes by the base CsOH cannot be excluded, but are not necessary to describe the pore volume of the material. In addition, the carbon yield is too high for a major contribution of classical activation.

To investigate a possible influence of the metal precursor as well as the template salt, VOCl3 was replaced by NH4VO3 and zinc acetate (ZnAc2) chosen as second porogen. Two composites were prepared with the pure porogens CsAc and ZnAc2 and, for proof of principle, a third one with a 1[thin space (1/6-em)]:[thin space (1/6-em)]1-CsAc/ZnAc2 mixture of both salts, all at the highest amount of salt. For better comparison, the molar metal and salt concentrations were kept equal to the VOCl3/CsAc system.

In contrast to the VOCl3/CsAc system, the initial precursor mixture of VN@N-dC-1000-CsAc-NH4VO3 forms a dark black solution and the addition of CsAc leads to a beige solid (Fig. 4). This points to the formation of V2O3 and [V(O2)]3+ or H3[VO2(O2)] species from NH4VO3, respectively. However, exchange of CsAc for ZnAc2 leads to a green gel, again indicative for V3+ ions. The formation of a gel is attributed to the stronger coordination ability of zinc compared to cesium which eventually results in a more homogeneous network.


image file: c4ra03461a-f4.tif
Fig. 4 (a) Dissolution of NH4VO3 in Emim-dca, (b) precursor solution of VN@N-dC-1000-CsAc-NH4VO3 and (c) VN@N-dC-1000-ZnAc2-NH4VO3.

TEM pictures of the final products reveal the biggest VN nanoparticles for CsAc, followed by the 1[thin space (1/6-em)]:[thin space (1/6-em)]1-CsAc/ZnAc2 mixture and finally very small VN nanoparticles in the case of ZnAc (Fig. 5). This already indicates the possibility to influence the particle size through the nature or composition of the salt template. WAXS patterns of the composites still give reflections ascribed to vanadium nitride, thus the nitride formation is not influenced as such (Fig. 5). The peaks become narrower from ZnAc2 over the CsAc/ZnAc2 mixture to CsAc which reflects an increase in the crystallite size and supports the results obtained from TEM. The smaller crystallite size for the ZnAc2-containing systems is attributed to the more homogeneous precursor structure and the stronger complexation of the ILs to the zinc ions.


image file: c4ra03461a-f5.tif
Fig. 5 (a–c) TEM pictures and (d) WAXS patterns of VN@N-dC-1000-ZnAc2-NH4VO3 (a), (green), VN@N-dC-1000-1[thin space (1/6-em)]:[thin space (1/6-em)]1CsAc/ZnAc-NH4VO3 (b), (blue) and VN@N-dC-1000-CsAc-NH4VO3 (c), (red).

Nitrogen sorption measurements (Fig. 6) of the composites show that also the surface area, pore size and pore volume can be tuned simply by the nature of the salt. While VN@N-dC-1000-CsAc-NH4VO3 solely prepared with CsAc reveals again an isotherm with a small hysteresis loop indicative of small mesopores, the Zn-based material VN@N-dC-1000-ZnAc2-NH4VO3 shows a type IV isotherm with a pronounced hysteresis typical for bigger mesopores. The corresponding pore size distribution (PSD) quantifies this behavior with an average pore diameter of 5 nm (Fig. 6b).


image file: c4ra03461a-f6.tif
Fig. 6 (a) Nitrogen sorption isotherms and (b) PSD of VN@N-dC-1000-ZnAc2-NH4VO3 (green), VN@N-dC-1000-1[thin space (1/6-em)]:[thin space (1/6-em)]1CsAc/ZnAc-NH4VO3 (blue) and VN@N-dC-1000-CsAc-NH4VO3 (red).

The low amount of micropores in VN@N-dC-1000-ZnAc2-NH4VO3 is probably due to the smaller VN nanoparticles with their decreased ability to form delamination cracks (thus giving access to the micropores), but the presence of a remainder of zinc oxide structures to block the pores can neither be excluded. Both effects result in an overall lower total pore volume and surface area than the corresponding CsAc-materials. The porosity of a composite prepared with the 1[thin space (1/6-em)]:[thin space (1/6-em)]1-CsAc/ZnAc2 mixture is finally in between the respective values of the pure salt systems. The comparison with composites produced with half the amount of salt are very different to the salt mixture and thereby exclude that the porosity only results from one salt component (Fig. 6).

In general, this orthogonality offers the opportunity to tune the particle size and pore architecture independently by using different amounts and compositions of a porogen salt mixture. Based on these results, a schematic model of the ongoing structural processes during the carbon and composite formation can be drawn (Scheme 1).


image file: c4ra03461a-s1.tif
Scheme 1 Stages of product formation using an IL (yellow), a metal precursor (M, black) and salt templating (Sa, red). Precursor mixtures at room temperature (column 1), low heating-temperature (column 2), high/final heating-temperature (column 3, 5 magnification) and after washing (column 4). Salt free composite (row A), salt templated carbon (row B), salt templated composite at low salt concentration (row C) and salt templated composite at high salt concentration (row D).

The amount of vanadium within the composites determined by ICP-OES was found to be ca. 7 wt% which is similar to the value obtained for the composite produced without salt (Table SI-1). Thus, the metal nitride content is simply controlled by the amount of initial metal precursor and does not depend on added salt.

Furthermore, elemental analysis reveals an average composition of 70 wt% carbon, 7.5 wt% nitrogen and slightly varying amounts of oxygen with the highest content of 10.5 wt% for the microporous composite (340 mg CsAc, Table SI-1). Oxygen terminated surfaces are in fact beneficial for the desired application: VxOy was reported to be responsible for high capacitances observed for VN in form of a thin oxide layer on top of the nitride,15 and additional oxygen within the carbon increases the capacitance in a similar fashion, but also by improved solvent wetting.25

To confirm the presence of structural nitrogen, X-ray photoelectron spectroscopy (XPS) was performed (Fig. SI-3). N1s spectra show the nature of the nitrogen to be mainly pyridinic (398.6 eV), quaternary-graphitic (400.4 eV) and oxidic nitrogen within graphitic micro domains (402.2 eV), respectively.20,26–27 Heteroatom-doping in nanocarbons is known to create additional pseudocapacitance, enhancing the supercapacitor performance.7,13 As also supported by Raman spectroscopy (Fig. SI-4), the V2p peaks reveal, in addition to signals assigned to VN (513.6 eV), the presence of VxOy (514.9 to 518.9 eV).10,15,28

The composites were then tested as materials for supercapacitor electrodes. Because the synthesis approach offers the possibility to tune the composite porosity simply by the salt amount x, it enables the conduction of a systematic study. Here, water is a very well examined case, but it's naturally restricted operation window prohibits the full utilization of such composites which can in principle also be operated in higher voltage/higher energy density supercapacitors. To get a picture of the specific area requirements of such an electric storage process, samples were therefore tested in the ionic liquid (IL) electrolytes N-butyl-N-methyl-pyrrolidinium bis(trifluoromethylsulfonyl)imide (PYR14TFSI) and N-butyl-N-methyl-pyrrolidinium bis(fluorosulfonyl)imide (PYR14FSI), respectively. This gives the opportunity for the direct comparison of two differently sized counterions and molecular insights into the energy storage process.

As measurements in ILs are known to rely on bigger pores, due to mass transport properties for the larger ions, the three composites synthesized at the highest amount of salt, i.e. VN@N-dC-1000-CsAc-VOCl3, VN@N-dC-1000-CsAc-NH4VO3 and VN@N-dC-1000-ZnAc-NH4VO3, were chosen. One of the best performing commercial carbon (Pica) was also characterized for the sake of comparison. All the experiments were performed at room temperature (Fig. 7–9), and for proof of principle in PYR14TFSI also at 60 °C (Fig. SI-5 and 6), to improve the ionic conductivity and decrease the viscosity of the ionic liquid. The CVs at 10 mV s−1 at RT as well as the scan rate dependent specific capacitances of the three composites and Pica as the reference material in PYR14TFSI are shown in Fig. 7 (Fig. SI-5 at 60 °C).


image file: c4ra03461a-f7.tif
Fig. 7 (a) CVs of VN@N-dC-1000-CsAc-VOCl3 (red), VN@N-dC-1000-CsAc-NH4VO3 (blue), VN@N-dC-1000-ZnAc-NH4VO3 (pink) and Pica (black) from −1.75 to 1.75 V at 10 mV s−1 scan rate. (b) Specific capacitances vs. the scan rate calculated from CVs performed from −1.75 to 1.75 V. Measurements were conducted at room temperature in 3-electrode setup in PYR14TFSI.

The CVs of VN@N-dC-1000-CsAc-VOCl3 and VN@N-dC-1000-CsAc-NH4VO3 show additional humps which are characteristic for pseudocapacitive contributions. This together with high surface areas contributes to very high capacitances, which is in the range of Pica as one of the best commercial carbons. Interestingly, even though bigger pores should increase mass transport and guarantee better access of the IL to the surface, the composite with the largest pore size, i.e. VN@N-dC-1000-ZnAc-NH4VO3, possesses the lowest capacitance. This is probably due to the lower surface area and the absence of humps in VN@N-dC-1000-ZnAc-NH4VO3 indicating a lower accessibility of the nitride nanoparticles by the ionic liquid. This lower accessibility is attributed to the surface effects on the VN particles the surface redox sites of which might be rather quickly blocked by the comparably big IL ions.

A comparable trend is also observed in the galvanostatic charge discharge profiles (Fig. 8 and SI-6).


image file: c4ra03461a-f8.tif
Fig. 8 (a) Galvanostatic charge–discharge profiles of VN@N-dC-1000-CsAc-VOCl3 (red), VN@N-dC-1000-CsAc-NH4VO3 (blue), VN@N-dC-1000-ZnAc2-NH4VO3 (pink)and Pica carbon (black) cycled from 0 V to 3.5 V at 10 mA cm−2. (b) Specific capacitances (Cam) and (c) specific real energy (Ereal) vs. current density calculated from charge–discharge. Measurements were conducted at room temperature in 2-electrode setup in PYR14TFSI.

The deviation from linear curves is caused by polarization effects which, however, can usually be overcomed by engineering optimization, which is out of the scope of the present paper. With regard to the dependence on pore size, a similar trend as in aqueous electrolyte (data not reported here) is also found in the ionic liquid electrolyte. The composites with smaller pore sizes but high surface areas, i.e. VN@N-dC-1000-CsAc-VOCl3 and VN@N-dC-1000-CsAc-NH4VO3, show superior performance with high real specific energy values of about 27 W h kg−1 at low discharge current (5 mA cm−2) in PYR14TFSI (Fig. 8c) as compared to the mesoporous and lower surface area VN@N-dC-1000-ZnAc-NH4VO3. However, in all cases real specific energy (Ereal) values are very high and exceed those obtained in aqueous electrolytes by about 50%, mainly due to the higher operating voltage (data not reported here). We prefer to use the “real energy” values although they are lower than “maximum energy” Emax = 1/2CV2, since it better represents the energy delivered by a real supercapacitor. Moving from the TFSI to the FSI counterion (Fig. 9), a further increase in energy densities can be reached for all composites, now with about 37 W h kg−1 even exceeding the high performance commercial Pica. Interestingly, the energy storage properties of the latter material seem to be less affected by different IL electrolytes, which hints to lower critical steric effects at the redox active sites.


image file: c4ra03461a-f9.tif
Fig. 9 (a) CVs of VN@N-dC-1000-CsAc-VOCl3 (red), VN@N-dC-1000-CsAc-NH4VO3 (blue), VN@N-dC-1000-ZnAc-NH4VO3 (pink) and Pica (black) from −1.75 to 1.75 V at 10 mV s−1 scan rate. (b) Specific capacitances vs. the scan rate calculated from CVs performed from −1.75 to 1.75 V. (c) Galvanostatic charge–discharge profiles of VN@N-dC-1000-CsAc-VOCl3 (red), VN@N-dC-1000-CsAc-NH4VO3 (blue), VN@N-dC-1000-ZnAc2-NH4VO3 (pink) and Pica carbon (black) cycled from 0 V to 3.5 V at 10 mA cm−2. (d) Specific capacitances (Cam) and (e) specific real energy (Ereal) vs. current density calculated from charge–discharge. Measurements were conducted at room temperature in 2-electrode setup in PYR14FSI.

Note that capacitance is charge divided by voltage, i.e. the present high voltage measurements indeed show in comparison to water an increase of both energy density and number of charge sites, which is remarkable considering the much smaller size of aqueous electrolytes. From a physicochemical perspective it is rather illustrative to calculate a formal area per charge for the different situations. For VN@N-dC-1000-CsAc-VOCl3 in the aqueous electrolyte (data not reported here), an average area per charge (in this case a proton or the hydrogensulfate) of 11.7 Å × 11.7 Å was calculated. In the case of the IL electrolytes, the much bigger PYR14 and TFSI gives a formal area per ion of 10.5 Å × 10.5 Å and a change to the FSI counter ion finally of 9.57 Å × 9.57 Å. This is already very close to the molecular dimensions of the solvent ions, and further significant improvements of the energy density in this type of supercapacitor can only be expected when employing much smaller ions or ion mixtures.

The new lead properties to be adjusted on the material side seems to be the pore size being only slightly bigger than the solvent size,6 with possibly no pores being smaller than the solvent, as well as a good electronic and ionic conductivity on the nanoscale, which is conceptually inversely related to the structural size.

Conclusions

The facile one-step synthesis of highly porous carbon/metal nitride nanocomposites was presented by calcining a mixture of an ionic liquid as nitrogen/carbon source, a metal precursor and simple salts, i.e. cesium and zinc acetate, as porogen. This technique was illustrated with the preparation of VN nanoparticles embedded in a nitrogen-doped carbon matrix where the surface area, pore volume, pore size and nanoparticle size can be tuned by the porogen salt amount and salt nature. Additionally, the composite properties can be further adjusted through salt mixtures. The main advantages of the synthesis approach are the formation of a homogeneous starting solution, which can be easily shaped and processed, the simultaneous control of several parameters in just one step and a simple aqueous removal of the porogen after carbonization. This offers the opportunity of tuning the morphologies of the composites from micro- to mesoporous with apparent surface areas up to 2400 m2 g−1. We used this set of widely variable structures, pore sizes, and hybrids to compare the capacitive performance in two ionic liquids within the same materials systems. The as-calculated averaged surface areas per ion reach values already very close to the dimensions of the IL components. For measurements in the ILs, the redox active sites must not reach a too high density, as then firstly fixed counterions block the neighboring redox sites. From that, we can also deduce that a further significant increase of stored energy density in ILs is only to be expected through changing the storage mechanism or moving to much smaller ions. Since the metal precursors and porogen salts can be varied, we expect the present scheme to be a rather general approach also towards other highly porous carbon/metal nitride composites. This enables future designed custom-made synthesis of materials optimizing their performance both in the field of catalysis or energy storage systems.

Acknowledgements

The authors gratefully acknowledge Andreas Holländer from Fraunhofer Institute for Applied Polymer Research (Fh IAP) for XPS measurements. Hendrik Wetzel (Fh IAP) is thanked for ICP OES and Jens Weber (MPI of Colloids and Interfaces) for helpful discussion. R.M. acknowledges financial support from the MINECO (former MICINN) through the Ramón y Cajal Program (RYC-2011-08093) and ENE2012-31516 Project and from European Commission through the RENAISSANCE project (Grant agreement no.: 289347) Marie Curie ITN.

References

  1. Y. Zhang, H. Feng, X. Wu, L. Wang, A. Zhang, T. Xia, H. Dong, X. Li and L. Zhang, Int. J. Hydrogen Energy, 2009, 34, 4889 CrossRef CAS.
  2. G. Wang, L. Zhang and J. Zhang, Chem. Soc. Rev., 2012, 41, 797 RSC.
  3. P. Jampani, A. Manivannan and P. N. Kumta, The Electrochemical Society Interface, 2010, 19, 57 CAS.
  4. Z. Chen, J. Wen, C. Yan, L. Rice, H. Sohn, M. Shen, M. Cai, B. Dunn and Y. Lu, Adv. Energy Mater., 2011, 1, 551 CrossRef CAS.
  5. L. L. Zhang and X. S. Zhao, Chem. Soc. Rev., 2009, 38, 2520 RSC.
  6. J. Chmiola, G. Yushin, Y. Gogotsi, C. Portet, P. Simon and P. L. Taberna, Science, 2006, 313, 1760 CrossRef CAS PubMed.
  7. Y. Zhai, Y. Dou, D. Zhao, P. F. Fulvio, R. T. Mayes and S. Dai, Adv. Mater., 2011, 23, 4828 CrossRef CAS PubMed.
  8. X. Lang, A. Hirata, T. Fujita and M. Chen, Nat. Nanotechnol., 2011, 6, 232 CrossRef CAS PubMed.
  9. H. M. Jeong, J. W. Lee, W. H. Shin, Y. J. Choi, H. J. Shin, J. K. Kang and J. W. Choi, Nano Lett., 2011, 11, 2472 CrossRef CAS PubMed.
  10. C. M. Ghimbeu, E. Raymundo-Pinero, P. Fioux, F. Beguin and C. Vix-Guterl, J. Mater. Chem., 2011, 21, 13268 RSC.
  11. S. D. Perera, B. Patel, N. Nijem, K. Roodenko, O. Seitz, J. P. Ferraris, Y. J. Chabal and K. J. Balkus, Adv. Energy Mater., 2011, 1, 936 CrossRef CAS.
  12. P. A. Mini, A. Balakrishnan, S. V. Nair and K. R. V. Subramanian, Chem. Commun., 2011, 47, 5753 RSC.
  13. L. Zhao, L. Z. Fan, M. Q. Zhou, H. Guan, S. Qiao, M. Antonietti and M. M. Titirici, Adv. Mater., 2010, 22, 5202 CrossRef CAS PubMed.
  14. C. Sassoye, C. Laberty, H. Le Khanh, S. Cassaignon, C. Boissière, M. Antonietti and C. Sanchez, Adv. Funct. Mater., 2009, 19, 1922 CrossRef CAS.
  15. D. Choi, G. E. Blomgren and P. N. Kumta, Adv. Mater., 2006, 18, 1178 CrossRef CAS.
  16. L. Z. Fan, Y. S. Hu, J. Maier, P. Adelhelm, B. Smarsly and M. Antonietti, Adv. Funct. Mater., 2007, 17, 3083 CrossRef CAS.
  17. P. Adelhelm, Y. S. Hu, L. Chuenchom, M. Antonietti, B. M. Smarsly and J. Maier, Adv. Mater., 2007, 19, 4012 CrossRef CAS.
  18. C. Largeot, C. Portet, J. Chmiola, P.-L. Taberna, Y. Gogotsi and P. Simon, J. Am. Chem. Soc., 2008, 130, 2730 CrossRef CAS PubMed.
  19. N. Fechler, T.-P. Fellinger and M. Antonietti, Chem. Mater., 2012, 24, 713 CrossRef CAS.
  20. J. P. Paraknowitsch, J. Zhang, D. Su, A. Thomas and M. Antonietti, Adv. Mater., 2010, 22, 87 CrossRef CAS PubMed.
  21. J. P. Paraknowitsch, A. Thomas and M. Antonietti, J. Mater. Chem., 2010, 20, 6746 RSC.
  22. J. Perez-Ramirez, C. H. Christensen, K. Egeblad, C. H. Christensen and J. C. Groen, Chem. Soc. Rev., 2008, 37, 2530 RSC.
  23. C. N. R. Rao, A. K. Sood, K. S. Subrahmanyam and A. Govindaraj, Angew. Chem., Int. Ed., 2009, 48, 7752 CrossRef CAS PubMed.
  24. J. Lee, J. Kim and T. Hyeon, Adv. Mater., 2006, 18, 2073 CrossRef CAS.
  25. W. Li, F. Zhang, Y. Dou, Z. Wu, H. Liu, X. Qian, D. Gu, Y. Xia, B. Tu and D. Zhao, Adv. Energy Mater., 2011, 1, 382 CrossRef CAS.
  26. Y. Shao, X. Wang, M. Engelhard, C. Wang, S. Dai, J. Liu, Z. Yang and Y. Lin, J. Power Sources, 2010, 195, 4375 CrossRef CAS.
  27. J. P. Paraknowitsch, Y. Zhang and A. Thomas, J. Mater. Chem., 2011, 21, 15537 RSC.
  28. X. Zhou, C. Shang, L. Gu, S. Dong, X. Chen, P. Han, L. Li, J. Yao, Z. Liu, H. Xu, Y. Zhu and G. Cui, ACS Appl. Mater. Interfaces, 2011, 3, 3058 CAS.
  29. S. Vaquero, R. Díaz, M. Anderson, J. Palma and R. Marcilla, Electrochim. Acta, 2012, 86, 241 CrossRef CAS.
  30. M. M. Jaramillo, A. Mendoza, S. Vaquero, M. Anderson, J. Palma and R. Marcilla, RSC Adv., 2012, 2, 8439 RSC.
  31. D. Esposito, S. Kirchhecker and M. Antonietti, Chem. – Eur. J., 2013, 19, 15097 CrossRef CAS.
  32. P. Kuhn, M. Antonietti and A. Thomas, Angew. Chem., Int. Ed., 2008, 47, 3450 CrossRef CAS.
  33. N. Fechler, S.-A. Wohlgemuth, P. Jäker and M. Antonietti, J. Mater. Chem. A, 2013, 1, 6418 Search PubMed.
  34. N. Fechler, T.-P. Fellinger and M. Antonietti, Adv. Mater., 2013, 25, 75 CrossRef CAS.

Footnote

Electronic supplementary information (ESI) available: XRD and calculated particle sizes of VN@N-dC-x-CsAc-VOCl3 in dependence on CsAc concentration x, N2 sorption pore size distributions, compositions of VN@N-dC-x-CsAc-VOCl3, N1s and V2p deconvoluted spectra of VN@N-dC-340-CsAc-VOCl3, Raman-spectrum of VN@N-dC-340-CsAc-VOCl3, ESR of carbons in PYR14FSI and PYR14TFSI, Electrochemical characterization of carbons in PYR14TFSI at 60 °C, EDS of VN@N-dC-0-CsAc-NH4VO3, VN@N-dC-1000-CsAc-NH4VO3. See DOI: 10.1039/c4ra03461a

This journal is © The Royal Society of Chemistry 2014
Click here to see how this site uses Cookies. View our privacy policy here.