Surfactant-free platinum nanocubes with greatly enhanced activity towards methanol/ethanol electrooxidation

Jiale Chena, Junjie Maob, Jingwen Zhaoa, Mengrui Rena and Min Wei*a
aState Key Laboratory of Chemical Resource Engineering, Beijing University of Chemical Technology, Beijing, 100029, China. E-mail: weimin@mail.buct.edu.cn; Fax: +86-10-64425385; Tel: +86-10-64412131
bDepartment of Chemistry, Tsinghua University, Beijing, 100084, China

Received 16th April 2014 , Accepted 19th June 2014

First published on 19th June 2014


Abstract

This communication demonstrates a facile approach to synthesize a platinum (Pt) nanocube catalyst (∼3.5 nm) in the absence of surfactants, which exhibits excellent activity towards alcohol electrooxidation. The clean and unique surface structure was proposed as the main reason accounting for the enhancement of catalytic activities.

During the last decade, tremendous research endeavours have been devoted to high-performance fuel cells, which convert chemical energy directly into electrical energy with high efficiency.1–4 Among several kinds of fuel cells, direct alcohol fuel cells (DAFCs) have recently received considerable attention due to their high volumetric energy density, high efficiency and relatively low operating temperature.5,6 However, the sluggish kinetics of anodic oxidation remains a large obstacle, which should be addressed before such cells can be commercialized.7–9

Platinum, as an anodic electrocatalyst, shows an excellent catalytic activity toward alcohol electrooxidation.10,11 It is well known that the catalytic activity depends not only on the size of the catalyst particle, but also on the structure and/or arrangement of surface atoms. The structure of surface always relates to the exposed crystal facets and defects.12 Hence, the shape-controlled synthesis of platinum nanoparticles is vital to achieve efficient DAFCs. For instance, Pt nanostructured catalysts showed much improved electrocatalytic activities in methanol/ethanol electrooxidation compared with polycrystalline Pt.10,13 However, the common well-defined Pt nanoparticles have a large particle size more than 4 nm.14–16 In addition, among the reported synthesis methods, surface stabilizing/capping agents and/or foreign metal ions are normally incorporated to obtain well-shaped Pt nanoparticles, which may impose a great effect on the catalytic activity of Pt catalysts.13–17 For example, polyvinylpyrrolidone, acting as the capping agent, blocks a significant number of active sites and leads to low activity.18 Therefore, it is still challenging to develop a surfactant-free synthesis of well-defined Pt nanoparticles, which can resolve the problems mentioned above and is expected to achieve higher activities.

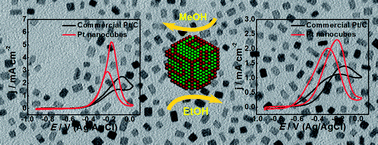
In this communication, we demonstrate a facile strategy to prepare Pt nanocubes with an average size of 3.5 nm in the absence of surfactants and foreign metal ions. The as-prepared Pt nanocubes exhibit a regular shape with exposure of narrow {100} terraces and {110}-type sites. By virtue of the clean and unique surface structure, the Pt nanocube catalyst shows largely enhanced activities toward methanol/ethanol electrooxidation relative to the commercial Pt/C catalyst.

The Pt nanocubes were prepared by reducing platinum(II) 2,4-pentanedionate (Pt(acac)2) with ascorbic acid. In a typical synthesis, a solution of 5 mM Pt(acac)2 and 50 mM ascorbic acid was prepared in 5 mL of N,N-dimethylformamide (DMF). The light yellow solution was transferred into a 12 mL Teflon-lined stainless-steel autoclave. The sealed autoclave was then heated in an oven at 150 °C for 16 h followed by cooling down to room temperature. The product was separated via centrifugation, washed thoroughly with ethanol and finally dispersed into MilliQ-water under ultrasound. Herein, DMF acts as the solvent and the secondary reductant, while ascorbic acid serves as the major reductant to improve product yield and accelerate the nucleation rate of Pt nanocrystals. To determine the appropriate synthesis conditions, various concentrations of ascorbic acid and reaction temperatures were explored (see Table S1 in ESI for the details).

The morphology and size distribution were analyzed on a Hitachi H-800 transmission electron microscope (TEM) and a FEI Tecnai G2 F20 S-Twin high-resolution transmission electron microscope (HRTEM). For microscopy analysis, a portion of product and a little oleylamine was dispersed in ethanol by sonication and then casted onto a carbon-coated Cu-grid. After the evaporation of solvent, the product was remained on the grid. The addition of oleylamine was used to prevent nanoparticles from agglomeration.

The electrochemical measurements were carried out on a computer-controlled electrochemical analyzer (CHI 660D, Chenhua, China) using a standard three-electrode-cell. A Pt spiral wire and KCl-saturated Ag/AgCl electrode were used as the counter and reference electrode, respectively. The glassy carbon electrode (GCE: 3.0 mm in diameter) as working electrode was firstly polished with alumina paste (0.3 and 0.05 μm), then rinsed with Milli-Q water. To prepare the working electrode, 5 μL of an aqueous Pt nanocube ink (1 mg mL−1) and 5 μL of Nafion (0.5 mg mL−1) was dip-coated in turn onto the GCE and then dried at 50 °C. Commercial Pt/C catalyst (20 wt %, Vulcan XC-72R, Alfa) was used as the reference sample. Prior to measurements, the electrolytes of 0.5 M KOH, 0.5 M KOH + 1 M MeOH and 0.5 M KOH + 1 M EtOH were purged with N2 for at least 20 min. A cyclic voltammetry (CV) was performed over above solutions at a sweep rate of 50 mV s−1 at room temperature; a chronoamperometry (CA) was carried out in the methanol/ethanol solutions at −0.30 V to determine the long-term durability. The measured current was always normalized with respect to real surface area of electrode, which was estimated using a conventional procedure based on coulometry of the underpotential deposition of H at Pt surface.19

Fig. 1a shows a representative TEM image of the as-synthesized Pt nanocubes, in which ∼90% of particles exist in a cubic shape with an average size of 3.5 ± 0.5 nm (inset of Fig. 1a). This size is comparable to that of commercial catalysts. The self-assembly of Pt nanocubes is displayed in Fig. 1b. The TEM diffraction pattern (Fig. 1c) shows a face-centered cubic (fcc) structure for the as-prepared Pt nanocubes. The HRTEM image of a single Pt nanocube and the corresponding fast Fourier transform pattern are shown in Fig. 1d and e, respectively. The results verify the single crystal feature of Pt nanocube and the lattice fringe of ∼0.195 nm shown in Fig. 1d corresponds to the d-spacing of Pt{200} plane (Table S2, ESI).20 In addition, the low contrast of the corners for the Pt nanoparticle probably indicates a truncated cubic shape (Fig. 1d). More importantly, these Pt nanocubes possess a high density of low-coordinated atomic steps (indicated by arrows in Fig. 1d). The model of a single Pt nanocube is depicted in the inset of Fig. 1e.


image file: c4ra03446e-f1.tif
Fig. 1 (a) TEM image of the as-prepared Pt nanocubes with an average edge length of 3.5 nm (inset shows its edge length distribution); (b) TEM image of the self-assembly of Pt nanocubes; (c) TEM diffraction pattern of the Pt nanocubes; (d) HRTEM image and (e) the corresponding fast Fourier-transform pattern of a single nanocube (inset shows a model of Pt nanocube. Red and green balls correspond to Pt atoms in steps and terraces, respectively). The scale bars in (a) and (b) represent 20 nm.

Fig. 2 shows the XRD patterns of the as-prepared Pt nanocubes and the commercial Pt/C. In both cases, the reflections corresponding to (111), (200) and (220) characteristic of the fcc structure of Pt are identified.21,22 By using the XRD data and Scherrer equation, the average particle sizes were estimated to be 3.4 and 2.3 nm for Pt nanocubes and commercial Pt/C, respectively. These values are consistent with the information obtained from the TEM images (inset of Fig. 1a and S6).


image file: c4ra03446e-f2.tif
Fig. 2 XRD patterns of the as-prepared Pt nanocubes and the commercial Pt/C.

We have found that both the amount of ascorbic acid and reaction temperature play key roles in the shape-controlled synthesis of platinum nanoparticles. A higher reaction temperature results in a larger particle size; while a higher ascorbic acid concentration is prone to obtain Pt nanoparticles with a smaller size (Fig. S1–S5, ESI). In this work, a moderate dosage of ascorbic acid and relatively low temperature are indispensable to obtain sub-4 nm Pt nanocubes. Especially, Pt nanocubes with the smallest average size (3.5 nm) were obtained with the ascorbic acid concentration of 50 mM at 150 °C. In general, for an fcc metal, the surface energies of low-index crystallographic facets increase in the order: γ(111) < γ(100) < γ(110), corresponding to the reduction of coordination number of surface atoms. According to Wulff construction, the energetically favoured shape would be a truncated octahedron.12 Herein, the ascorbic acid is supposed to accelerate the nucleation rate of Pt nanocrystals and the growth rate along 〈111〉 direction.

To further identify the structural information and electrochemical properties of Pt nanocubes, the cyclic voltammetry (CV) was carried out in 0.5 M KOH aqueous solution. Fig. 3a compares the CV curves of Pt nanocubes and commercial Pt/C. Two pairs of redox peaks are observed in the range from −0.92 V to −0.50 V for both catalysts, which can be attributed to the {110}-type sites and the sites on a {100} ordered domain close to a step/defect, respectively.23 Obviously, the relative intensity of the second redox peak in the case of Pt nanocubes increases greatly compared with the Pt/C one. It thus can be deduced that the as-prepared Pt nanocubes possess abundant {110}-type sites and narrow {100} terraces, in accordance with its cubic shape.10,13 In addition, the unsupported Pt nanocube catalyst shows thinner double layer and smaller hydrogen adsorption–desorption area compared with commercial Pt/C catalyst. The electrochemical surface areas (ECSAs) were determined to be 41.0 m2 g−1 and 64.8 m2 g−1 for the Pt nanocube and the commercial Pt/C catalysts, respectively. These values both are smaller than those of calculated via the particle size distribution (see ESI for the details), which may be due to the existence of some inaccessible surface area at the interface.24 Nevertheless, with no need for a post-treatment, the Pt nanocube catalyst shows a significantly enhanced ECSA value compared with the previous work.15,16


image file: c4ra03446e-f3.tif
Fig. 3 Cyclic voltammograms of Pt nanocubes and commercial Pt/C catalyst in (a) 0.5 M KOH, (b) 0.5 M KOH + 1 M MeOH, (c) 0.5 M KOH + 1 M EtOH at a scan rate of 50 mV s−1 at room temperature, (d) the peak oxidation current densities shown in (b) and (c).

Fig. 3b shows the CV curves of methanol electrooxidation over the two catalysts. The Pt nanocubes lead to a much higher peak current density (5.23 mA cm−2) in positive sweep at −0.181 V than that of the commercial Pt/C (2.51 mA cm−2 at −0.077 V). The significantly enhanced activity can also be observed in the oxidation of ethanol (Fig. 3c): the Pt nanocubes exhibit a larger peak current density (2.31 mA cm−2) in positive sweep at −0.210 V, in comparison with the commercial Pt/C (1.40 mA cm−2 at −0.141 V). In summary, the Pt nanocube catalyst shows 2.1 and 1.6 times higher peak current densities for methanol and ethanol electrooxidation than those of the commercial Pt/C, respectively (Fig. 3d). Moreover, the Pt nanocube catalyst also shows an activity superior to the commercial Pt/C catalyst based on the number of Pt atoms present in each catalyst (Table S3, ESI).

The improved electrocatalytic performance was further demonstrated by the long-term durability. Chronoamperometric curves recorded at −0.30 V for 1200 s show that the Pt nanocubes maintain considerable superiority over the commercial Pt/C catalyst during the entire range (Fig. 4). It is widely accepted that the reversibly adsorbed OH plays a pivotal role in the oxidation of carbonaceous residues of alcohol dissociation. The presence of atomic steps can promote the adsorption of OH and the cleavage of C–C bond.13,25,26 However, the steps are more sensitive to blocking effect by poisoning species than terraces.27 The oxidation current is an outcome of alcohols adsorption–dissociation, OH anion adsorption and further electrochemical reactions.25 Therefore, the distribution of active sites for adsorption and the surface diffusion of adsorbed species would be key factors in the process of alcohol oxidation.19 It is proposed that the clean and unique surface structure, consisting of abundant {110}-type sites and narrow {100} terraces, leads to a faster reaction kinetics via optimizing the two above factors.


image file: c4ra03446e-f4.tif
Fig. 4 Chronoamperometric plots for the electrooxidation of (a) MeOH and (b) EtOH at −0.30 V over Pt nanocubes and commercial Pt/C catalyst, respectively.

Conclusions

We have demonstrated a new facile approach to synthesize Pt nanocubes with average particle size of ∼3.5 nm in the absence of surfactant and post-treatment. The as-synthesized Pt nanocube catalyst with abundant {110}-type sites and narrow {100} terraces shows largely enhanced activity toward methanol/ethanol electrooxidation, in comparison with the commercial Pt/C. It is proposed that the clean and unique surface structure of Pt nanocubes facilitates the adsorption and the surface diffusion of adsorbed species, accounting for the resulting excellent electrocatalytic behavior.

Acknowledgements

This work was supported by the 973 Program (2011CBA00504), the National Natural Science Foundation of China (NSFC), Beijing Natural Science Foundation (2132043) and the Fundamental Research Funds for the Central Universities (ZD 1303). M. Wei particularly appreciates the financial aid from the China National Funds for Distinguished Young Scientists of the NSFC.

Notes and references

  1. E. D. Wachsman and K. T. Lee, Science, 2011, 334, 935 CrossRef CAS PubMed.
  2. Y. Jin, S. Qiao, L. Zhang, Z. P. Xu, S. Smart, J. C. D. Costa and G. Q. Lu, J. Power Sources, 2008, 18, 5664 Search PubMed.
  3. J. J. Mao, Y. X. Liu, Z. Chen, D. S. Wang and Y. D. Li, Chem. Commun., 2014, 50, 4588 RSC.
  4. B. Singh and E. Dempsey, RSC Adv., 2013, 3, 2279 RSC.
  5. M. Z. F. Kamarudin, S. K. Kamarudin, M. S. Masdar and W. R. W. Daud, Int. J. Hydrogen Energy, 2013, 38, 9438 CrossRef CAS PubMed.
  6. M. E. P. Markiewicz and S. H. Bergens, J. Power Sources, 2010, 195, 7196 CrossRef CAS PubMed.
  7. P. A. Russo, M. Ahn, Y. E. Sung and N. Pinna, RSC Adv., 2013, 3, 7001 RSC.
  8. J. Jiang and T. Aulich, J. Power Sources, 2012, 209, 189 CrossRef CAS PubMed.
  9. K. Matsuoka, Y. Iriyama, T. Abe, M. Matsuoka and Z. Ogumi, Electrochim. Acta, 2005, 51, 1085 CrossRef CAS PubMed.
  10. Y. W. Lee, S. B. Han, D. Y. Kim and K. W. Park, Chem. Commun., 2011, 47, 6296 RSC.
  11. P. A. Russo, M. Ahn, Y. E. Sung and N. Pinna, RSC Adv., 2013, 3, 7001 RSC.
  12. J. Chen, B. Lim, E. P. Lee and Y. Xia, Nano Today, 2009, 4, 81 CrossRef CAS PubMed.
  13. S. B. Han, Y. J. Song, J. M. Lee, J. Y. Kim and K. W. Park, Electrochem. Commun., 2008, 10, 1044 CrossRef CAS PubMed.
  14. R. Loukrakpam, P. Chang, J. Luo, B. Fang, D. Mott, I. T. Bae, H. R. Naslund, M. H. Engelhard and C. J. Zhong, Chem. Commun., 2010, 46, 7184 RSC.
  15. C. Kim and H. Lee, Catal. Commun., 2009, 10, 1305 CrossRef CAS PubMed.
  16. C. Susut, G. B. Chapman, G. Samjeske, M. Osawa and Y. Tong, Phys. Chem. Chem. Phys., 2008, 10, 3712 RSC.
  17. H. Lee, S. E. Habas, S. Kweskin, D. Butcher, G. A. Somorjai and P. Yang, Angew. Chem., Int. Ed., 2006, 45, 7824 CrossRef CAS PubMed.
  18. Y. Borodko, S. M. Humphrey, T. D. Tilley, H. Frei and G. A. Somorjai, J. Phys. Chem. C, 2007, 111, 6288 CAS.
  19. A. V. Tripković, K. D. Popović, J. D. Lović, V. M. Jovanović and A. Kowal, J. Electroanal. Chem., 2004, 572, 119 CrossRef PubMed.
  20. B. Zhang, D. Wang, Y. Hou, S. Yang, X. H. Yang, J. H. Zhong, J. Liu, H. F. Wang, P. Hu, H. J. Zhao and H. G. Yang, Sci. Rep., 2013, 3, 1836 Search PubMed.
  21. M. K. Min, J. Cho, K. Cho and H. Kim, Electrochim. Acta, 2000, 45, 4211 CrossRef CAS.
  22. J. Wu, A. Gross and H. Yang, Nano Lett., 2011, 11, 798 CrossRef CAS PubMed.
  23. N. Furuya and M. Shibata, J. Electroanal. Chem., 1999, 467, 85 CrossRef CAS.
  24. I. Esparbé, E. Brillas, F. Centellas, J. A. Garrido, R. M. Rodríguez, C. Arias and P. L. Cabot, J. Power Sources, 2009, 190, 201 CrossRef PubMed.
  25. A. V. Tripković, K. D. Popović and J. D. Lović, Electrochim. Acta, 2001, 46, 3163 CrossRef.
  26. Z. Y. Zhou, S. J. Shang, N. Tian, B. H. Wu, N. F. Zheng, B. B. Xu, C. Chen, H. H. Wang, D. M. Xiang and S. G. Sun, Electrochem. Commun., 2012, 22, 61 CrossRef CAS PubMed.
  27. A. V. Tripković and K. D. Popović, Electrochim. Acta, 1996, 15, 2385 CrossRef.

Footnote

Electronic supplementary information (ESI) available: Experimental details, TEM images and calculations of specific electrochemical surface area. See DOI: 10.1039/c4ra03446e

This journal is © The Royal Society of Chemistry 2014
Click here to see how this site uses Cookies. View our privacy policy here.