Synthesis and characterization of g-C3N4/Ag2CO3 with enhanced visible-light photocatalytic activity for the degradation of organic pollutants
Hui Xu*a,
Yongxiu Songa,
Yanhua Songa,
Jiaxiang Zhua,
Tingting Zhua,
Chengbao Liuc,
Dexiang Zhaoa,
Qi Zhangb and
Huaming Li*a
aSchool of Chemistry and Chemical Engineering, Jiangsu University, Zhenjiang 212013, P. R. China. E-mail: xh@ujs.edu.cn; lihm@ujs.edu.cn; Fax: +86-511-88791708; Tel: +86-511-88791800
bMaterials and Chemical Engineering, Hainan University, Haikou, 5770228, P. R. China
cJiangsu Key Laboratory for Environment Functional Materials, Suzhou University of Science and Technology, Suzhou 215009, P. R. China
First published on 30th June 2014
Abstract
A facile, simple method was developed for the synthesis of g-C3N4/Ag2CO3 at room temperature. The samples were characterized by X-ray photoelectron spectroscopy (XPS), X-ray diffraction (XRD), transmission electron microscopy (TEM), diffuse reflectance spectroscopy (DRS) and Fourier transformed infrared (FT-IR) spectroscopy. The photocatalytic activity of g-C3N4/Ag2CO3 composites for the photo-degradation of methyl orange (MO) was much higher than that of the pure Ag2CO3. The kinetics of the g-C3N4/Ag2CO3 composites were proposed. The electrochemical impedance spectroscopy of g-C3N4/Ag2CO3 composites and a series of radical trapping experiment were also carried out to explore the possible photocatalytic mechanism. The results indicated that the enhanced photocatalytic activity of g-C3N4/Ag2CO3 composites under visible light irradiation was attributed to the formed heterostructure between g-C3N4 and Ag2CO3, which was beneficial to the separation of the photoinduced electron–hole pairs.
1. Introduction
Using catalysts and solar energy in the production of clean energy and the elimination of toxic chemicals, semiconductor photocatalysis has become a most promising technology in the past few years.1–3 Photocatalytic activity of the materials depends on the efficient separation of the photogenerated electrons and holes. While, the critical points for a good semiconductor photocatalysis are the high efficiency separation of photoexcited electron–hole pairs, the decrease of electron–hole recombination and good repeatability of photocatalysts. Therefore, a significantly efficient, stable, inexpensive, easily separable semiconductor material that work well with visible light is a major challenge in this field.4,5Up to now, Ag-based photocatalysts have been identified to be efficient photocatalytic materials under visible light irradiation for the photodegradation of organic pollutants and water splitting for environmentally clean energy in recent years,6–10 such as Ag3PO4,11,12 Ag2O,13 AgSbO3.14 More recently, Ag2CO3 semiconductor has been reported that it shows high-efficient degradation ability for dyes under visible light.15,16 Unfortunately, owing to the photocorrosion,15,17 Ag2CO3 semiconductor also exhibits poor stability. The TiO2, graphene oxide (GO) and the other materials have been used to improve the photocatalytic activity or the stability of the bulk Ag2CO3, such as Ag2CO3/TiO2 (ref. 18) and GO/Ag2CO3,19,20 which exhibit better photocatalytic ability and stability than the bare Ag2CO3. In the precious work, Ag2CO3 particles semiconductor hindered its performance in photocatalytic processes for large scale applications. Therefore, the critical task is the synthesis of stable nano-sized Ag2CO3 particles or the composites.
Recently, graphitic carbon nitride (g-C3N4) has been reported as a metal-free semiconductor that has excellent photocatalytic activity for water splitting and the photo-degradation of organic pollutants under visible light irradiation.4,21,22 g-C3N4 has the characteristics of high thermal and chemical stability, versatile optical, electronic, tribological and versatile catalytic properties.23,24 However, the performance of g-C3N4 materials is limited by its drawbacks, which are the high photogenerated electron–hole recombination rate, lower specific surface area and low quantum efficiency.23,25,26 Therefore, many attempts have been carried out to improve the photocatalytic performance of g-C3N4 materials, such as designing nano-/porous structures,27,28 doping with noble metal or nonmetal elements,29–31 coupling with other semiconductor materials23,32–34 etc. Especially, many bulk semiconductors modified with a few mass g-C3N4 can increase the photocatalytic activity for the degradation of organic pollutants, such as g-C3N4/ZnO,35 g-C3N4/TiO2 (ref. 36) and g-C3N4/Cu2O.37 The enhanced photocatalytic activity is attributed to the heterostructures between g-C3N4 with the bulk semiconductors. This method provide a feasible route to promote the separation efficiency of photogenerated electron–holes pairs and extend the light response of the photocatalyst. Based on the precious work, the photocatalytic performance may be enhanced if g-C3N4 is introduced into Ag2CO3 material. Besides, there are few works focusing on the preparation and photocatalytic properties of g-C3N4/Ag2CO3 composite materials.
In this work, a facile precipitation reaction was reported for the synthesis of Ag2CO3/g-C3N4 photocatalyst at room temperature. The g-C3N4/Ag2CO3 composites were characterized by X-ray powder diffraction (XRD), X-ray photoemission spectroscopy (XPS), transmission electron microscopy (TEM), Fourier transform infrared spectra (FT-IR) and ultraviolet visible diffuse reflectance spectroscopy (DRS). The as-obtained products were used as photocatalysts for the degradation of methyl orange (MO) under visible light irradiation. In particular, the effect of g-C3N4 content in composites has been investigated on the photocatalytic degradation efficiency. Besides, the possible photocatalytic mechanism was proposed based on the present experimental results.
2. Experimental
2.1 Preparation of the g-C3N4/Ag2CO3 photocatalysts
2.2 Characterization of the g-C3N4/Ag2CO3
X-Ray powder diffraction (XRD) was obtained on a Bruker D8 diffractometer using Cu-Kα radiation (λ = 1.5418 Å) in the range of 2θ = 10–80°. X-ray photoemission spectroscopy (XPS) measurements were performed on a VG MultiLab 2000 system with a monochromatic Mg-Kα source operated at 20 kV. Transmission electron microscopy (TEM) were taken with a JEOL-JEM-010 (JELO, Japan) operated at 200 kV. Ultraviolet visible (UV-vis) diffuse reflection spectra were measured using a UV-vis spectrophotometer (Shimadzu UV-2450, Japan) in the range 200–800 nm. BaSO4 was used as the reflectance standard material. Fourier transform infrared (FT-IR) spectra of all the catalysts (KBr pellets) were recorded in KBr pellets with Nicolet Model Nexus 470 FT-IR equipment.2.3 Photocatalytic activity measurement
The photocatalytic activity of the products was compared by measuring the photodegradation of MO under 300 W Xe lamp with a 400 nm cutoff filter. In a typical measurement, 0.040 g photocatalyst was added into 60 mL MO (10 mg L−1) in a Pyrex photocatalytic reactor. Prior to irradiation, the suspensions were magnetically stirred for 60 min in the dark to reach the absorption–desorption equilibrium on the photocatalyst surface. Furthermore, all the experiments were performed at 30 °C under constant stirring. At irradiation time intervals of 20 min, 3 mL solution was collected and centrifuged to remove the photocatalyst particles at a certain time intervals. Then, the filtrates were analyzed by using a Shimadzu UV-2450 spectrophotometer to record the maximum absorption band (MO: 463 nm).3. Results and discussion
3.1 Synthesis process of the g-C3N4/Ag2CO3 composites
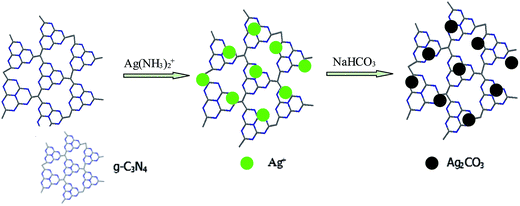
The process for the synthesis of the g-C3N4/Ag2CO3 composites is shown in Fig. 1. Silver salt is mixed with an ultrasonically dispersed g-C3N4 sheet and the Ag+ is bound to the surface of the g-C3N4 attributing to its chemical absorbing. Then, Ag(NH3)2+ is formed after the adding of NH3·H2O. The ion-exchanged reactions between Ag(NH3)2+ and CO32− on the surface of the g-C3N4 sheet occurred and led to the formation of g-C3N4/Ag2CO3 after the addition of NaHCO3 under the constant stirring at the room temperature. Besides, Ag2CO3 particles were deposited on the surface of g-C3N4 sheet and the heterojunction structure between g-C3N4 and Ag2CO3 could be formed.3.2 XRD analysis
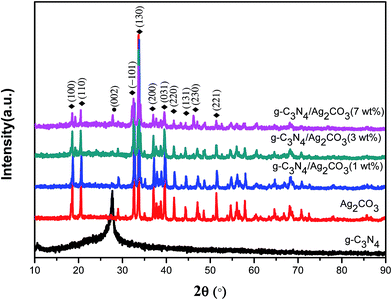
The crystal structure of the g-C3N4/Ag2CO3 composites was characterized by XRD. The XRD patterns of g-C3N4, Ag2CO3 and g-C3N4/Ag2CO3 composites are shown in Fig. 2. The results indicate that the strong diffraction peak at 27.4° which appears in the bulk g-C3N4 and g-C3N4/Ag2CO3 composites is corresponding to the (002) plane of g-C3N4.23,38,39 The Ag2CO3 and g-C3N4/Ag2CO3 composites have similar peaks. Besides, their diffraction peaks (from 15° to 55°) are indexed to (100), (110), (−101), (130), (200), (031), (220), (131), (230) and (221) planes of the monoclinic crystal structure (JCPDS card no. 26-0339). With the increasing amount of g-C3N4, the peak intention of Ag2CO3 in the g-C3N4/Ag2CO3 composites decrease and the peak of g-C3N4 in the g-C3N4/Ag2CO3 composites appears. In order to identify the existence of g-C3N4 in the g-C3N4/Ag2CO3 composites, the samples were also analyzed by the other TEM and FT-IR analyses.3.3 XPS analysis
The XPS were carried out to analyze the oxidation state and the surface chemical composition of the samples. Fig. 3(a) shows the C, N, O and Ag elements in the g-C3N4/Ag2CO3 composites, indicating that the preparation process does not bring any impurities. Two peaks located at 374.0 eV and 368.0 eV are assigned the Ag 3d3/2 and Ag 3d5/2, indicating the existence of Ag+ (Fig.3(b)).20,25,40 The C 1s XPS spectra was shown in Fig. 3(c). High-resolution spectra of C1s at 287.4 eV assigned to the sp2 C![[double bond, length as m-dash]](https://www.rsc.org/images/entities/char_e001.gif) N bond in the s-triazine ring.41 The C peaks at 284.8 was identified as the typical sp2 C–C bonds of CN.42 The C peak at 288.5 eV could be assigned to the overlapped peak of the sp2-hybridized carbon in the trizine rings (N–C
N bond in the s-triazine ring.41 The C peaks at 284.8 was identified as the typical sp2 C–C bonds of CN.42 The C peak at 288.5 eV could be assigned to the overlapped peak of the sp2-hybridized carbon in the trizine rings (N–C![[double bond, length as m-dash]](https://www.rsc.org/images/entities/char_e001.gif) N) and the carbonate ion in Ag2CO3 sample.43 Fig. 3(d) showed the O 1s XPS spectra of the samples. The O1s peak at 530.8 eV was attributed to the O element of silver carbonate.17,40 The XPS spectra of N 1s was shown in Fig. 3(e). The main peaks at around 398.2 eV and 399.6 eV were ascribed to sp2 hybridized aromatic N bonded to carbon atoms in the form of C
N) and the carbonate ion in Ag2CO3 sample.43 Fig. 3(d) showed the O 1s XPS spectra of the samples. The O1s peak at 530.8 eV was attributed to the O element of silver carbonate.17,40 The XPS spectra of N 1s was shown in Fig. 3(e). The main peaks at around 398.2 eV and 399.6 eV were ascribed to sp2 hybridized aromatic N bonded to carbon atoms in the form of C![[double bond, length as m-dash]](https://www.rsc.org/images/entities/char_e001.gif) N–C and the tertiary N bonded to carbon atoms (N–(C)3).41,44 The peak at 400.2 eV could be assigned to C–N–H.45 Based on the above analysis, the g-C3N4 existed in the g-C3N4/Ag2CO3 composites.
N–C and the tertiary N bonded to carbon atoms (N–(C)3).41,44 The peak at 400.2 eV could be assigned to C–N–H.45 Based on the above analysis, the g-C3N4 existed in the g-C3N4/Ag2CO3 composites.
3.4 TEM analysis
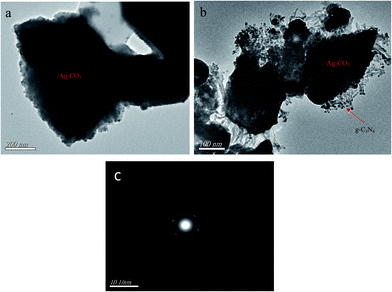
The morphology of the g-C3N4/Ag2CO3 composites were also investigated by TEM. Fig. 4(a and b) shows the TEM images of the Ag2CO3 and g-C3N4/Ag2CO3 samples. Fig. 4(a) shows that there is no distinctive morphological features appearing for the Ag2CO3 particles. Fig. 4(b) shows the Ag2CO3 particles are wrapped by g-C3N4. From the TEM images of Ag2CO3 and g-C3N4/Ag2CO3 samples, it can be seen that g-C3N4 was successfully dispersed on the surface of Ag2CO3 and the heterostructure between g-C3N4 and Ag2CO3 was formed in the g-C3N4/Ag2CO3 composites. The SAED pattern taken from the edge of the microsphere is shown in Fig. 4(c). It could be seen that the Ag2CO3 sample almost exhibits a polycrystalline diffraction pattern.3.5 DRS analysis
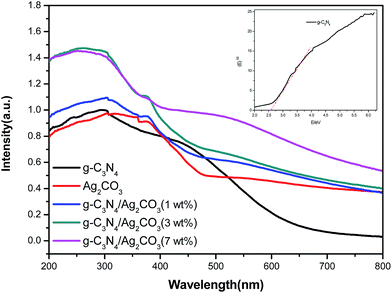
UV-vis diffuse reflectance spectroscopy was carried out to investigate the optical properties of the samples. The results are shown in Fig. 5. The band gap absorption edge of pure g-C3N4 is around 650 nm. The fundamental band gap absorption edge of the pure Ag2CO3 is around 470 nm.20 As shown in Fig. 5, the g-C3N4/Ag2CO3 composites exhibited a mixed absorption property of g-C3N4 and Ag2CO3. Moreover, the absorption intention of the g-C3N4/Ag2CO3 composites increase greatly with the increasing amount of g-C3N4 in the visible light region. Besides, the absorption edge of the g-C3N4/Ag2CO3 composites have a little red shift compared with that of the pure Ag2CO3. Obviously, the introduction of g-C3N4 significantly enhanced the absorption in the visible light region of the g-C3N4/Ag2CO3 composites.3.6 FT-IR analysis
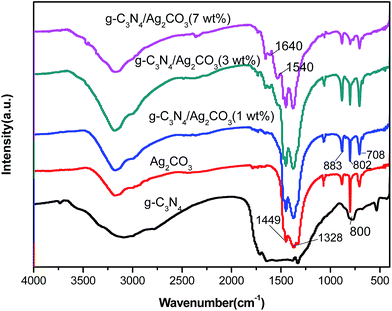
The FT-IR spectra of g-C3N4, pure Ag2CO3 and g-C3N4/Ag2CO3 composites are shown in Fig. 6. In the FT-IR spectra of g-C3N4, the broad band at 3000–3300 cm−1 is due to the stretching modes of terminal NH2 or NH groups at the defect sites of the aromatic ring.38,46 The observed peaks at 1300–1700 cm−1 are attributed to stretching modes of C–N heterocycles.38,46 The peak at 800 cm−1 is related to the characteristic breathing mode of triazine units.25,38,46 In the FT-IR spectra of the pure Ag2CO3 and g-C3N4/Ag2CO3 composites, the characteristic absorption bands of CO32− could be observed at 708 cm−1, 802 cm−1, 883 cm−1, 1328 cm−1 and 1449 cm−1.20 Besides, the peaks at 1640 cm−1 and 1540 cm−1 are found and the peak intention of CO32− decreased in the FT-IR spectra of the g-C3N4/Ag2CO3 (7 wt%) composite. It can be explained by the following reason: the chemical environment of bare Ag2CO3 was changed by the existence of g-C3N4.3.7 Photocatalytic activity
The photocatalytic activity of the pure Ag2CO3 and g-C3N4/Ag2CO3 composites were evaluated via the photodegradation of MO under visible light irradiation (as shown in Fig. 7(a)). Obviously, all the g-C3N4/Ag2CO3 composites show better photodegradation performance than the pure Ag2CO3 and g-C3N4. With the increasing g-C3N4 content, the photocatalytic activity first increases and then decreases. Furthermore, the g-C3N4/Ag2CO3 (3 wt%) composite excites the highest photocatalytic activities for the photodegradation of MO, indicating that the amount of g-C3N4 affects photocatalytic activity of the composite. However, when g-C3N4 content increases above 3 wt%, the photocatalytic efficiency decreases, although it remains higher than that of pure Ag2CO3. More g-C3N4 may reduce the electron transfer efficiency of the photoinduced electrons from Ag2CO3 nanoparticles to g-C3N4 surfaces, so the activity decreased under visible light irradiation.4 Fig. 7(b) shows the temporal evolution of the spectral changes of MO solution (10 mg L−1) mediated by Ag2CO3 under visible light irradiation. Fig. 7(c) shows the temporal evolution of the spectral changes of MO solution (10 mg L−1) mediated by g-C3N4/Ag2CO3 (3 wt%) under visible light irradiation. The absorption peak of MO located at 463 nm decreases rapidly with increasing degradation time, and the MO dye is almost completely degraded after 2 h.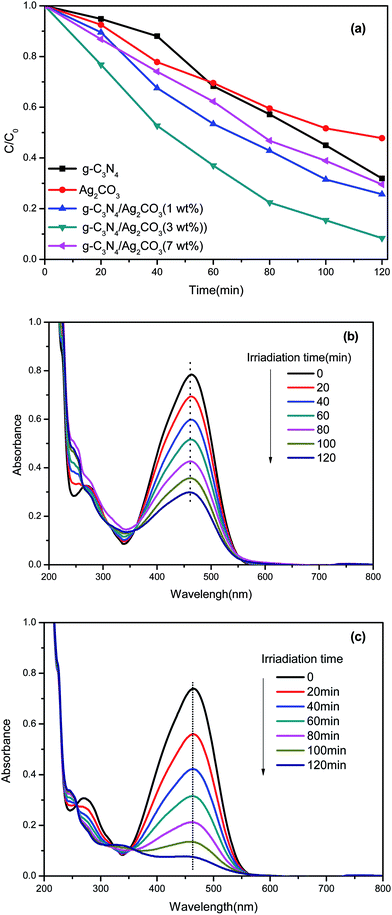 | ||
| Fig. 7 (a) The photocatalytic degradation of MO by the samples, (b and c) absorption spectral changes of MO under visible light irradiation (pure Ag2CO3 and g-C3N4/Ag2CO3 (3 wt%)). | ||
3.8 Kinetics
To investigate the kinetics of MO photocatalytic degradation by the pure Ag2CO3 and the g-C3N4/Ag2CO3 composites, the experimental data were fitted by applying a first order model with a simplified Langmuir–Hinshelwood model47 as expressed by below equation: ln(Ct/C0) = −kt, where k is the apparent reaction rate constant, C0 is the adsorption equilibrium concentration of MO, t is the reaction time, and C is the concentration of MO at the reaction time t. As shown in Fig. 8, it can be seen that the photodegradation rate of all the samples is higher than that of the pure Ag2CO3 under visible light irradiation. With the increasing content of g-C3N4, the photodegradation rate first increased and then decreased. Apparently, the photodegradation rate constant k of g-C3N4/Ag2CO3 composite (3 wt%) was 2.5187 min−1, which was 9.2 times higher than that of the pure Ag2CO3. These results indicated that the introduction of g-C3N4 enhanced the photoinduced electron–holes separation and thus improved the photocatalytic activities of the samples.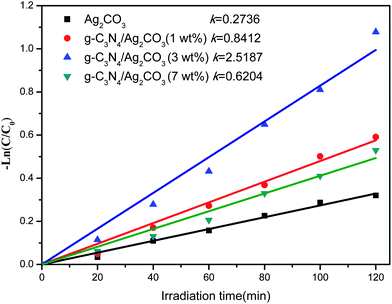 | ||
| Fig. 8 Photocatalytic degradation kinetics of MO by g-C3N4/Ag2CO3 composites under visible light irradiation. | ||
3.9 Electrochemical impedance spectroscopy
To further investigate charge transfer and recombination processes in the g-C3N4/Ag2CO3 composites, electrochemical impedance spectroscopy (EIS) Nyquist plots of the pure Ag2CO3 and g-C3N4/Ag2CO3 (3 wt%) composites has been carried out under the visible light irradiation. As shown in Fig. 9, the smaller arc radius on the EIS Nyquist plot of g-C3N4/Ag2CO3 (3 wt%) could be observed under the visible light irradiation, indicating that a more effective separation of photogenerated electron–hole pairs and a faster interfacial charge transfer had occurred on the surface of g-C3N4/Ag2CO3 (3 wt%) composite.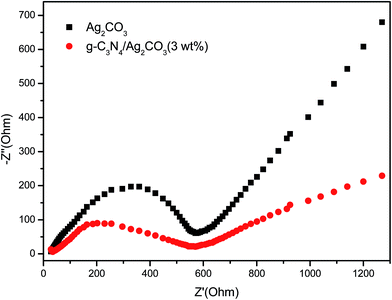 | ||
| Fig. 9 Electrochemical impedance spectroscopy of the pure Ag2CO3 and g-C3N4/Ag2CO3 (3 wt%) in 1 M Na2SO4 aqueous solution under visible light irradiation. | ||
3.10 Possible photocatalytic mechanisms
It is well-known that the key factors to enhance photocatalytic activity are an efficient charge separation and high adsorption. According to the recent reports, g-C3N4 has been proved to be an effective electron transporter and acceptor in the systems of g-C3N4/TiO2, g-C3N4/Ag3PO4 and g-C3N4/CdS. The g-C3N4 sheets could promote charge migration and decrease the recombination of electron–hole pairs of the g-C3N4 based photocatalysts.48,49 Therefore, the reinforced charge migration may be achieved in the g-C3N4/Ag2CO3 composites.The experiments of in situ capture of active pieces were conducted to further investigate the photocatalytic mechanism. In that experiment, EDTA-2Na (ref. 50) served as the holes scavenge and t-BuOH served as the hydroxyl radical scavenger.51 In Fig. 10, the photo-degradation efficiency of MO over g-C3N4/Ag2CO3 (3 wt%) composite was completely inhibited by the holes scavenge, while the photo-degradation efficiency of MO over g-C3N4/Ag2CO3 (3 wt%) composite slightly decreased by the hydroxyl radical scavenger. The results indicated that the radical holes were the main oxidative species in the photocatalytic reaction system.
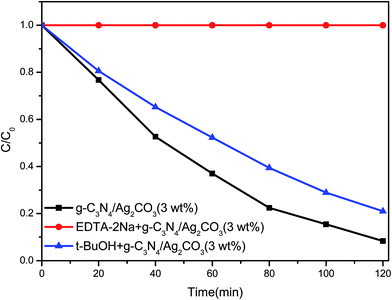 | ||
| Fig. 10 Plots of photogenerated active species trapped in the system of photodegradation of MO by g-C3N4/Ag2CO3 (3 wt%) under visible light irradiation. | ||
To evaluate the stability and reusability of the g-C3N4/Ag2CO3 hybrid photocatalyst, it carried out the additional experiments to degrade MO under visible light cycled for three times. It could be found that the photocatalytic activity of g-C3N4/Ag2CO3 (3 wt%) for MO degradation decreased from 92% to 50% after three cycling runs. The XRD analysis of the samples (three cycling runs) indicated that the intensity of recycled g-C3N4/Ag2CO3 (3 wt%) sample decreased and the diffraction peak at 2θ values 38.1° was assigned to the (111) lattice plane of Ag nanoparticles (Fig. 11).52–54 So during the photocatalytic reaction, the g-C3N4/Ag2CO3 system was transformed to be g-C3N4/Ag/Ag2CO3 system. There are two reason to explain the decreasing photocatalytic activity of the g-C3N4/Ag2CO3 composites after three cycling runs. For one thing, the Ag nanoparticles gradually grew on the Ag2CO3 surface under the photocatalytic reaction process, which could prevent the light absorption of Ag2CO3. For the other thing, the formed Ag0 also become the capture center of the electron and hole.
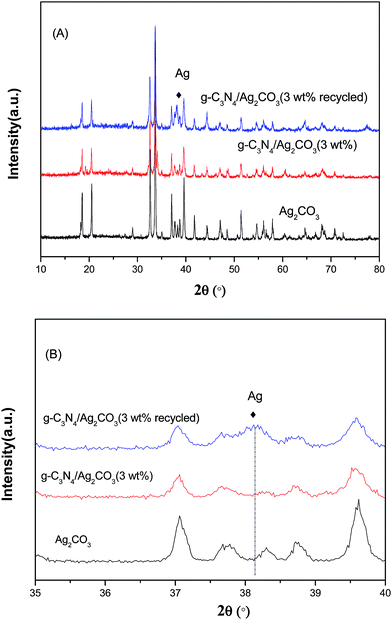 | ||
| Fig. 11 (A) The XRD patterns of used g-C3N4/Ag2CO3 (3 wt%) sample, (B) the XRD pattern at 2θ = 35°–40°. | ||
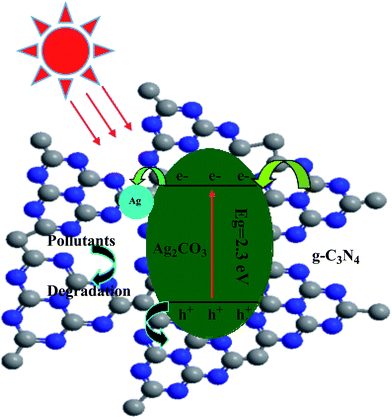
Based on the above analyses and the related literature reports, the schematic mechanism of the enhanced photocatalytic activity of the g-C3N4/Ag2CO3 composites was proposed and shown in Fig. 12. Under visible light irradiation, both g-C3N4 and Ag2CO3 could absorb visible light and were all excited to generate electron and hole pairs. The photoinduced holes on the valence band of Ag2CO3 could move quickly to g-C3N4 because the valence band potential of g-C3N4 (+1.765 V) was more negative than that of Ag2CO3 (+2.673 V). The holes on the surface of g-C3N4 could directly decompose the MO molecules into the intermediates. Meanwhile, the photogenerated electrons of g-C3N4 in the composites could easily transfer to the surface of Ag2CO3. The accumulated electrons would reduce parts of Ag+ to form metal Ag nanoparticles on the surface of Ag2CO3. The matching band potentials between Ag2CO3 and g-C3N4 could effectively suppress the electron–hole recombination and promote the separation efficiency, which greatly promoted the photocatalytic degradation of MO. The similar phenomenon appeared in Ag@AgBr/g-C3N4,54 Ag3VO4/AgBr/Ag.55
4. Conclusions
In summary, the novel g-C3N4/Ag2CO3 composites were synthesized by using a facile, simple method. The obtained g-C3N4/Ag2CO3 composites exhibited much enhanced photocatalytic activity in the degradation of MO in comparing with the pure Ag2CO3 under visible light irradiation. The remarkable catalysis enhancement can be attributed to the effective separation of photogenerated electrons–hole pairs, which was due to the formed heterostructure between the two semiconductors. Besides, with increasing the amount of g-C3N4, the photocatalytic ability increased in a suitable range. Consequently, our work can provide a facile, simple, effective method to synthesis other visible light active photocatalysts for environmental applications as well as water splitting.Acknowledgements
The authors genuinely appreciate the financial support of this work from the National Nature Science Foundation of China (no. 21177050, 21206060 and 21376109), Natural Science Foundation of Jiangsu Province (BK20131207, BK20140533), Postdoctoral Foundation of China (2014M551520, 2013M541619), Doctoral Innovation Fund of Jiangsu Province (CXLX13-651) and Opening Project (no. SJHG1308) of the Jiangsu Key Laboratory for Environment Functional Materials.References
- S. Kumar, T. Surendar, B. Kumar, A. Baruah and V. Shanker, J. Phys. Chem. C, 2013, 117, 26135–26143 CAS.
- X. B. Chen, S. H. Shen, L. J. Guo and S. S. Mao, Chem. Rev., 2010, 110, 6503–6570 CrossRef CAS PubMed.
- F. J. Zhang, F. Z. Xie, S. F. Zhu, J. Liu, J. Zhang, S. F. Mei and W. Zhao, Chem. Eng. News, 2013, 228, 435–441 CAS.
- S. Kumar, T. Surendar, B. Kumar, A. Baruah and V. Shanker, J. Mater. Chem. A, 2013, 1, 5333–5340 CAS.
- J. Fu, B. B. Chang, Y. L. Tian, F. N. Xi and X. P. Dong, J. Mater. Chem. A, 2013, 1, 3083–3090 CAS.
- Z. Y. Ji, X. P. Shen, J. L. Yang, Y. L. Xu, G. X. Zhu and K. M. Chen, Eur. J. Inorg. Chem., 2013, 36, 6119–6125 CrossRef PubMed.
- P. Wang, B. B. Huang, Y. Dai and M. H. Whangbo, Phys. Chem. Chem. Phys., 2012, 14, 9813–9825 RSC.
- H. F. Cheng, B. B. Huang, P. Wang, Z. Y. Wang, Z. Z. Lou, J. P. Wang, X. Y. Qin, X. Y. Zhang and Y. Dai, Chem. Commun., 2011, 47, 7054–7056 RSC.
- J. X. Sun, Y. P. Yua, L. G. Qiu, X. Jiang, A. J. Xie, Y. H. Shen and J. F. Zhu, Dalton Trans., 2012, 41, 6756–6763 RSC.
- W. F. Yao, B. Zhang, C. P. Huang, C. Ma, X. L. Song and Q. J. Xu, J. Mater. Chem., 2012, 22, 4050–4055 RSC.
- V. Shanker and T. Surendar, Mater. Lett., 2014, 123, 172–175 CrossRef PubMed.
- J. H. Liu, X. Li, F. Liu, L. H. Lu, L. Xu, L. W. Liu, W. Chen, L. M. Duan and Z. R. Liu, Catal. Commun., 2014, 46, 138–141 CrossRef CAS PubMed.
- Y. J. Jin, Z. Y. Dai, F. Liu, H. J. Kim, M. P. Tong and Y. L. Hou, Water Res., 2013, 47, 1837–1847 CrossRef CAS PubMed.
- W. J. Liu, X. B. Liu, Y. H. Fu, Q. Q. You, R. K. Huang, P. Liu and Z. H. Li, Appl. Catal., B, 2012, 123–124, 78–83 CAS.
- G. P. Dai, J. G. Yu and G. Liu, J. Phys. Chem. C, 2012, 116, 15519–15524 CAS.
- H. J. Dong, G. Chen, J. X. Sun, C. M. Li, Y. G. Yu and D. H. Chen, Appl. Catal., B, 2013, 134–135, 46–54 CrossRef CAS PubMed.
- C. L. Yu, G. Li, S. Kumar, K. Yang and R. C. Jin, Adv. Mater., 2014, 26, 892–898 CrossRef CAS PubMed.
- Y. Wang, P. H. Ren, C. X. Feng, X. Zheng, Z. G. Wang and D. L. Li, Mater. Lett., 2014, 115, 85–88 CrossRef CAS PubMed.
- C. Dong, K. L. Wu, X. W. Wei, X. Z. Li, L. Liu, T. H. Ding, J. Wang and Y. Ye, Cryst. Eng. Commun., 2014, 16, 730–736 RSC.
- Y. X. Song, J. X. Zhu, H. Xu, C. Wang, Y. G. Xu, H. Y. Ji, K. Wang, Q. Zhang and H. M. Li, J. Alloys Compd., 2014, 592, 258–265 CrossRef CAS PubMed.
- X. C. Wang, K. Maeda, A. Thomas, K. Takanabe, G. Xin, J. M. Carlsson, K. Domen and M. Antonietti, Nat. Mater., 2009, 8, 76 CrossRef CAS PubMed.
- J. Di, J. X. Xia, S. Yin, H. Xu, L. Xu, Y. G. Xu, M. Q. He and H. M. Li, J. Mater. Chem. A, 2014, 2, 5340–5351 CAS.
- Y. M. He, J. Cai, T. T. Li, Y. Wu, Y. M. Yi, M. F. Luo and L. H. Zhao, Ind. Eng. Chem. Res., 2012, 51, 14729–14737 CrossRef CAS.
- C. Liu, L. Q. Jing, L. M. He, Y. B. Luan and C. M. Li, Chem. Commun., 2014, 50, 1999–2001 RSC.
- H. Xu, J. Yan, Y. G. Xu, Y. H. Song, H. M. Li, J. X. Xia, C. J. Huang and H. L. Wan, Appl. Catal., B, 2013, 129, 182–193 CrossRef CAS PubMed.
- S. W. Zhang, J. X. Li, M. Y. Zeng, G. X. Zhao, J. Z. Xu, W. P. Hu and X. K. Wang, ACS Appl. Mater. Interfaces., 2013, 5, 12735–12743 CAS.
- X. C. Wang, K. Maeda, X. F. Chen, K. Takanabe, K. Domen, Y. D. Hou, X. Z. Fu and M. Antonietti, J. Am. Chem. Soc., 2009, 131, 1680–1681 CrossRef CAS PubMed.
- H. J. Yan, Chem. Commun., 2012, 48, 3430–3432 RSC.
- X. C. Wang, X. F. Chen, A. Thomas, X. Z. Fu and M. Antonietti, Adv. Mater., 2009, 21, 1609–1612 CrossRef CAS PubMed.
- S. C. Yan, Z. S. Li and Z. G. Zou, Langmuir, 2010, 26, 3894–3901 CrossRef CAS PubMed.
- G. Liu, P. Niu, C. H. Sun, S. C. Smith, Z. G. Chen, G. Q. Lu and H. M. Cheng, J. Am. Chem. Soc., 2010, 132, 11642–11648 CrossRef CAS PubMed.
- S. C. Yan, S. B. Lv, Z. S. Li and Z. G. Zou, Dalton Trans., 2010, 39, 1488–1491 RSC.
- Y. J. Zhang, T. Mori, L. Niu and J. H. Ye, Energy Environ. Sci., 2011, 4, 4517–4521 CAS.
- T. P. Ang and Y. M. Chan, J. Phys. Chem. C, 2011, 115, 15965–15972 CAS.
- X. F. Li, M. Li, J. H. Yang, X. Y. Li, T. J. Hu, J. S. Wang, Y. R. Sui, X. T. Wu and L. N. Kong, J. Phys. Chem. Sol., 2014, 75, 441–446 CrossRef CAS PubMed.
- C. Miranda, H. Mansilla, J. Yanez, S. Obregon and G. Colon, J. Photochem. Photobiol., A, 2013, 253, 16–21 CrossRef CAS PubMed.
- J. Chen, S. H. Shen, P. H. Guo, M. Wang, P. Wu, X. X. Wang and L. J. Guo, Appl. Catal., B, 2014, 152–153, 335–341 CrossRef CAS PubMed.
- Y. J. Cui, Z. X. Ding, X. Z. Fu and X. C. Wang, Angew. Chem., Int. Ed., 2012, 51, 11814–11818 CrossRef CAS PubMed.
- X. J. Bai, L. Wang, Y. J. Wang, W. Q. Yao and Y. F. Zhu, Appl. Catal., B, 2014, 152–153, 262–270 CrossRef CAS PubMed.
- H. J. Dong, G. Chen, J. X. Sun, C. M. Li, Y. G. Yu and D. H. Chen, Appl. Catal., B, 2013, 134–135, 46–54 CrossRef CAS PubMed.
- J. G. Yu, K. Wang, W. Xiao and B. Cheng, Phys. Chem. Chem. Phys., 2014, 16, 11492–11501 RSC.
- X. J. Wang, W. Y. Yang, F. T. Li, Y. B. Xue, R. H. Liu and Y. J. Hao, Ind. Eng. Chem. Res., 2013, 52, 17140–17150 CrossRef CAS.
- W. D. Zhang, Y. J. Sun, F. Dong, W. Zhang, S. Duan and Q. Zhang, Dalton Trans., 2014 10.1039/c4dt00513a.
- L. Q. Ye, J. Y. Liu, Z. Jiang, T. Y. Peng and L. Zan, Appl. Catal., B, 2013, 142–143, 1–7 CAS.
- Z. Y. Zhang, J. D. Huang, Q. Yuan and B. Dong, Nanoscale, 2014, 26, 9250–9256 RSC.
- Z. L. Xiu, H. Bo, Y. Z. Wu and X. P. Hao, Appl. Surf. Sci., 2014, 289, 394–399 CrossRef CAS PubMed.
- C. S. Turchi and D. F. Ollis, J. Catal., 1990, 112, 178–192 CrossRef.
- S. Kumar, T. Surendar, B. Kumar, A. Baruah and V. Shanker, RSC Adv., 2014, 4, 8132–8137 RSC.
- H. X. Zhao, H. T. Yu, X. Quan, S. Chen, H. M. Zhao and H. Wang, RSC Adv., 2014, 4, 624–628 RSC.
- S. Feng, H. Xu, L. Liu, Y. H. Song, H. M. Li, Y. G. Xu, J. X. Xia, S. Yin and J. Yan, Colloids Surf. A, 2012, 410, 23–30 CrossRef CAS PubMed.
- M. R. Hoffmanm, S. T. Martin, W. Choi and D. W. Bahnemann, Chem. Rev., 1995, 95, 69–96 CrossRef.
- C. D. Tamuly, M. Hazarika, M. Bordoloi and M. R. Das, Mater. Lett., 2013, 102–103, 1–4 CrossRef CAS PubMed.
- B. Z. Tian, R. F. Dong, J. M. Zhang, S. Y. Bao, F. Yang and J. L. Zhang, Appl. Catal., B, 2014, 158–159, 76–84 CrossRef CAS PubMed.
- Y. X. Yang, W. Guo, Y. N. Guo, Y. H. Zhao, X. Yuan and Y. H. Guo, J. Hazard. Mater., 2014, 271, 150–159 CrossRef CAS PubMed.
- Q. Zhu, W. S. Wang, L. Lin, G. Q. Gao, H. L. Guo, H. Du and A. W. Xu, J. Phys. Chem. C, 2013, 117, 5894–5900 CAS.
| This journal is © The Royal Society of Chemistry 2014 |

