DOI:
10.1039/C4RA03422H
(Paper)
RSC Adv., 2014,
4, 28699-28706
Bamboo-derived porous bioadsorbents and their adsorption of Cd(II) from mixed aqueous solutions
Received
15th April 2014
, Accepted 4th June 2014
First published on 5th June 2014
Abstract
Two porous bioadsorbents were successfully prepared from the partial enzymatic hydrolysis of bamboo and subsequent chemical modification with succinic anhydride. We investigated the abilities of the partially enzymatically hydrolyzed bamboo (PEB) and the porous succinylated bamboo (PSB) to adsorb Cd(II) from a solution containing sodium chloride and an amino acid. The partial enzymatic hydrolysis created many pores within the raw bamboo, and both the porous structure and the post-succinylation carboxyl group content were important for high adsorption capacity. The presence of sodium chloride and the amino acid markedly decreased the adsorption capacities of the bioadsorbents. The experimental data could be described perfectly with the Langmuir adsorption isotherm model and pseudo second-order kinetics model. Even in solutions containing sodium chloride and arginine, the maximum Cd(II) adsorption capacities at 303 K were 38.18 and 120.34 mg g−1 for PEB and PSB, respectively.
1. Introduction
With the tremendous increase in the industrial use of heavy metals, seawater pollution has become a severe problem.1 Metallic substances can be ingested by fish and accumulate in vital organs at high levels, as some studies2 have shown. The toxicity of Cd(II) is well known;3 it easily enters the human body through the food chain4 and can cause severe organ damage. The by-products of the marine fish-processing industry are usually hydrolyzed for use in other products.5 Therefore, it is necessary and urgent to remove Cd(II) from marine protein hydrolysate solutions before they are used in downstream production processes.
Several methods6 have been developed to remove heavy metal ions from aqueous solutions, including coagulation, electroflotation, chemical precipitation, and chemical oxidation/reduction. However, these methods are unsuitable for heavy metal removal from marine protein hydrolysate solutions, as they can introduce new pollutants and generate toxic products.
Adsorption is a preferable method for the removal of aqueous heavy metal contaminants,7 and activated carbon8 is a typical effective adsorbent. However, its high cost limits its practical use. Ion exchange resins are another effective type of adsorbent; however, they can generate toxic pollutants during the adsorption process,9 thus restricting their application in the adsorption of heavy metals from marine protein hydrolysate solutions.9 Therefore, from a food safety perspective, there is a demand for green adsorbents. Plant wastes10,11 that can be used as bioadsorbents are readily available. Marine protein hydrolysate solutions may contain high concentrations of amino acids12 and salts.5 Competitive binding between the heavy metal ions, sodium chloride, and amino acids may dramatically affect the adsorption capacities of some adsorbents.13 Thus, there is demand for biosorbents capable of the high-efficiency adsorption of Cd(II) from solutions in the presence of high concentrations of amino acids and salts.
The compact structure of natural biomass reduces the accessibility of metal ions to binding sites and restricts their diffusion into the biomass interior.14 Many efforts have been made to increase the number of accessible functional groups for heavy metal ion binding.15–17 If the compact lignocellulosic cell wall can be partially disrupted to create a porous structure within the material, metal ion adsorption will take place in the biomass both internally and externally, and porous bioadsorbents with high efficiency can be obtained.
The recalcitrance of lignocellulosic biomass toward enzymatic hydrolysis18 makes it difficult to disrupt the structure of the biomass. However, natural biomass can be partially degraded, and holes and cracks can be created within the material during enzymatic hydrolysis,19 increasing the accessible surface area and hydroxyl group content of the biomass. Furthermore, a considerable number of pores will also be formed within the lignocellulosic material. These structural changes will greatly favour the subsequent succinylation reaction as well as the adsorption of Cd(II).
In this study, two porous bioadsorbents were prepared from lignocellulosic biomass by partial enzymatic hydrolysis and chemical modification. The bioadsorbents were used to remove Cd(II) from aqueous solutions in the presence of high concentrations of salts and amino acids – similar to marine protein hydrolysate solutions. The behaviours of Cd(II) toward the adsorbents were investigated under different experimental conditions such as pH, temperature, contact time, adsorbent dose, and sodium chloride and amino acid concentrations. This study provides a new strategy for the preparation of porous bioadsorbents for the highly efficient removal of heavy metal ions from solution.
2. Materials and methods
2.1. Materials
Bamboo (Phyllostachys heterocycla) was collected from a bamboo handicraft factory in AnJi City (Zhejiang province, China). A standard solution of Cd(II) was purchased from the National Analysis Center for Iron and Steel (Beijing, China). Cellulase, with an enzyme activity of 10
000 U g−1, was purchased from Aladdin Reagent Co., Ltd. (Shanghai, China). All other chemicals were of analytical grade and directly used without further purification.
2.2. Preparation of porous bioadsorbent
The collected bamboos were crushed into pieces, boiled in distilled water for 1 h to remove dust and soluble impurities, and then washed with distilled water until the washes were pH 7. The sorbent materials were dried in an air oven for 24 h at 80 °C, and then milled to a powder and sieved (Test Sieve Shakers, Retsch GmbH & Co. KG, Germany) to obtain raw bamboo particles less than 150 μm in size (RB). For the enzymatic hydrolysis, the RB (5 g) was mixed with cellulase (0.2 g, 2 g enzyme per 50 g dry RB) and acetic acid buffer solution (200 mL, pH 5.0) in a conical flask with a stopper, and shaken at 150 rpm for 24 h in a water bath shaker maintained at 50 °C. Thereafter, the samples were placed in boiling water for 15 min to deactivate the enzyme. The mixture was centrifuged at 5000 rpm for 10 min, and the solids were collected and washed sequentially with ethanol (95%), distilled water, and acetone. Then, the solids were dried in an air oven at 80 °C for 48 h, affording the partially enzymatically hydrolyzed bamboo (PEB). PEB (5 g) was treated with succinic anhydride (10 g) in pyridine (120 mL) at reflux for 1 h. The resulting material was thoroughly washed with ethanol and dried in an air oven at 80 °C. This material was treated with saturated NaHCO3 solution for 1 h and washed with double-distilled water and ethanol. Finally, it was dried in an air oven at 80 °C to obtain porous succinylated bamboo (PSB). All the prepared adsorbents were stored in a desiccator. Scanning electron microscopy (SEM) and Fourier transform infrared spectroscopy (FTIR) were used to characterize the adsorbents. FTIR analysis was performed on a Thermo Scientific Nicolet™ 6700 FT-IR spectrometer using KBr pellets, and SEM analysis was performed on a Philips XL30 ESEM after coating the samples with a thin layer of gold.
2.3. Preparation of Cd(II) solution
Aqueous solutions containing different concentrations of Cd(II), arginine, and sodium chloride, termed ‘Cd(II) solution’, were used in the batch experiments.
2.4. Adsorption experiments
Batch experiments were conducted by mixing aqueous Cd(II) solution (50 mL) with dry bioadsorbent (0.05 g). Prior to mixing, the initial pH values (2–7) of the Cd(II) solutions were adjusted with 0.01 M HNO3 or 0.01 M NaOH solution. The adsorbent–Cd(II) mixtures were shaken in a thermostatic shaker bath (GFL 1092 shaker) at 150 rpm at the desired temperatures and contact times. The amount of Cd(II) absorbed on the adsorbent at equilibrium was calculated using eqn (1). |
 | (1) |
where qe is the adsorption capacity of the adsorbent (mg g−1), C0 is the initial concentration of Cd(II) (mg L−1), Ce is the equilibrium Cd(II) concentration in solution (mg L−1), m is the mass of adsorbent used (g), and V is the volume of Cd(II) solution (L).
2.5. Adsorption kinetics
The kinetics experiments were performed at 303 K and pH 6. Bioadsorbent (50 mg) was added to Cd(II) solutions (50 mL, at 5, 10, 20, 50, and 100 mg L−1), and the mixtures were shaken in a thermostatic shaker bath at 150 rpm for 240 min. The adsorption capacity qt of the adsorbents at any time t was calculated using eqn (2). |
 | (2) |
where qt is the adsorption capacity of Cd(II) on the adsorbent (mg g−1) at any time t, and Ct is the Cd(II) concentration in solution (mg L−1) at any time t.
2.6. Adsorption isotherms
To study the effect of temperature, isothermal experiments were conducted at 293 K, 298 K, 303 K, and 308 K. In these experiments, the initial Cd(II) concentration of the solutions was varied from 5 to 100 mg L−1. The effects of arginine (0–50 mg mL−1) and sodium chloride (0–10 mg mL−1) concentrations, adsorbent dose (0.05–0.25 g), and contact time (10–720 min) were also investigated.
At end of the experiments, the solutions were centrifuged at 5000 rpm for 10 min to separate the bioadsorbents. Cd(II) concentrations before and after adsorption in the solutions were determined using an inductively coupled plasma (ICP) spectrometer (Prodigy XP, Teledyne Leeman Labs, USA). All experiments were performed in triplicate, and the average values were used in the data analysis. Data were analyzed using EXCEL 2003 (Microsoft). In the batch experiments, studies were conducted at pH 6.0 and 303 K, with initial concentrations of Cd(II) of 50 mg L−1; arginine, 20 mg mL−1; and sodium chloride, 4 mg mL−1; for a contact time of 240 min, unless otherwise stated.
2.7. Desorption and regeneration studies
Regeneration experiments were conducted by first suspending bioadsorbents (0.05 g) in Cd(II) solution (50 mL, 50 mg mL−1) in the presence of sodium chloride (4 mg mL−1) and arginine (20 mg mL−1). The Cd(II)-loaded bioadsorbents were separated from the solution by centrifugation and washed three times with distilled water (50 mL) to remove unabsorbed Cd(II). Subsequently, the bioadsorbents were mixed with 0.1 M HCl (50 mL) and shaken for 4 h at 303 K. The solution was centrifuged at 5000 rpm for 10 min to collect the solids and washed three times with distilled water. The obtained solids were dried in an air oven at 80 °C and reused for batch desorption studies. The adsorption and desorption experiments were performed over five cycles. The value of desorption efficiency was calculated using eqn (3) as follows. |
 | (3) |
where m1 is the amount of Cd(II) desorbed, and m2 is the amount of Cd(II) adsorbed.
3. Results and discussion
3.1. FTIR Analysis
The FTIR spectra of the adsorbents were obtained over the wavenumber range 500–4000 cm−1 with a resolution of 4 cm−1. Fig. 1a displays the FTIR spectra of (1) Cd(II)-loaded PSB, (2) PSB, (3) Cd(II)-loaded PEB, (4) PEB, and (5) RB. The absorption at 3350 cm−1 represents the stretching vibration20 of hydroxyl groups, and the peak at 2920 cm−1 may be assigned to the stretching of –CH2 groups.21 The peak at 1720 cm−1 can be attributed to –COOH groups – indicating the introduction of the succinyl groups in PSB. The peaks observed at 1590 cm−1 and between 1420 and 1360 cm−1 correspond to the asymmetric and symmetric stretches of carboxylate ions.14 The peaks at 1160 cm−1 belong to the C–O–C groups in the ester and carboxyl groups.14 The band at 1030 cm−1 corresponds to C–O stretching.14 After Cd(II) was adsorbed, the peak intensities at 3350 cm−1 (spectra 1 and 3), 1720 cm−1 (spectrum 1), and between 1590 and 1160 cm−1 (spectrum 1) decrease, indicating that hydroxyl and carboxyl groups are involved in adsorption.
 |
| Fig. 1 Characterization of the adsorbents. (a) FT-IR spectra of the adsorbents, (b–d) SEM images of raw milled bamboo (b, RB), partially enzymatically hydrolyzed bamboo (c, PEB), and porous succinylated bamboo (d, PSB). | |
3.2. Scanning electron microscopy (SEM) analysis
Representative SEM micrographs of RB, PEB, and PSB are given in Fig. 1b–d, respectively. As illustrated in Fig. 1b, RB has a smooth and compact surface. By comparison, significant changes have occurred in the surface structures of PEB and PSB, and many pores and rough surfaces are observed. These results suggest that enzymatic hydrolysis can create a porous structure in the RB. These structural changes will provide more binding sites for Cd(II) loading, allowing adsorption on both the exterior and interior of the bioadsorbent. As a result, the materials will possess high adsorption efficiencies.
3.3. Effect of enzymatic hydrolysis on Cd(II) uptake
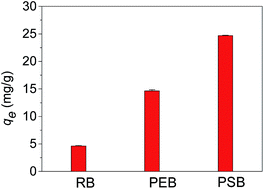
The effect of the enzymatic hydrolysis modification on Cd(II) uptake was investigated; results are shown in Fig. 2. A comparison of Cd(II) adsorption by RB, PEB, and PSB reveals that RB shows a lower qe (4.62 mg g−1) for Cd(II) than PEB (14.64 mg g−1) and PSB (24.69 mg g−1). This indicates that both the carboxyl group content and the porous structure are important for higher qe. In the further batch experiments, PEB and PSB were used as the bioadsorbents.
 |
| Fig. 2 Effect of different adsorbents on the adsorption capacity of Cd(II). Error bars, if not seen, are hidden behind the legend. | |
3.4. Effect of Cd(II) solution pH
Solution pH can affect the availability of active sites for metal-ion adsorption.22 In this group of experiments, the influence of the initial pH of the Cd(II) solution on the metal ion adsorption by PEB and PSB was studied in the pH range 2–7. As illustrated in Fig. 3a, the qe values for PEB and PSB increased rapidly with pH in the range 2–4. Thereafter, qe increased continuously with pH values from 4 to 6, and reached a plateau after pH 6. We also found that the qe of PSB was higher than that of PEB at different pH, and that the adsorption capacities at pH 6 were 24.69 and 14.64 mg g−1 for PSB and PEB, respectively. An explanation for these results may be related to the large quantity of available protons competing with Cd(II) for the adsorption sites when the pH is low (less than 4).23 Moreover, at low pH, the surface maintains a net positive charge that hinders the access of Cd(II) to the surface functional groups because of electrostatic repulsion between positively charged H3O+ and Cd(II).24 As the pH increases, the proton competition and electrostatic repulsion effects decrease, hence, qe improves. It can be concluded that Cd(II) adsorption onto PEB and PSB mainly involves electrostatic interactions between Cd(II) and the binding sites. To maximize the adsorption capacity, pH 6 was selected for the remaining batch experiments.
 |
| Fig. 3 Effect of experimental conditions on Cd(II) adsorption by PEB and PSB. (a) Effect of pH on Cd(II) sorption, (b) effect of adsorbent dose on Cd(II) sorption, (c) effect of sodium chloride concentration on Cd(II) adsorption, (d) effect of arginine concentration on Cd(II) sorption, and (e) effect of contact time on Cd(II) adsorption. Error bars, if not seen, are hidden behind the legend. | |
3.5. Effect of dose
The adsorbent dose influences the extent of metal ion adsorption.25 The effects of PEB and PSB dosage on the adsorption equilibrium capacity for Cd(II) were investigated in the range 0.05–0.25 g; the results are shown in Fig. 3b. The value of qe for PEB decreases from 14.64 to 3.58 mg g−1 as the dose increases from 0.05 to 0.25 g. A similar trend is observed in the qe of PSB, which decreases from 24.69 to 6.11 mg g−1. This phenomenon is likely the result of adsorption sites remaining unsaturated during the adsorption process.26 Another reason may be aggregation resulting from high adsorbent concentration. Such aggregation would lead to a decrease in the total surface area of the sorbent.27
3.6. Effect of sodium chloride
Normally, marine protein hydrolysates contain high concentrations of sodium chloride.5 The resulting high ionic strength in the solution may significantly affect metal-ion adsorption on the bioadsorbent.28 Hence, the effects of sodium chloride on Cd(II) adsorption by PEB and PSB were examined with salt concentrations ranging from 0 to 10 mg mL−1. The initial Cd(II) and arginine concentrations used in this study were 50 and 20 mg mL−1, respectively. As can be observed from Fig. 3c, sodium chloride content has a remarkable effect on the Cd(II) adsorption by PEB and PSB: as the salt concentration increases from 0 to 2 mg mL−1, the adsorption capacity of PEB decreases from 27.63 to 18.71 mg g−1, and that of PSB decreases from 40.60 to 29.28 mg g−1. A slight salt effect on Cd(II) adsorption by PEB and PSB was observed with sodium chloride concentrations from 2 to 10 mg mL−1. Therefore, it can be concluded that sodium chloride affects the absorption performance of PEB and PSB significantly. This can be explained by the formation of outer-sphere complexes due to Na+, which will compete with the absorption sites for Cd(II).28
3.7. Effect of an amino acid
Marine protein hydrolysates contain abundant amounts of amino acids,29 which may affect the adsorption of Cd(II). In these experiments, we investigated the effect of amino acids on the adsorption process using arginine as a model amino acid at concentrations of 0–50 mg mL−1. The initial Cd(II) and sodium chloride concentrations used were 50 and 4 mg mL−1, respectively. As illustrated in Fig. 3d, the equilibrium adsorption capacity of PEB decreases from 16.25 to 6.93 mg g−1 with increasing arginine concentrations from 0 to 50 mg mL−1. In contrast, a significant effect on Cd(II) adsorption by PSB was only evident with an arginine concentration of 0–10 mg mL−1. Thereafter, no obvious variation in qe was observed as the arginine concentration increased from 10 to 50 mg mL−1, and a plateau value (approximately 23.06 mg g−1) was observed after the concentration reached 10 mg mL−1. These results indicate that amino acids affect the adsorption of Cd(II) on PEB and PSB to a large extent. This adsorption behaviour suggests that interactions occur between the amino acids and adsorbents, including competitive adsorption, which would therefore decrease the Cd(II) adsorption capacity.
3.8. Effect of contact time
The effect of contact time (10–720 min) on the qe of the two adsorbents for Cd(II) is shown in Fig. 3e. The Cd(II) adsorption on PEB and PSB increases continuously with increasing contact time from 10 to 120 min. Within the first 120 min, the qe increases from 8.15–14.31 mg g−1 for PEB and 18.31–23.35 mg g−1 for PSB. Thereafter, qe increases slowly for contact times between 120 and 240 min. The rapid adsorption behaviour up to 120 min may reflect the abundance of vacant sites initially available for Cd(II) loading.30 Therefore, with increasing contact time, most of the functional groups in PEB and PSB participate in Cd(II) adsorption, and then reach equilibrium. As illustrated in Fig. 3e, qe does not noticeably change after 240 min, which appears to be sufficient time to ensure that equilibrium is attained. Based on the data obtained in these batch experiments, 240 min was selected as the equilibrium time and used to study the kinetics of Cd(II) adsorption.
3.9. Adsorption kinetics studies
Adsorption kinetics is very important for the design of adsorption systems. Therefore, the kinetics of Cd(II) adsorption by PEB and PSB at different initial Cd(II) concentrations were fitted by applying pseudo first-order and pseudo second-order models, shown below as eqn (4) and (5), respectively. |
ln(qe − qt) = ln qe − k1t
| (4) |
|
 | (5) |
Here, k1 is the pseudo first-order rate constant (min−1), and k2 is the pseudo second-order rate constant of adsorption (g mg−1 min−1). The values of ln(qe − qt) are calculated from the experimental kinetics data. The models were examined by linear plots of ln(qe − qt) versus t (Fig. 4a and b) and (t/q) versus t (Fig. 4c and d). The models' characteristic parameters and regression coefficients are listed in Table 1. Comparison of the two kinetic models yielded relatively high correlation coefficients (R2 > 0.99) for the pseudo second-order model at different initial Cd(II) concentrations. The experimental qe values agreed with the qe values calculated from the linear plots. This suggests that the experimental data fits the pseudo second-order model better than the pseudo first-order model.
 |
| Fig. 4 Pseudo first-order and pseudo second-order plots for the adsorption of Cd(II) on PEB and PSB at different initial Cd(II) concentrations, respectively. (a) Pseudo first-order plots for the adsorption Cd(II) on PEB, (b) pseudo first-order plots for the adsorption Cd(II) on PSB, (c) pseudo second-order plots for the adsorption Cd(II) on PEB, and (d) pseudo second-order plots for the adsorption Cd(II) on PSB. | |
Table 1 The adsorption kinetic model parameters for Cd(II) adsorption on PEB and PSB at different initial Cd(II) concentrations
Model |
PEB |
PSB |
C0 (mg L−1) |
C0 (mg L−1) |
5 |
10 |
20 |
50 |
100 |
5 |
10 |
20 |
50 |
100 |
Experimental. Calculated. |
Pseudo-first order model |
qe,expa |
2.18 |
3.84 |
7.82 |
16.23 |
23.48 |
2.85 |
5.67 |
11.58 |
26.59 |
45.85 |
qe,calb |
0.93 |
0.88 |
4.44 |
5.84 |
9.47 |
0.99 |
0.95 |
4.97 |
6.95 |
8.49 |
k1 |
0.00602 |
0.00667 |
0.00656 |
0.0066 |
0.00724 |
0.00855 |
0.00471 |
0.00618 |
0.00583 |
0.00551 |
R2 |
0.95019 |
0.97069 |
0.97411 |
0.83511 |
0.98685 |
0.94357 |
0.85728 |
0.97559 |
0.946 |
0.91553 |
|
Pseudo-second order |
qe,calb |
2.02 |
3.71 |
7.37 |
15.34 |
22.58 |
2.80 |
5.37 |
10.79 |
25.18 |
43.80 |
k2 |
0.03792 |
0.04722 |
0.00586 |
0.00636 |
0.00346 |
2.80426 |
5.36913 |
10.79797 |
25.17623 |
43.80201 |
R2 |
0.99939 |
0.99974 |
0.99737 |
0.99945 |
0.99899 |
0.99957 |
0.99997 |
0.99811 |
0.99972 |
0.99994 |
3.10. Adsorption isotherm studies
The equilibrium adsorption isotherms are important in determining the mechanism of adsorption. The Langmuir and Freundlich isotherm models were used to describe the adsorption process, and the corresponding adsorption isotherms were plotted. The Langmuir and Freundlich models are expressed as eqn (6) and (7), respectively. |
 | (6) |
|
 | (7) |
where qmax is the maximum adsorption capacity. In eqn (6), b is the Langmuir constant, which can be determined from the intercept of the linear plot of Ce/qe versus Ce (Fig. 5a and b). In the Freundlich equation, Kf and 1/n are empirical constants that can be determined from the intercept and slope of the linear plot of ln
qe versus ln
Ce (shown in Fig. 5c and d).
 |
| Fig. 5 Langmuir and Freundlich plots for the adsorption of Cd(II) on PEB and PSB at different temperatures. (a) Langmuir plots for the adsorption of Cd(II) on PEB, (b) Langmuir plots for the adsorption of Cd(II) on PSB, (c) Freundlich plots for the adsorption of Cd(II) on PEB, and (d) Freundlich plots for the adsorption of Cd(II) on PSB. | |
Based on eqn (6) and (7), the values of the isotherm constants were obtained and are presented in Table 2. The best-fit isotherms for the adsorption of Cd(II) on PEB and PSB are in the order Langmuir (R2 = 0.99759–0.99961) and Freundlich (R2 = 0.99491–0.9988). This suggests that the equilibrium data fits the Langmuir isotherm model better than the Freundlich model. Normally, the Langmuir isotherm assumes that the adsorption process only occurs at specific homogenous sites within the adsorbent surface, with a uniform distribution of energy levels. It can be concluded that the adsorption process is monolayer in nature, based on the Langmuir isotherm.31
Table 2 Isotherm parameters for the adsorption of Cd(II) on PEB and PSB at different temperatures
model |
PEB |
PSB |
T (K) |
T (K) |
293 |
298 |
303 |
308 |
293 |
298 |
303 |
308 |
Maximum adsorption capacity. |
Langmuir isotherm |
qmaxa (mg g−1) |
35.49 |
36.96 |
38.18 |
42.54 |
111.73 |
110.86 |
120.34 |
131.41 |
b (L−1/mg) |
0.01532 |
0.01636 |
0.0169 |
0.01648 |
0.00958 |
0.01035 |
0.00993 |
0.00971 |
RL |
0.3949 |
0.3794 |
0.3717 |
0.3776 |
0.51072 |
0.4914 |
0.501756 |
0.50736 |
R2 |
0.99912 |
0.99913 |
0.99837 |
0.99904 |
0.9992 |
0.99909 |
0.99759 |
0.99961 |
|
Freundlich isotherm |
Kf (mg1−1/n L1/n g−1) |
0.7537 |
0.8252 |
0.8874 |
0.9611 |
1.2486 |
1.3377 |
1.3662 |
1.4495 |
n |
1.3072 |
1.3087 |
1.3189 |
1.3128 |
1.1524 |
1.1588 |
1.1443 |
1.1382 |
R2 |
0.99637 |
0.99491 |
0.99561 |
0.99675 |
0.9988 |
0.99858 |
0.99828 |
0.99863 |
RL is a dimensionless constant, referred to as a separation factor or equilibrium parameter, which can be used to describe the essential feature of the Langmuir isotherm. It is expressed as RL = 1/(1 + bC0), where C0 is the highest initial Cd(II) concentration. It is possible to predict whether an adsorption system is favourable by its RL value.23 As can be seen from Table 2, the RL values for PEB and PSB are all between 0 and 1 at different temperatures, indicating that the adsorption of Cd(II) on PEB and PSB is favourable.
3.11. Effect of temperature
The effect of temperature on Cd(II) adsorption by PEB and PSB was studied at four temperatures (293, 298, 303, and 308 K) and different initial Cd(II) concentrations (5–100 mg L−1). The thermodynamic parameters can be calculated using eqn (8). |
 | (8) |
where R is the universal gas constant (8.314 J mol K−1) and T is the absolute temperature (K). Changes in enthalpy (ΔH) and entropy (ΔS) can be calculated from the slope and intercept of the linear plot of ln(qe/Ce) versus 1/T. The change in Gibbs free energy (ΔG), ΔH, and ΔS are given in Tables 3 and 4 The negative ΔG values confirm the feasibility and spontaneous nature of the absorption of Cd(II) by PEB and PSB. Moreover, the decrease in the values of ΔG with increasing temperature suggests that adsorption is more favourable at higher temperatures.32 The positive values of ΔH indicate the endothermic nature of the process, and the positive ΔS values indicate an increase in randomness at the solid/solution interface during Cd(II) adsorption on PEB and PSB. Normally, the ΔG values for physisorption are between −20 and 0 kJ mol−1 and between −40 and −80 kJ mol−1 for chemisorption.23 In this study, the ΔG values are within the range of physisorption, which indicates that Cd(II) adsorption by PEB and PSB is dominated by a physisorption mechanism.
Table 3 Thermodynamic parameters for the adsorption of Cd(II) on PEB
Cd(II) concentration (mg L−1) |
ΔG (kJ mol−1) at temperature (K) |
ΔH (kJ mol−1) |
ΔS (J mol−1 K−1) |
293 |
298 |
303 |
308 |
5 |
−15.2791 |
−15.7455 |
−16.2376 |
−16.74108 |
13.3210 |
97.5103 |
10 |
−15.1255 |
−15.6204 |
−16.0171 |
−16.5518 |
12.2759 |
93.4639 |
20 |
−14.8147 |
−15.3542 |
−15.7308 |
−16.23805 |
12.4228 |
92.9739 |
50 |
−14.2772 |
−14.7902 |
−15.1911 |
−15.6174 |
11.6556 |
88.5419 |
100 |
−13.3958 |
−13.8029 |
−14.1717 |
−14.7151 |
11.9465 |
86.3581 |
Table 4 Thermodynamic parameters for the adsorption of Cd(II) adsorption on PSB
Cd(II) concentration (mg L−1) |
ΔG (kJ mol−1) at temperature (K) |
ΔH (kJ mol−1) |
ΔS (J mol−1 K−1) |
293 |
298 |
303 |
308 |
5 |
−16.9607 |
−17.4269 |
−17.8021 |
−18.2674 |
8.2177 |
85.9059 |
10 |
−16.90323 |
−17.3234 |
−17.7191 |
−18.2124 |
8.4322 |
86.3710 |
20 |
−16.7813 |
−17.2509 |
−17.6260 |
−18.1019 |
8.6399 |
86.7307 |
50 |
−16.4116 |
−16.8450 |
−17.3516 |
−17.8018 |
11.0189 |
93.51971 |
100 |
−15.9192 |
−16.3053 |
−16.7169 |
−17.2305 |
9.5408 |
86.7438 |
3.12. Regeneration studies
From an economic perspective, adsorbent reuse is desirable. The adsorption capacity and desorption efficiency of PEB and PSB were found to decrease gradually with increasing adsorption–desorption cycle number (Fig. 6). After five cycles, the desorption efficiencies of PEB and PSB were more than 73.69% and 82.09%, respectively, and no noticeable loss in the adsorption capacity was evident during the process. These results suggest that PEB and PSB can be reused without significant changes in adsorption performance.
 |
| Fig. 6 Adsorption–desorption studies of Cd(II) adsorption by PEB and PSB. Error bars, if not seen, are hidden behind the legend. | |
4. Conclusion
These porous bioadsorbents exhibited high efficiency for Cd(II) binding, although the sodium chloride and arginine content had significant effects on adsorption. The pseudo second-order kinetics model is a good fit for Cd(II) adsorption on PEB and PSB, and the equilibrium data can be fitted well to the Langmuir isotherm model. The adsorption isotherms and thermodynamic parameters suggest the favourability of Cd(II) adsorption on PEB and PSB. Regeneration studies show that PEB and PSB can be recovered for reuse, and high desorption efficiencies can be obtained over five adsorption–desorption cycles.
Acknowledgements
The authors are grateful for the support of the Zhejiang Provincial Natural Science Foundation of China (Z3110487), China Spark Program (2012GA700212), Funds of Science and Technology Department of Zhejiang Province, China (2013C24028), and Funds of Zhoushan Municipal Bureau of China (2013C41006). The authors declare that there are no conflicts of interest.
Notes and references
- D. Manivannan and V. M. Biju, Water Sci. Technol., 2011, 64, 803 CrossRef CAS.
- A. L. Maulvault, C. Cardoso, M. L. Nunes and A. Marques, Food Control, 2013, 32, 518 CrossRef CAS PubMed.
- H. Cao, J. Chen, J. Zhang, H. Zhang, L. Qiao and Y. Men, J. Environ. Sci., 2010, 22, 1792 CrossRef CAS.
- G. W. Bryan and W. J. Langston, Environ. Pollut., 1992, 76, 89 CrossRef CAS.
- J. S. Kim, F. Shahidi and M. S. Heu, J. Agric. Food Chem., 2003, 51, 784 CrossRef CAS PubMed.
- C. Namasivayam and K. Ranganathan, Environ. Technol., 1995, 16, 851 CAS.
- M. Kilic, C. Kirbiyik, O. Cepeliogullar and A. E. Putun, Appl. Surf. Sci., 2013, 283, 856 CrossRef CAS PubMed.
- S. F. Lo, S. Y. Wang, M. J. Tsai and L. D. Lin, Chem. Eng. Res. Des., 2012, 90, 1397 CrossRef CAS PubMed.
- H. L. Wang, W. J. Dong and Y. L. Liu, Chin. J. Pharm., 2010, 41, 216 CAS.
- M. Xu, P. Yin, X. Liu, Q. Tang, R. Qu and Q. Xu, Bioresour. Technol., 2013, 149, 420 CrossRef CAS PubMed.
- D. W. O'Connell, C. Birkinshaw and T. F. O'Dwyer, Bioresour. Technol., 2008, 99, 6709 CrossRef PubMed.
- M. Chalamaiah, B. Dinesh kumar, R. Hemalatha and T. Jyothirmayi, Food Chem., 2012, 135, 3020 CrossRef CAS PubMed.
- X. K. OuYang, L. P. Yang and Z. S. Wen, Bioresources, 2014, 9, 2446 Search PubMed.
- L. X. Zhong, X. W. Peng, D. Yang and R. C. Sun, J. Agric. Food Chem., 2012, 60, 5621 CrossRef CAS PubMed.
- W. S. Wan Ngah and M. A. K. M. Hanafiah, Bioresour. Technol., 2008, 99, 3935 CrossRef CAS PubMed.
- L. V. A. Gurgel, O. K. Júnior, R. P. D. F. Gil and L. F. Gil, Bioresour. Technol., 2008, 99, 3077 CrossRef CAS PubMed.
- O. Karnitz Jr, L. V. A. Gurgel, J. C. P. de Melo, V. R. Botaro, T. M. S. Melo, R. P. de Freitas Gil and L. F. Gil, Bioresour. Technol., 2007, 98, 1291 CrossRef PubMed.
- R. Wahlstrom, S. Rovio and A. Suurnakki, RSC Adv., 2012, 2, 4472–4480 RSC.
- L. Han, J. Feng, S. Zhang, Z. Ma, Y. Wang and X. Zhang, Braz. J. Microbiol., 2012, 43, 53 CrossRef CAS PubMed.
- Z. Li, X. Tang, Y. Chen, L. Wei and Y. Wang, J. Hazard. Mater., 2009, 169, 386 CrossRef CAS PubMed.
- Q. Tang, X. Tang, M. Hu, Z. Li, Y. Chen and P. Lou, J. Hazard. Mater., 2010, 179, 95 CrossRef CAS PubMed.
- N. Friis and P. Myerskeith, Biotechnol. Bioeng., 1986, 28, 21 CrossRef CAS PubMed.
- H. Chen, G. Dai, J. Zhao, A. Zhong, J. Wu and H. Yan, J. Hazard. Mater., 2010, 177, 228 CrossRef CAS PubMed.
- K. S. Low, C. K. Lee and A. C. Leo, Bioresour. Technol., 1995, 51, 227 CrossRef CAS.
- F. Y. Wang, H. Wang and J. W. Ma, J. Hazard. Mater., 2010, 177, 300 CrossRef CAS PubMed.
- B. Yu, Y. Zhang, A. Shukla, S. S. Shukla and K. L. Dorris, J. Hazard. Mater., 2000, 80, 33 CrossRef CAS.
- M. M. Rao, G. P. C. Rao, K. Seshaiah, N. V. Choudary and M. C. Wang, Waste Manage., 2008, 28, 849 CrossRef CAS PubMed.
- X. Y. Guo, S. Z. Zhang and X. Q. Shan, J. Hazard. Mater., 2008, 151, 134 CrossRef CAS PubMed.
- Q. Shen, R. Guo, Z. Dai and Y. Zhang, J. Agric. Food Chem., 2012, 60, 5192 CrossRef CAS PubMed.
- J. Acharya, J. N. Sahu, C. R. Mohanty and B. C. Meikap, Chem. Eng. J., 2009, 149, 249 CrossRef CAS PubMed.
- T. W. Weber and R. K. Chakravorti, AIChE J., 1974, 20, 228 CrossRef CAS.
- S. A. Ali, O. C. S. Al Hamouz and N. M. Hassan, J. Hazard. Mater., 2013, 248–249, 47 CrossRef CAS PubMed.
|
This journal is © The Royal Society of Chemistry 2014 |
Click here to see how this site uses Cookies. View our privacy policy here.