Wojciech Plazinski*a and
Mateusz Drachb
aInstitute of Catalysis and Surface Chemistry, Polish Academy of Sciences, ul. Niezapominajek 8, 30-239 Cracow, Poland. E-mail: wojtek_plazinski@o2.pl; wojtek@vega.umcs.lublin.pl; Fax: +48 815375685; Tel: +48 815375685
bDepartment of Theoretical Chemistry, Faculty of Chemistry, UMCS, pl. M. Curie-Sklodowskiej 3, 20-031 Lublin, Poland
First published on 28th May 2014
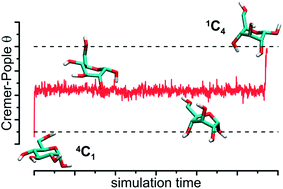
The ring conformation of the hexopyranose-based carbohydrate molecules is one of the central issues in glycobiology. We report the results of the transition path sampling simulations aimed at the detailed description of the dynamic features of these conformational changes. We focused on the α-D- and β-D-glucopyranose molecules (GlcA and GlcB, respectively), treated as model systems. A large number of unbiased dynamic trajectories leading from the 4C1 conformation to the 1C4 one has been collected and subjected to analysis. The results allowed for: (i) identifying the distinct local minima of the free energy corresponding to the states intermediate for the 4C1 → 1C4 transitions; (ii) assigning the time-characteristics to these transitions and intermediate states; (iii) searching for the optimal reaction coordinate based on the Peters–Trout approach (likelihood maximization, LM). Additionally, the structures corresponding to the 4C1 → 1C4 transition states (TS) have been found; surprisingly, in the case of GlcA, the water dynamics has very little influence on the probability of the TS evolution either to 4C1 or to 1C4. The differing result obtained for GlcB (large influence of water dynamics on the behavior of TS as well as the poor applicability of the LM approach for calculation of the reaction coordinate) speaks for slightly different mechanisms of the 4C1 → 1C4 puckering in the molecules of GlcB and GlcA.
The ring conformations of the hexopyranose-based carbohydrates which differ from the standard 4C1 may be significantly populated in a number of systems, including: (i) specific hexopyranoses (the 1C4 conformation is even predominant in the case of e.g. α-D-altrose or α-L-guluronic acid);2–4 (ii) sterically crowded hexopyranose derivatives;5–19 (iii) hexopyranoses in AFM-stretched poly- or oligosaccharides,20–28 cyclodextrins;29–31 (iv) hexopyranoses in the complex with proteins.32–36 Moreover, even if the non-4C1 confomers are non-predominant they still can influence the biological features of carbohydrate-containing systems;37 furthermore, as it has recently been shown, the hydrodynamic properties of carbohydrate polymers are significantly affected by ring puckering.37
The main aim of the computational study reported here was to provide the insight into carbohydrate ring puckering in the hexopyranose molecules at the molecular level. Contrary to most of the theoretical studies,38–44 our efforts were focused not on recovering the free energy landscapes associated with the ring conformers but on producing and analyzing the set of transition paths connecting the two chair conformers. The most straightforward approach that can be proposed for the former aim of the study is the application of the plain molecular dynamics (MD) and subsequent analysis of the resulting trajectories. Such method appeared to be applicable in the case of e.g. N-acetyl-D-glucosamine (GlcNAc) or iduronic acid and their derivatives1,45 when the GPU-based hardware was used for MD simulations. However, the free energy barriers reported for most of the non-substituted carbohydrates are significantly higher (e.g. ∼40 and 52 kJ mol−1 for α-D- and β-D-glucose, respectively; the data based on the present study) than those corresponding to the 4C1 → 1C4 inversion in e.g. the iduronic acid molecule (25 kJ mol−1; data taken from ref. 45). Moreover, the unbiased MD simulations, depending on the system, required over 3–5 μs (ref. 1) or 0.25 μs (ref. 45) of the computer time for equilibration. It is hard to expect the same efficiency in the case of e.g. glucose, as well as for numerous other carbohydrates, characterized by much higher free energy barriers separating particular puckers. For instance, we were not able to observe even a single event of the 4C1 → 1C4 puckering during over 3 μs unbiased MD simulations of the β-D-glucose molecule. The commonly used, MD-based techniques of enhanced sampling (e.g. metadynamics,46 umbrella sampling-based approaches47) have successfully been applied to determine the free energy landscapes of interest38–43 but the information of the related dynamic features of the puckering is lost. Thus, to collect a sufficiently large number of trajectories leading from the 4C1 conformer to the 1C4 one, the transition path sampling (TPS) technique48,49 was applied in combination with the standard MD engine.
In theory, the MD trajectories harvested during the TPS procedure should allow for evaluation of the puckering mechanism, associated free energy landscape and the transition state ensemble. Apart from that characteristics, we also made some attempt to calculate the optimal reaction coordinate (RC), expressing the 4C1 → 1C4 inversion. A good RC would be able to predict the commitment probability to reach a given configuration by the system (the so-called committor).50–53 As the previous cases of applying the procedures aiming at estimating RC were focused on the complex systems, containing large biomolecules (protein-containing systems, mainly), it would be interesting to apply the same methods for the (relatively simpler) carbohydrate system to find similarities and differences.
Our simulations were confined to the molecules of α-D- and β-D-glucose (GlcA and GlcB, respectively), treated here as model systems. Note that the methods applied and described in the present manuscript can be equally well applied for any other hexopyranose-containing system. The manuscript is organized as follows. After the description of computational methodologies, we report the results related to the following aspects of the carbohydrate ring puckering: (i) brief description of the intermediate states (transition paths) of the 4C1 → 1C4 rearrangement and their discussion in the context of the canonical conformations of the six-membered rings; (ii) the time characteristics of the 4C1 → 1C4 transition; (iii) searching for the optimal reaction coordinate describing the 4C1 → 1C4 transition in terms of the Peters–Trout (Likelihood Maximization, LM) approach;53 (iv) discussion on the found coordinates, potential transition states and their features. We end with concluding remarks.
![]() | ||
Fig. 1 (A) The chemical structure of the D-glucose molecule. The atom numbering is indicated. (B) The free energy profiles for the molecules of GlcA and GlcB, associated with the θ parameter of the Cremer–Pople coordinates. The grey regions are those which were treated as ‘stable states’ (i.e. the 4C1 and 1C4 conformers) and not sampled during the TPS simulations. (C) Schematic representation and nomenclature of idealized pyranose ring conformations according to ref. 38. Conformations are labeled with the type of conformation (chair C, boat B, or skew–boat S) and indices k and l represent the atom numbers of two atoms pointing upward (superscript) or downward (subscript). The set of all conformers is shown in Fig. 2(A) and (B) as points on the plane defined by the Cremer–Pople coordinates. |
During the TPS simulations, we monitored several order parameters, intending to use them during the procedure of reaction coordinate analysis. These parameters included: (i) the four types of coordinates used to describe the six-membered ring conformation (i.e. CP, HR, B, PS, see the previous paragraph for definitions and references); (ii) some atom–atom distances, characteristic of the ring conformation of GlcA and GlcB molecules (the O(1)–O(4) and O(2)–C(6) distances for GlcB and the O(2)–C(6) distance for GlcA, see Fig. 1(A) for definition). Note that except for the Cremer–Pople θ, none of the parameter is directly correlated with the progress of the 4C1 → 1C4 transition and, thus, can not be treated as a valuable order parameter. We have used the following transformation:
![]() | (1) |
![]() | (2) |
(The Cremer–Pople θ is treated as another v(x) parameter). The input for this procedure is the ensemble of shooting point configurations belonging to the accepted trajectories ending in the final state 1C4 (i.e. B(xsp → B)) and the rejected shooting points ending in the 4C1 initial state (i.e. A(xsp → A)). By using these configurations, the LM optimizes the likelihood:
![]() | (3) |
See details of the procedure in the ESI† of ref. 65. We tested all possible linear combinations of up to three order parameters. The committor pB (i.e. the commitment probability of a given conformation of the system to 1C4) was expressed by the following function:
![]() | (4) |
According to the Bayesian criterion, adding more v variables to the RC model is significant only if lnL increases by at least 1/2
ln
M, where M is the total number of shooting points in the ensemble.
The practical use of the LM procedure can be described as a best-fit procedure during which the values of ai parameters (eqn (2)) are adjusted to maximize the value of L (eqn (3)). L is calculated during each iteration based on: (i) the configuration of the shooting points (x, required to calculate v's and r(v) according to eqn (2)); (ii) the accepted functional form of the committor (eqn (4)). The highest possible value of L is associated with the ‘optimal’ values of the ai coefficients.
To test the obtained reaction coordinates we explicitly computed the committor for selected configurations characterized by different values of pComm, including those that were identified as putative transition states. The committor for a given configuration is the fraction of unbiased MD trajectories, initialized with random velocities that reach the 1C4 state.
The issue of the correct TPS sampling may be problematic in the case of complex molecules for which distinct reactive paths lie on the poorly known free energy landscape. Then, if energetic barriers separating them are very high, some essential paths may be missed during the TPS-based harvesting of the MD trajectories. The scenario is much simpler in the case of carbohydrate ring puckering as the related free energy profiles can be calculated separately by using an independent method (e.g. metadynamics40 or umbrella sampling38) and compared with the TPS results. On the basis of: (i) inspection into the TPS path density plots (Fig. 2(A) and (B) show that there are no unexplored regions of the phase space defined by the Cremer–Pople coordinates); (ii) comparison of the results with the relative populations of the canonical conformers reported in ref. 38 and estimated using the same force field, we concluded that the sampling was efficient enough to reveal all possible reactive paths maintaining their relative weights.
First of all, note that we did not sample the whole conformational space during TPS simulation but only these parts of it which correspond to the non-chair conformation. Thus, one can not expect to directly compare the TPS results with the full free energy landscapes obtained by using different computational techniques. However, the TPS-related trajectory density map (as shown in Fig. 2(A) and (B)) can be qualitatively viewed as a free energy landscape representation for the ‘intermediate’, non-chair conformers. The results can be summarized as follows: for both GlcA and GlcB only two local minima of the free energy have been found, none of them corresponding to a single specific ‘canonical’ conformation of the six-membered rings.63 Furthermore, these minima always correspond to the boat and skew–boat conformers, lying along the θ = 90 deg line.
In the case of GlcB, the two observed minima (of different sizes and depths) are separated by the two free energy barriers: one of them centered around ϕ ≈ 260 deg (lower barrier) whereas the second one (higher) roughly covering the region 80 deg < ϕ < 140 deg. The relative heights of these barriers are the reason why the overwhelming majority (>99%) of the events of GlcB system switching from one local minimum of free energy to another involves crossing the lower barrier; this corresponds to temporarily adopting the conformations close to 1S5 and 1,4B. The ranges of these two local minima cover roughly the following canonical conformations: (shallower minimum) B3,O and 1S3; (deeper minimum, preferable intermediate state): B2,5, OS2, 3,OB, 3S1 and B1,4. Very similar conformational preferences (two local minima assigned to 1S3 and OS2/3,OB conformers) have been reported by Spiwok et al.,40 using the previous version of carbohydrate-dedicated GROMOS force field.72
In spite of the similar picture emerging in the case of GlcA, there exists a number of significant differences, mentioned below. The free energy barrier separating two minima is significantly lower than that corresponding to GlcB. Thus, the system can interchange the non-chair conformations assigned to each particular minimum more freely. This, combined with the lowered free energy barriers separating the chair and inverted chair conformers from the non-chair ones, may be one of the reasons for different behavior exhibited by GlcA in comparison to GlcB (as explained in the further parts of the paper). The two minima have a similar location to those calculated for GlcB, with the notable differences of: (i) shift one of the minima towards B2,5 conformation, leaving 3S1/B1,4 region less intensively explored; (ii) more similar depth and sizes of the two energy wells. As a result, the lower of the two barriers located around θ = 90 deg, is placed in the vicinity of the 1S5 canonical conformation (i.e. ϕ = 270 deg).
These results remain in agreement with those obtained during the enhanced sampling studies, reported in ref. 40. In spite of minor discrepancies in the number and location of the local minima (which can be ascribed to differences in the force field parameters) the main conclusion remains the same, confirming that the non-chair canonical conformers do not necessarily reflect the actual conformational preferences of the glucose molecule. As the authors40 used different force-fields (e.g. GROMOS45a4,72 GLYCAM,73 OPLS74) and computational methodologies (e.g. implicit or explicit solvation) we can safely assume that such scenario is force field-independent. Furthermore, the metadynamics simulations based on the ab initio potentials and the Car–Parrinello MD formalism gave the related results,43 confirming the canonical conformations do not match the local minima of free energy in the GlcB molecule. The canonical conformations have always been treated as natural reference points when calculating the conformational properties of six-membered rings. They are also useful when quantitatively comparing the conformational features of different compounds or designing the carbohydrate-dedicated force fields.38 The fact of existing the highly-populated conformers not matching the canonical minima leads also to proposing several assignment schemes aiming at associating an actual ring conformation to a canonical conformation.75
The observations discussed above are very significant for the interpretation of the TPS data. Note that attempts of applying some of the existing assignment schemes to describe the dynamic characteristics of the studied conformational rearrangements would give, as an output, the data of doubtful physical sense. In other words: as the system can cross only one significantly large free energy barrier during exploration of the non-chair region of the phase space, there is no need to create additional distinctions (e.g. equivalent to assignments of the system to canonical ring conformations). Thus, we decided to introduce a very simple (but somewhat arbitrary) division of the phase space, based on the θ and ϕ Cremer–Pople coordinates. The related regions are shown in Fig. 2 and are defined by the following (limiting) values of ϕ coordinate in the non-chair (i.e. those for which the 20 deg < θ < 160 deg relation is fulfilled) area of phase space: (for GlcA) region I: 50 deg < θ < 110 deg, ϕ < 100 deg and ϕ > 290 deg; region II: 50 deg < θ < 110 deg and 100 deg < ϕ < 290 deg; region III: θ < 50 deg; region IV: θ > 110 deg; (for GlcB) region I: 50 deg < θ < 110 deg, ϕ < 100 deg and ϕ > 250 deg; region II: 50 deg < θ < 110 deg and 100 deg < ϕ < 250 deg; region III: θ < 50 deg; region IV: θ > 110 deg. Such type of assignment will be used in the subsequent time characteristic of the conformational rearrangements. Note that for both GlcA and GlcB regions II and III can be associated with the previously described local minima of free energy lying in the region θ ∼ 90 deg.
![]() | ||
Fig. 3 The histogrammed lengths of the reactive MD trajectories including the contribution of the particular regions of the phase space (defined in the text and presented in Fig. 2) for GlcA (A) and GlcB (B). The histograms corresponding to the particular regions are colored in the following manner: black (region I); red (region II); blue (region III); green (region IV). The inset panels correspond to the lengths of the complete reactive trajectories, leading from 4C1 to 1C4. Further details are given in the text. |
The average time which is spent by the system in each region varies from 0.2 to 20.5 ps (for GlcA) and 0.3 to 52 ps (for GlcB). The average length of the total trajectory leading from 4C1 to 1C4 is much longer (277 and 65 ps for GlcA and GlcB, respectively) which makes a significant difference, especially for GlcA. The main reason for that is the characteristic shape of the free energy landscape (Fig. 1(B)). The large free energy barriers separating the chair conformation from the non-chair ones make the system ‘trapped’ in the local minima around θ = 90 deg. Each structure exhibiting significant deviation from the basin of attraction assigned to the θ ≈ 90 deg value (i.e. crossing the free energy barrier) is likely to end either as 4C1 or 1C4 conformer. This explains short time spent by the systems in regions III and IV. Similar values of the average trajectory length observed for regions I and II correspond to frequent ‘oscillations’ of the conformation between regions I and II (being the results of the relatively low free energy barrier separating these regions). When calculating the trajectory lengths corresponding to the combined regions I and II one would obtain nearly the same length distributions as those plotted for the total trajectories (i.e. Fig. 3, panels ‘total’). Furthermore, there exists a small number of trajectories not leaving regions I or II for much longer time period than the average value (this is depicted by the standard deviation of the trajectory lengths: 40.7 and 36.7 for GlcA, for regions I and II, respectively and: 75.2 and 11.9 ps for GlcB, regions I and II, respectively). Such diversity was not observed for regions III and IV (standard deviations of time length characteristic of regions III and IV are about half of their mean values for both GlcA and GlcB) which confirms again the minor contribution of these regions to the overall trajectory length.
Furthermore, the probability of visiting both or only one of the two local minima (regions I and II) by the system was examined (visiting regions III and IV is obligatory for all collected MD trajectories). The free energy barrier separating the two main local minima in the region of non-chair conformers (θ ≈ 90 deg) is lower for GlcA than that characteristic of GlcB. This is reflected by the ratio of trajectories which visit both regions I and II: it is equal to 90% for GlcA and only 14% for GlcB. The higher free energy barrier located approximately at the border between regions I and II of GlcB-related free energy landscape makes the conformational rearrangement limiting to the non-chair regions less favourable. Thus, in 86% of the cases, one can distinguish two distinct pathways for GlcB: considering the non-chair conformers, 15% of the trajectories visit only region I while 71% visit only region II. The reactive pathways for GlcA are more uniform: only 4.5% visit region I not entering into region II while the fraction of trajectories leading only through region II is equal to 5.5%. According to such characteristics, the mechanism of ring puckering associated with the diffusive barrier crossing dynamics can be ascribed rather to GlcA than to GlcB which may be meaningful in the context of further findings (see Sections 4 and 5).
Summarizing, the transition paths characteristic of the 4C1 → 1C4 transition involve the following, consecutive stages:
1. For GlcA:
(i) The system leaves the 4C1-related basin of attraction through two possible paths. The more probable one involves adopting the E5, OH5 and OE conformations while the second one is associated with the E3 conformer mainly. Transitions through other regions of phase space (e.g. those corresponding to the 2H3, 4H3, 4E, 4H5, OH1) is also possible but even less likely.
(ii) The system enters the basin of attraction located around θ = 90 deg. The most likely path visits two main local minima of free energy located there (i.e. those centered at 1S3 and OS2) and covering a large number of boat and skew–boat conformers (B3,O, 1S3, 1,4B, 1S5, B2,5, OS2, 3,OB and 3S1). The less probable scenario involves visiting only one local minimum.
(iii) The system leaves the intermediate basin of attraction and crosses the large energetic barriers separating it from the 1C4 conformation. There exist only one broad path, covering the region of the 1E, 1H2, E2 conformers.
2. For GlcB:
(i) In the majority of the cases the system leaves the 4C1-related basin of attraction through the path covering the OH5, OE and OH1 conformations and goes to the larger of the two minima of the free energy located around θ = 90 deg. The less probable path involves adopting the 4H3, 4E conformations when the system goes to the smaller of the two minima.
(ii) The system explores the basin(s) of attraction located around θ = 90 deg (i.e. B3,O, 1S3, 1,4B, 1S5, B2,5, OS2, 3,OB and 3S1). Contrary to GlcA, the most likely path visits only one local minimum of the free energy, (i.e. that centered around 3,OB). Small fraction of the trajectories visits two local minima (i.e. both 3,OB and 1S3). Even less probable scenario involves visiting only one, smaller local minimum, centered around 1S3.
(iii) The system leaves the intermediate basin(s) of attraction and crosses the large energetic barriers separating it from the 1C4 conformation. As in the case of GlcA, there exist only one broad path, covering the region of the 1E, 1H2, E2, 3H2 and 3E conformers.
It should be stressed that the time values depicted in Fig. 3 can not be directly interpreted in terms of rate constants, as during TPS simulation we did not measure the conformational ‘flux’ of the system from the 4C1 conformation to those lying above θ = 20 deg. Such analysis is postponed to our future work.
Finally, we focus on the behavior of the exocyclic groups during the course of the ring puckering. Surprisingly, the probability distributions of all dihedral angles associated with the orientation of the exocyclic moieties are affected by the progress of the ring deformation (expressed as the θ value) to a very minor extent. This is depicted (Fig. S1 and S2, ESI†) by the density plots extracted from the TPS trajectories. The most notable (but still relatively minor) differences are limited to: (i) tor1 in GlcA (which corresponds to the orientation of the C(1)–O(1)–H(1) hydroxyl group); additional peak appears around tor1 = 90 deg, absent in the conformers for which θ < 90 deg; (ii) tor2 in GlcA (defining the orientation of the C(2)–O(2)–H(2) hydroxyl group); the peak around tor2 = 60 deg is reduced compared to the conformers for which θ < 90 deg; (iii) tor5 in GlcB (orientation of the C(5)–C(6)–O(6)–H(6) hydroxymethyl group); the dimension of the peak around tor5 = 60 deg is increased, comparing the conformers for which θ < 90 deg. Furthermore, the pattern of these angle distributions is conserved above θ = 90 deg, i.e. for all the phase space sampled (20 deg < θ < 160 deg) the distribution of any dihedral angle associated with the orientation exocyclic group remains nearly unchanged.
The lack of correlation between progress of the 4C1 → 1C4 reaction and the probability distribution of the tor1–tor6 dihedral angles speaks for the minor contribution of the exocyclic groups to the process of the ring puckering. This is also discussed in the next section.
No. of order parameters | ln![]() |
RC |
---|---|---|
GlcA | ||
1 | −3439 | r(1) = −1.34 + 5.66 × 10⁻³vB |
2 | −3412 | r(2) = −2.62 + 5.23 × 10⁻³vB + 1.50 × 10⁻²θ |
3 | −3400 | r(3) = −1.84 + 4.16 × 10⁻³vB + 2.27 × 10⁻²θ − 1.39 × 10⁻²vHR |
GlcB | ||
1 | −1063 | r(1) = −11.2 + 0.103θ |
2 | −1027 | r(2) = −10.4 + 0.104θ − 7.03 × 10⁻³vB |
3 | −1066 | r(3) = −6.39 + 0.115θ − 7.30 × 10⁻³vB − 4.77 × 10⁻²vHR |
1. Order parameters which were found to be the most essential components of RC are defined on the basis of only ring coordinates; no coordinates involving the orientation of exocyclic groups (e.g. the distance between the O(1) and O(4) atoms) contribute to the calculated RC.
2. The most ‘effective’ appeared to be the collective coordinates (v), defined by eqn (1) and their combinations with the Cremer–Pople θ. Single coordinates (x in eqn (1)), being components of vs., were rejected.
3. In both cases the final RCs consist of linear combination of three (i.e. the maximum allowed number) order parameters. The LM criterion suggesting to reduce the number of order parameters composing RC if lnL increases by at least 1/2
ln
M, (M is the total number of shooting points) was not fulfilled in any case.
4. As the consequence of the accepted functional form of RC (eqn (4)), its values can change from −∞ to +∞, and the equal probability (pB) of reaching either 1C4 or 4C1 (transition state) corresponds to RC = 0. In practice, only the range −2.5 < RC < 2.5 is considered in which the pB value varies from 2% to 98%.
The lack of exocyclically-related coordinates in the obtained RCs can be considered as surprising, due to undoubtedly significant role of the exocyclic group in the conformational equilibrium in the carbohydrate systems (e.g. the inversion of stereoconfiguration at any of the carbon ring atoms results in a change in a dynamic equilibrium between particular conformers). However, this remains in agreement with the results reported in the previous section, according to which the orientation of the exocyclic groups is not correlated with the progress of the considered ring conformational change. The structural role of the exocyclic substituents is included implicitly, as the set of the three selected order parameters and their relative weights (i.e. the a coefficients in eqn (2)) differ for GlcA and GlcB. The most probable reason for selecting the collective coordinates (v) instead of their components (x) is that the single v parameter (as expressed by eqn (1)) is able to differentiate between all possible canonical conformers; therefore it is more sensitive for the gradually changing ring conformation. None of the order parameters defining v exhibits such a feature.
The main aim for the calculated RC is to predict the probability of evolution of the system to a given state (i.e. to the 1C4 conformation in the considered case) on the basis of those parameters which appear in the mathematical form of RC. As for both GlcA and GlcB only the ring coordinates appear in their respective RCs, thus, in theory, one can predict the probability of the conformational transition knowing only the specific shape of the carbohydrate ring. To test the quality of the obtained RC the committor (i.e. the pB values in the function of RC) has been calculated explicitly for the numerous configurations characterized by different values of RC. The results (shown in Fig. 4) have been compared with RC based on the LM procedure, proving that serious inaccuracies exist, especially in the case of GlcB.
![]() | ||
Fig. 4 The test of the calculated reaction coordinate for GlcA (A) and GlcB (B). Solid lines represent the theoretically calculated RC composed of three order parameter (r(3) in Table 1), whereas each square denotes the pB value obtained from the explicitly calculated committor. Further details are given in the text. |
In the case of GlcA the level of agreement is satisfactory in the region corresponding to RC < 0 but decreases significantly for RC ≥ 1. On the other hand, RC calculated for GlcB has virtually no prediction ability due to extremely large discrepancies observed not only in the region RC > 0 but for nearly all range of RC except of its extremely small and large values. Appreciating the unsatisfactory results obtained for GlcB, one can still note that the GlcA-related RC is able to predict the probability of the system evolving to the 1C4 state fairly well for RC < 0. One can experience the impression that such RC gives the correct results in a half of the cases. Actually, the condition RC < 0 is fulfilled for the majority of the phase space expressed in the Cremer–Pople θ coordinate. The rough estimation shows that the transition state (TS) structures lies around θ = 125–130 deg, thus, the calculated coordinate should work quite well when the GlcA conformation corresponds to θ < 125 deg. When considering the cutoffs of the developed trajectories (20 deg < θ < 160 deg), this represents over 70–75% of the possible values of θ. Note also that providing the exact value of θ above which RC fails to calculate pB correctly is impossible, as RC is also the function of other essential order parameters.
The reasons for discrepancies between the predictions of RCs and the explicitly calculated committors may be of various nature. Below the most probable hypotheses are discussed:
(i) The procedure of calculating RC based on the LM approach is inapplicable for the GlcB system (but at least partially applicable for GlcA). The procedure used here has been derived under the assumption that the so-called ‘diffusive’ barrier crossing controls the dynamic behavior of the system.53 There is no test allowing for unambiguous statement how close is the behavior of the considered system to the ideal ‘diffusive’ dynamics. Obviously, the free energy landscapes of GlcA and GlcB are less complicated than those of larger biomolecules for which the LM approach has been applied so far (e.g. ref. 65 and 76). Judging only on the basis of the height of the free energy barriers one can suppose that GlcB will be further from the ideal ‘diffusive’ behavior (compared with GlcA) as the very high (∼50 kJ mol−1) free energy barrier separating the non-chair conformer from the 1C4 pucker seems to dominate the whole dynamics of the system. Such hypothesis is also supported by the shorter average length of the reactive trajectories obtained for GlcB. The longer trajectories collected in the case of GlcA correspond to more diffusive barrier crossing which, on average, takes more time.
(ii) The lack of some essential order parameter(s) which results in the poor (GlcB) or insufficiently good (GlcA) RC. Contrary to conformational transitions in more complex biomolecules (e.g. proteins) the number of order parameters is rather limited. In spite of that we can not exclude the situation in which some crucial order parameter(s) can be missing (e.g. those related to the arrangement and dynamics of water molecules) or some details of the process can not be described by simple parameters (based on the ring puckering-related coordinates and some atom–atom distances) applied in this study. This issue is discussed in more detail in the subsequent part of the paper.
(iii) Transition states are located extremely close to one of the basins of attraction (1C4). Unlike the issues mentioned in points 1 and 2 which are of rather general nature and the respective questions can be raised in the context of any system subjected to the analogical LM procedure, the present hypothesis seems to be characteristic of only the carbohydrate ring conformational changes. The reason for that is the combined influence of: (i) the asymmetry in the depths of the two energy wells corresponding to the two stable states; (ii) the asymmetry in the heights of the two largest free energy barriers separating these states (and located around θ = 60 and 120 deg, see Fig. 1(B)). This results in the fact that, independently of the order parameter used, the transition state is located in the direct vicinity of the (final) 1C4 conformer. In practice, conformations corresponding to TS and 1C4 can be separated by only one frame of MD trajectory (saved every 0.1 ps). Thus, nearly all the successful shooting points correspond to RC < 0. Although this does not influence the sampling process, such asymmetric distribution may be a potential reason for artifacts during adjusting RC; this is dictated by the fact that shooting points located around TS have the largest weight in the LM procedure (according to eqn (15) in ref. 53). Expanding a small piece of the phase space (130 deg < θ < 160 deg) into a large region of RC > 0 may result in inaccuracies located in the latter range.
Having the structures identified as transition states (10 different structures for both GlcA and GlcB for which pB = 0.5 ± 0.1, as confirmed by explicit committor calculations) we examined the influence of the instantaneous water structure on the committor to estimate the contribution of the water dynamics to the reaction coordinate. We froze the carbohydrate coordinates and simultaneously disrupted the water structure/dynamics by running short (∼200 ps) MD simulations at 298 K. Then we checked if the committor for these ‘randomized’ structures deviates systematically from its initial value, i.e. 0.5; this was done by analogy to the explicit committor calculations described in the Methods section. In the case of GlcA the recalculated committors were equal to 0.5 ± 0.1. Therefore we concluded that this committor is independent of the dynamics of the water. This conclusion seems to be surprising in the view of the reports describing the significant role of water in the carbohydrate conformations. There is no contradiction, however, as the water configuration can still play a structural role, influencing the carbohydrate configurations in the free energy wells. On the other hand, the analogous calculations performed for GlcB gave completely different results; it appeared that the recalculated committors deviated significantly from their initial values (varying from 0.08 to 0.4), evidencing that water dynamics is a crucial component of reaction coordinate. This may explain the poor results of searching for an optimal reaction coordinate in the case of GlcB as no water-related order parameters were explicitly included in the LM procedure. There also exist the previously reported cases of water dynamics being irrelevant for reaction coordinates76 when concerning the systems in which the considered process was driven by the ‘diffusive’ energy barriers crossing. This observation, combined with the results obtained for GlcA (indicating the larger contribution of ‘diffusive’ dynamics) allows for speculation if the relevance of water dynamics is correlated with the degree of ‘diffusivity’ of the system over the free energy landscape accompanying the process of interest. Independently of the specific reasons, one has to appreciate that the dynamics of conformational rearrangement in the molecules of GlcA and GlcB is driven by (at least) slightly different mechanisms. This remains in agreement with the fact that in spite of using exactly the same set of order parameters the resulting RCs differ significantly in their ‘prediction power’; this also implies that not only water structural arrangement but also its dynamics can be an important component of RC. Such scenario may explain why the committors recalculated for GlcB deviated much from their initial values (any order parameter directly related to the dynamics of water molecules has not been tested during the LM procedure). The ultimate explanation of this issue (as well as proper choice from the alternative mentioned in the previous part) would require designing new, water-related, order parameter(s) and testing it (them) in the new LM procedure. However, we have not been able to find any proper order parameters, based on the structural features of water molecules surrounding the GlcB molecule and correlated with the progress of the 4C1 → 1C4 transition. Note also that the LM procedure approves only the conclusion that the water dynamics has a little (GlcA) or significant (GlcB) effect on the conformational rearrangements for the system being in the vicinity of the transition state; the reason for that is the TS configurations have the largest weight in the LM procedure (according to eqn (3)).
The calculated transition states corresponding to GlcA exhibit relatively similar structures, in spite of the fact that they do not correspond to any single canonical conformation. The ring conformations of the TS structures cover a relatively large area of the Cremer–Pople (ϕ, θ) representation, centered around (ϕ = 300 deg, θ = 105 deg) which corresponds to an intermediate between the E2 and B2,5 conformers and spreading up to the 1E and 3E conformers. Marking several TS on the Cremer–Pople puckering free energy landscape (Fig. 2(A)) clearly shows that such set of coordinates is insufficient to predict the TS structures; TS-related points are rather scattered and do not indicate the existence of some specific ‘bottleneck’ controlling the flow of the system into the 1C4-related basin of attraction. Furthermore, the lack of the appropriate parameters associated with the free energy landscape is the cause why some of the TS structures are closer to the local minima of the free energy than to the free energy barriers. The orientation of the exocyclic groups varies from one TS structure to another, remaining in agreement with the results described in the previous section. The four exemplary TS structures (those depicted in Fig. 2(A)) are deposited in ESI† (PDB format). As we found that water environment and its dynamics are essential for determining if the given structure of GlcB is a transition state, the related analysis based solely on the GlcB structure (being a potential TS) seems to be pointless.
Footnote |
† Electronic supplementary information (ESI) available. See DOI: 10.1039/c4ra03410d |
This journal is © The Royal Society of Chemistry 2014 |