Enhanced photoluminescence and thermal stability of zinc quinolate following complexation on the surface of quantum dots

Satyapriya Bhandaria, Shilaj Royb and Arun Chattopadhyay*ab
aDepartment of Chemistry, Indian Institute of Technology, Guwahati-781039, Assam, India. E-mail: arun@iitg.ernet.in; Fax: +91-361-258-2349; Tel: +91-361-258-2304
bCentre for Nanotechnology, Indian Institute of Technology, Guwahati-781039, Assam, India

Received 13th April 2014 , Accepted 23rd May 2014

First published on 23rd May 2014


Abstract

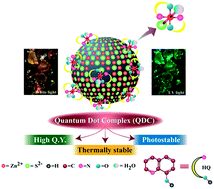
Reaction between colloidal ZnS nanocrystals (NCs) and 8-hydroxy quinoline (HQ) led to complexation on the surface of the NCs. The quantum dot complex (QDC), with ZnQ2 attached to the surface of the NC, has a longer emissive lifetime, higher fluorescence quantum yield and enhanced thermal stability, making it a better LED material than ZnQ2.

Interaction of colloidal quantum dots (Qdots) with chemically reactive species – being either functionalized on the surface or as independent entities – can lead to reversible and irreversible changes in their optical properties. This could involve electron, hole or energy transfer between the electronic state of the Qdot or the dopant in a doped Qdot and the internal or external reactive species.1,2 A host of inorganic complexes, organic and biomolecules have been bridged to Qdots via organic or biomolecular ligands, which have been shown to be useful in biosensing, bioassay, photovoltaics and CO2 conversion – based on their mutual chemistry.3–7 Thus surface structure and composition of Qdots are as important as the core in determining their physical properties. For example, dangling bonds and surface trap states reduce the quantum efficiency of photoluminescence, which are addressed by passivation using organic and inorganic moieties. Additionally, luminescence quantum yield (QY) of Qdots can be improved via exchange of molecular and atomic ligands, following synthesis, thus allowing for applications in diverse environment and in targeted delivery.8,9 On the other hand, the smallness of size and high surface free energy of Qdots make cation exchange facile, leading to generation of new crystals and crystals with complex morphology; whereas partial ion exchange can lead to superlattice formation.10,11 Further, the cations present on the surface could be systematically removed or replaced leading to change in optical properties.12,13

However, an important chemistry that received virtually no attention is reaction between Qdot and organic ligand, leading to new structure or species formation involving the Qdot. An ideal example would be complexation on the surface of the Qdot following reaction between the surface cation and suitable ligand. This may confer newer property to the Qdot, the complex or both. It is important to mention here that there are literature reports of incorporation of chelating ligand – at least partially – through exchanges with stabilizers. This method has been used for enhancement of optical properties of Qdots. However, generation of metal complexes on the surface of Qdots and their implications have not been clearly demonstrated.14–18 We report that reaction between ZnS Qdot and 8-hydroxyquinoline (HQ) at room temperature led to formation of a new species – referred to herein as quantum dot complex (QDC) – involving Zn2+ and HQ on the surface of the Qdot. In that process, while the fluorescence of the Qdot was completely quenched, a new fluorescence attributable to the formation of the complex occurred. Interestingly, similar fluorescence could be observed when ZnQ2 complex was added to the Qdot, possibly resulting in similar complex formation. Further investigations revealed significantly enhanced thermal stability of the QDCs over ZnQ2, with retention of fluorescence in the former following heating at an elevated temperature.

Importantly, ZnQ2 has been a preferred important inorganic compound for LED applications for its emissivity and stability.19–22 Also, AlQ3 is chosen for its excellent stability and high electroluminescence QY.23–25 Recent literature suggest that Qdots with high QY could potentially be used for light emitting devices.26 All of the above materials, although work well with reasonable QY there are drawbacks such as processing, thermal and optical stability, blinking and chemical degradation.19–26 In that respect QDC may be able to overcome at least some of these problems and thus may become a material of preference, especially in light emitting applications.

Experimentally, the UV-vis absorption spectrum of cysteine stabilized 3.2 nm ZnS Qdots consisted of a peak at 308 nm, as is represented in Fig. 1A(a). The absorption spectrum of HQ consisted of a peak at 316 nm (Fig. 1A(b)). Further, the absorption spectrum of ZnQ2 consisted of a peak at 380 nm (Fig. 1A(c)). On the other hand, when an aqueous dispersion of cysteine-stabilized 3.2 nm ZnS Qdots was treated with HQ (in MeOH), a second peak in the UV-vis absorption spectrum appeared at 361 nm, in addition to the original peak due to the Qdots at 308 nm (Fig. 1A(d)). The absorption spectrum of ZnQ2-added Qdots (Fig. 1A(e)) had the same feature as that of HQ-added Qdots. The appearance of a new peak is indicative of interaction between the Qdots and HQ as well as ZnQ2, leading to the formation of a new species. The identical absorption spectral peak in both the cases pointed toward formation of the same species. Further, when the samples were centrifuged and redispersed in water the absorption spectra remained the same, indicating that indeed there was product formation out of a reaction between the Qdots and HQ as well as ZnQ2 (Fig. S1,ESI).


image file: c4ra03341h-f1.tif
Fig. 1 (A) UV-vis and (B) emission spectra of (a) cysteine capped ZnS Qdots (pH-6.6); (b) HQ; (c) ZnQ2; (d) HQ added ZnS Qdots (pH-6.6) and (e) ZnQ2 added ZnS Qdots (pH-6.6). For the emission spectral measurements, the excitation wavelength was set at 322 nm (Qdots) and 361 nm (others).

Fluorescence spectrum of HQ-treated Qdots consisted of a single peak at 500 nm with QY of 3.2%, when excited at 361 nm and that of 0.16% following excitation at 322 nm. ZnQ2 treated Qdots had the same spectrum with QY of 3.0% and 0.14%, under excitation at 361 nm and 308 nm, respectively. Fluorescence spectrum of ZnQ2 consisted of a peak at 550 nm (QY = 0.9%), while that of HQ had a weak peak at 520 nm (QY = 0.2%), both of them being excited at 361 nm (Fig. 1B and Table S1,ESI). Further, when the dispersions were centrifuged and the solids so obtained were redispersed similar fluorescence spectra were obtained for the samples (Fig. S2,ESI). Fluorescence excitation spectrum of the HQ as well as ZnQ2 treated Qdots consisted of a single peak with maximum at 361 nm (Fig. S3,ESI).

The above results indicated that interaction between HQ and ZnS Qdot led to the reaction resulting in possible complexation on the surface of the Qdot. Thus while the fluorescence due to the Qdot was quenched, the new fluorescence could be attributed to the formation of a complex on the Qdot (Fig. S4,ESI). That addition of ZnQ2 to Qdot also resulted in similar spectral behaviour further supported the formation of a complex on the surface, as ZnQ2 upon functionalizing the surface could have produced similar structure. Control experiment with addition of water to the methanol medium containing ZnQ2 complex resulted in weakening of emission without change in the peak wavelength, discounting the role of water only in changing the emission spectrum (Fig. S5,ESI). The significant blue shift observed in the emission spectrum in the presence of Qdots could be due to the presence of S2− ions on the surface of the Qdots. Moreover, there was no change in pH, during formation of QDCs from Qdots (pH 6.6), which ruled out the possibility of pH effect on the emission properties of ZnQ2 complex. This was further substantiated by the observation that when solid Na2S was added to ZnQ2 (in MeOH) the peak at 550 nm blue-shifted to 525 nm (Fig. S6A,ESI). The absorption spectrum was also blue-shifted from 380 nm to 368 nm in the presence of Na2S (Fig. S6B,ESI). It is important to mention here that when all of the above experiments were carried out with ZnS Qdots, which were synthesized without the use of any stabilizer, the results were similar, indicating that interactions between the Qdots and HQ or ZnQ2 indeed led to complexation on the surface (Fig. S7,ESI). Further, addition of benzoquinone (BQ) – an electron quencher – to ZnS Qdots led to the quenching of luminescence, which was recovered following addition of HQ. On the other hand, when BQ was added to QDC generated from either of the reaction there was no change in fluorescence (Fig. S8,ESI). Further, BQ had no influence on the fluorescence of ZnQ2 (Fig. S9,ESI). The results clearly support the formation of a stable fluorescent complex on the Qdot, notwithstanding the presence of a quencher (BQ) of the Qdot. Time-resolved fluorescence measurements indicated that the average life-time of fluorescence increased under excitation at 375 nm (with respect to ZnQ2 complex) and decreased under excitation at 308 nm (with respect to Qdots) following complexation (Fig. S10,ESI). For example, the life-time for ZnQ2 was found to be 2.5 ns, whereas HQ treated and ZnQ2 treated samples had average life-time of 10.5 s and 11.5 ns respectively with excitation at 375 nm while reverse was observed with excitation at 308 nm (Table S2,ESI). The increase in average life-time was commensurate with increase in QY as mentioned above. In addition, enhanced photostabilty of the QDCs formed from either of the reactions, with a fluorescence decrease rate (I/I0) of 0.003% s−1 versus 0.013% s−1 for rhodamine 6G dye, indicated superior application potential of the new material (Fig. S11,ESI). It may further be mentioned here that photostabilty of the QDC was as good as that of ZnQ2 (0.004% s−1), indicating preservation of photochemical stability of the complex even when present on the surface of the Qdot. (Table S3,ESI).

The formation of Zn2+–quinolato complex on the surface of the Qdots was further substantiated by FTIR spectroscopic results. The presence of C–C/C–N stretching, C–H bending peaks at 1605, 1577, 1500, 1468 and 1322 cm−1, C–H out plane wagging at 822, 800 and 742 cm−1 and in-plane ring deformation at 742, 642 and 605 cm−1 in the QDCs indicated that HQ was successfully coordinated to the surface Zn2+ ion or ZnQ2 was attached to the surface. The intensity ratio of the two prominent bands at 3333 cm−1 and 1110 cm−1 was measured to be 0.7, pointing toward the formation of a complex similar to the dihyrdate complex (Fig. S12 and expanded FTIR spectra in Fig. S26–S30 and Tables S4 and S5,ESI). However, considering the observed role of surface S2− ions a proposal could be made where a water molecule of the hexa-coordinated complex is replaced by S2− ions, which is simultaneously bound to the surface of the Qdot via dangling bond.

Thermo-gravimetric analysis (TGA) showed weight loss (15–20%) for Qdots and QDCs up to 95 °C and there was no further change till 850 °C. These weight losses could be due to loss of surface adsorbed water. On the other hand, ZnQ2 exhibited two weight losses – one at 120 °C, while the other major one at 450 °C, which could be due to decomposition of the sample. Differential scanning calorimetry (DSC) studies similarly showed that the major endothermic change observed for ZnQ2 at 360 °C was absent for QDC obtained from both the sources, indicating superior stability of the complex on the surface of the Qdots (Fig. 2). It is plausible that the peak at 360 °C is due to melting of the ZnQ2 crystal which was absent in the QDC, also supporting superior thermal stability of the complex when incorporated in the Qdots.


image file: c4ra03341h-f2.tif
Fig. 2 (A) Thermo-gravimetric and (B) differential scanning calorimetric analyses of (a) ZnQ2; (b) cysteine capped ZnS Qdots; (c) HQ added ZnS Qdots and (d) ZnQ2 added ZnS Qdots.

The powder X-ray diffraction (XRD) pattern and high resolution transmission electron microscopy (HRTEM) analyses of QDCs generated from both the sources had the characteristics of as synthesized Qdots, which indicated that there was no significant structural changes of cubic ZnS Qdots (Fig. S13 and S14,ESI). Further, TEM analysis results (Fig. S15,ESI) revealed that the average particle size of the spherical structures remained unaffected following complexation.

A schematic representation in Fig. 3 captures the proposed formation of QDC, based on the reaction of Qdot with either HQ or ZnQ2·2H2O. The surface of Qdot is expected to have sufficient concentrations of Zn2+ and S2− ions bound to the crystal via dangling bonds. Such Zn2+ ions would preferentially react with HQ forming QDC. In the process of complex formation, the ions may be removed from the surface and the whole complex would bind on the surface instead, also acting as a stabilizer for the Qdot. The facile removal of Zn2+ ions is commensurate with the literature reports of surface ion removal and ion-exchange reactions as mentioned above. The S2− ions present on the surface may bind with ZnQ2 along with another water molecule in the opposite axial position forming an octahedral complex on the surface. Similarly, ZnQ2·2H2O may lose one coordinating water molecule and bind with S2− in order to form similar complex on the surface. The octahedral ZnQ2·2H2O complex with two water molecules in axial positions is stable at room temperature. Here, in both the QDCs, one of the axial positions of the complex may be occupied by S2− – replacing a water molecule, while the sulphide ion itself would be bound to the Qdot through dangling bond, providing stability to the complex and the Qdot as well in exchange. On the other hand, the HOMO–LUMO band-gap energy of 3.26 eV of ZnQ2.2H2O changed to 3.43 eV in QDC formed from both the reactions. The role of S2− in tuning of the energy gap of the complex is established by the observation of increase in the gap to 3.37 eV in the presence of the anion. The observation of significant change in the energy gap following the formation of QDC indicates role of Qdot in tuning the energy level of the complex. Further, the presence of a single excitation spectrum of QDC with the peak at 361 nm indicated that the formation of the complex led to quenching of fluorescence due to Qdot, while the new fluorescence is entirely due to the complex present on the surface of the Qdot, even though the absorption peak due to the Qdot was retained in the QDC.


image file: c4ra03341h-f3.tif
Fig. 3 Schematic representation of quantum dot complex (QDC) formation on the surface of cysteine capped as well as uncapped ZnS Qdot following its reaction with either HQ (ligand) or ZnQ2 (complex).

The octahedral ZnQ2·2H2O has its two axial positions occupied by H2O. On the other hand, when the complex is attached to the surface of the Qdot, it is proposed that one of the H2O molecules is exchanged with bonding to a surface dangling sulphide ion. This provides not only chemical stability to the complex but also change in its optical property such as blue shift of the emission maximum and increase in QY and thermal stability. This conclusion is further supported by the observation that when Na2S was added to the ZnQ2·2H2O (in methanol) there was a blue shift in emission maximum accompanied by an enhancement in QY.

Finally, ZnQ2·2H2O is popular as an active material for light emitting diodes (LEDs).19–22 Thus any potential application of the new QDC would require ease of processing and stability. We observed that the QDCs generated from both the processes could be turned into solid powder with the retention of their properties. Fig. 4A shows the optical micrographs of the powders of ZnQ2·2H2O and QDCs, which are brown under visible light and green under UV light, the characteristic fluorescent colour of the complex. In contrast, the colour of solid powder of the Qdots appeared colourless under white light and blue under UV light (Fig. S16,ESI). More importantly, the green fluorescent colour of the free complex vanished upon heating for 10 min at 370 °C. On the other hand, the crystalline solid form with retention of fluorescence of QDCs could clearly be observed, indicating their superior thermal stability (Fig. 4B). It may be mentioned here that when the heat-treated solids were redispersed in methanol, the fluorescence spectra of the QDCs were retained (Fig. S17,ESI); however, the fluorescence spectrum of the dispersion of the solid, obtained from heat treated complex, did not exhibit any characteristic fluorescence indicating loss of the structure.


image file: c4ra03341h-f4.tif
Fig. 4 Microscopic images of solid samples (A) before and (B) after heating (at 370 °C) in presence of (1) white and (2) UV light (λex = 350 nm); (a) ZnQ2, (b) HQ added ZnS Qdots and (c) ZnQ2 added ZnS Qdots.

In conclusion, a new material following complexation of Qdots leading to the formation of ZnQ2 species on the surface has been reported. The high fluorescence QY, longer fluorescence lifetime and enhanced thermal stability of the QDCs are important indicators of their potential in light emitting and other applications. The role of surface ions in the formation and stability of the complex brings out a new chemistry which may usher in a new approach to inorganic complexes. Our observations of formation of similar complexes from reaction of HQ with ZnxCd1−xS and Mn2+ doped ZnS nanocrystals indicated generality of the approach and future prospects of a new field.

Author contributions

SB performed the experiments, contributed ideas and wrote the paper. SR performed the experiments, contributed ideas. AC conceived the idea, helped implement the experiments and wrote the paper.

Acknowledgements

We thank the Department of Biotechnology and Department of Science and Technology, Government of India for fund and development of facility. Assistances from CIF, IIT Guwahati, Rumi Khandelia, Ashim Malakar, Dr Devashis Chowdhury and Amaresh Kumar Sahoo are acknowledged. S.B. thanks the CSIR for fellowship (09/731(0115)/2011-EMR-I).

Notes and references

  1. C. Wang, M. Shim and P. Guyot-Sionnest, Science, 2001, 291, 2390 CrossRef CAS PubMed.
  2. M. Shim and P. Guyot-Sionnest, Nature, 2000, 407, 981 CrossRef CAS PubMed.
  3. I. L. Medintz, T. Pons, S. A. Trammell, A. F. Grimes, D. S. English, J. B. Balnco-Canosa, P. E. Dawson and H. Mattoussi, J. Am. Chem. Soc., 2008, 130, 16745 CrossRef CAS PubMed.
  4. M. H. Stewart, A. L. Huston, A. M. Scott, A. L. Efros, J. S. Melinger, K. B. Gemmill, S. A. Trammell, J. B. Balnco-Canosa, P. E. Dawson and I. L. Medintz, ACS Nano, 2012, 6, 5330 CrossRef CAS PubMed.
  5. W. MA, L. Qin, F. Liu, Z. Gu, J. Wang, Z. G. Pan, T. D. James and Y. Long, Sci. Rep., 2013, 3, 1537 CAS.
  6. S. Sato, T. Arai, T. Morikawa, K. Uemura, T. M. Suzuki, H. Tanaka and T. Kajino, J. Am. Chem. Soc., 2011, 133, 15240 CrossRef CAS PubMed.
  7. I. L. Medintz, M. H. Stewart, S. A. Trammell, K. Susumu, J. B. Delehanty, B. C. Mei, J. S. Melinger, J. B. Balnco-Canosa, P. E. Dawson and H. Mattoussi, Nat. Mater., 2010, 9, 676 CrossRef CAS PubMed.
  8. J. Tang, K. Kemp, S. Hoogland, K. S. Jeong, H. Liu, L. Levina, M. Furukawa, X. Wang, R. Debnath, D. Cha, K. W. Chou, A. Fischer, A. Amassian, J. B. Asbury and E. H. Sargent, Nat. Mater., 2011, 10, 765 CrossRef CAS PubMed.
  9. Z. Lingley, S. Lu and A. Madhukar, Nano Lett., 2011, 11, 2887 CrossRef CAS PubMed.
  10. D. H. Son, S. M. Hughes, Y. Yin and A. P. Alivisatos, Science, 2004, 306, 1009 CrossRef CAS PubMed.
  11. R. D. Robinson, B. Sadtler, D. O. Demchenko, C. K. Erdonmez, L. W. Wang and A. P. Alivisatos, Science, 2007, 317, 355 CrossRef CAS PubMed.
  12. R. Begum, S. Bhandari and A. Chattopadhyay, Langmuir, 2012, 28, 9722 CrossRef CAS PubMed.
  13. S. Bhandari, R. Begum and A. Chattopadhyay, RSC Adv., 2013, 3, 2885 RSC.
  14. C. Lu, J. Gao, Y. Fu, Y. Du, Y. Shi and Z. Su, Adv. Funct. Mater., 2008, 18, 3070 CrossRef CAS.
  15. D. S. Bohle and C. J. Spina, J. Phys. Chem. C, 2009, 113, 14435 CAS.
  16. L. Feng, C. Wang, Z. Ma and C. Lu, Dyes Pigm., 2013, 97, 84 CrossRef CAS PubMed.
  17. B. Liu, X. Lu, C. Tong, C. Wang, L. Feng, Y. He and C. Lu, RSC Adv., 2013, 3, 21298 RSC.
  18. X. Lu, J. Yang, Y. Fu, Q. Liu, B. Qi, C. Lu and Z. Su, Nanotechnology, 2010, 21, 115702 CrossRef PubMed.
  19. S. Sapochak, F. E. Benincasa, R. S. Schofield, J. L. Baker, K. K. C. Riccio, D. Fogarty, H. Kohlmann, K. F. Ferris and P. E. Burrows, J. Am. Chem. Soc., 2002, 124, 6119 CrossRef PubMed.
  20. T. A. Hopkins, K. Meerholz, S. Shaheen, M. L. Anderson, A. Schimdt, B. Kippelen, A. B. Padias, H. K. Hall, N. Peyghambarian and N. R. Amstrong, Chem. Mater., 1996, 19, 344 CrossRef.
  21. Y. Hamada, T. Sano, N. Fujita, T. Fujii, Y. Nishio and K. Shibata, Jpn. J. Appl. Phys., 1993, 32, L514 CrossRef CAS.
  22. N. Donze, P. Pechy, M. Gratzel, M. Schaer and L. Zuppiroli, Chem. Phys. Lett., 1999, 315, 405 CrossRef CAS.
  23. C. W. Tang and S. A. VanSlyke, Appl. Phys. Lett., 1987, 51, 913 CrossRef CAS PubMed.
  24. Z. Shen, P. E. Burrows, V. Bulovic, S. R. Forrest and M. E. Thompson, Science, 1997, 276, 2009 CrossRef CAS.
  25. H. Aziz, Z. D. Popovic, N. Hu, A. Hor and G. Xu, Science, 1999, 283, 1900 CrossRef CAS.
  26. A. L. Rogach, N. Gaponik, J. M. Lupton, C. Bertoni, D. E. Gallardo, S. Dunn, N. L. Pira, M. Paderi, P. Repetto, S. G. Romanov, C. O'Dwyer, C. M. S. Torres and A. Eychmuller, Angew. Chem., Int. Ed., 2008, 47, 6538 CrossRef CAS PubMed.

Footnote

Electronic supplementary information (ESI) available: Experimental Section, characterization, Fig. S1–S30, Tables S1–S5 and an additional explanation for expanded FTIR graphs. See DOI: 10.1039/c4ra03341h

This journal is © The Royal Society of Chemistry 2014
Click here to see how this site uses Cookies. View our privacy policy here.