Liquid–liquid/solid three-phase high-speed counter-current chromatography based on O-carboxymethyl chitosan-functionalized multi-walled carbon nanotubes as solvent additive

Yanjuan Liuab, Yongfeng Liua, Gaohong Wangab and Duolong Di*a
aKey Laboratory of Chemistry of Northwestern Plant Resources and Key Laboratory for Natural Medicine of Gansu Province, Chinese Academy of Sciences, Lanzhou Institute of Chemical Physics, No. 18.Tianshui Middle Road, Lanzhou 730000, China. E-mail: didl@licp.cas.cn; Fax: +86 931 8277088; Tel: +86 931 4968248
bGraduate University of the Chinese Academy of Sciences, Beijing 100049, China

Received 10th April 2014 , Accepted 4th June 2014

First published on 4th June 2014


Abstract

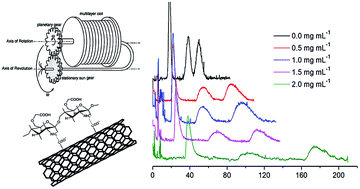
O-Carboxymethyl chitosan-functionalized multi-walled carbon nanotubes (MWCNTs/OMCS) were found to be a novel additive for high-speed counter-current chromatography (HSCCC). It was shown that a kind of liquid–liquid/solid (LLS) three-phase HSCCC system can be established with MWCNTs/OMCS as additive, and in this HSCCC system liquid–liquid partition chromatography and liquid–solid adsorption chromatography were combined. This study revealed that MWCNTs/OMCS can obviously improve peak resolution (Rs). Three flavonol aglycons (quercetin, luteolin and kaempferol) were used as model analytes to study the mechanisms of MWCNTs/OMCS as HSCCC solvent additive to improve Rs. It was indicated that MWCNTs/OMCS improved Rs not by increasing the stationary phase retention but by introducing intermolecular forces: electrostatic interaction, hydrogen bonding interaction and π–π conjugation.

1 Introduction

High-speed counter-current chromatography (HSCCC) first invented by Ito is a useful separation and purification technique.1 HSCCC is a unique form of liquid partition chromatography which negates the need of a solid matrix, and provides significant advantages over conventional column chromatographies by eliminating the irreversible absorption of the sample on the solid support. Moreover, the resolution, separation time and sample loading capacity of this method have been greatly improved over the past few decades. It has been widely used for the separation and purification of natural products.2 However, HSCCC yields low separation efficiency compared to HPLC due to its relatively low theoretical plates and single separation mechanism. It is very difficult to obtain good separation of two target compounds with similar structures by HSCCC even by changing the chromatography conditions: solvent system, mobile phase rate and temperature.3 Furthermore, highly polar compounds cannot be separated well by HSCCC due to the low retention of polar stationary phase.4 In order to improve the separation efficiency of HSCCC, the development of multiple separation mechanisms of HSCCC is needed. In recent years, many researchers have found that the separation efficiency of HSCCC can be improved by adding an additive into the solvent system.

Shengqiang Tong et al. added hydroxypropyl-β-cyclodextrin to the biphasic solvent system as chiral selector for HSCCC separation of phenylsuccinic acid (PSA), and the purities of (+)-PSA and (−)-PSA were over 98.5%.5 Using metal ions as additive to separate compounds by HSCCC has been reported. Yaoming Wen et al. found that silver nitrate, acted as a π-complexing agent, was added to the aqueous stationary phase to separate macrolide antibiotic components, and they got three components with high purities and yields. However, these results cannot be obtained with the same solvent system without the addition of silver ion.6 Agarose gel was suspended into the aqueous phase of two-phase solvent system to create a liquid–liquid/solid three-phase system. In this way, liquid–liquid partition chromatography and liquid–solid adsorption chromatography were combined in HSCCC making it possible to use HSCCC to separate high-polarity polyphenols in one step.4 In our previous study, chemical constitutes with similar structures from pollen of Brassica napus L. were successfully separated by HSCCC with ionic liquids (ILs) as the modifier of biphasic solvent system. This study demonstrated that the addition of ILs in the biphasic solvent system could make the screening of solvent system more effective.7

O-Carboxymethyl chitosan (OMCS), the carboxymethylated derivative of chitosan, possesses a CH2COOH modification at the C6 position of chitosan. OMCS has good biocompatibility, bioactivity, antibacterial activity, solubility in aqueous solutions and stability properties, which have been reported in some early papers.8 OMCS has been widely used in drug delivery, textile, food, papermaking and other fields.9 In our previous study, we found that OMCS as HSCCC solvent additive can improve peak resolution. On the basis of the chemical structures of OMCS and solutes, we speculated that OMCS improved resolution by introducing intermolecular forces including hydrogen bonding interaction and electrostatic interaction.10 We want to introduce more interaction forces to improve peak resolution better by adding additive to solvent system. So, on the basis of OMCS, π–π conjugated structure is going to be introduced.

Since multi-walled carbon nanotubes (MWCNTs) was firstly discovered by Lijima in 1991, its application prospect has attracted world-wide interest due to its high thermal stability, surface area and outstanding conductivity.11 MWCNTs has π–π conjugated structure and the self-assembly of MWCNTs and OMCS has been reported widely.12,13 The self-assembly product of MWCNTs and OMCS (MWCNTs/OMCS) contains not only the functional groups of OMCS but also conjugated structure from MWCNTs. The MWCNTs/OMCS composite material has been widely used for drug carrier, molecular recognition, electrochemical sensor and so on.14 To the best of our knowledge, MWCNTs/OMCS has not been used in the separation and purification science until now. In this study, we used MWCNTs/OMCS as the additive of biphasic solvent system to establish a liquid–liquid/solid three-phase model to improve the separation efficiency of HSCCC and studied the mechanisms.

2 Experimental

2.1 Apparatus

In this study, a Spectrum HSCCC instrument (DE Spectrum Centrifuge) (Dynamic Extractions Co. Ltd., Slough, UK) equipped with two bobbins was employed. Each bobbin of the HSCCC fits one analytical column and one preparative column made of polytetrafluroethylene (PTFE). The column volumes of analytical column and preparative column are 14.0 mL of 0.8 mm ID and 72.0 mL of 1.6 mm ID, respectively. The β-value is defined as β = r/R, where r is the coiled tubing radius and R is the revolution radius or the distance between the holder axis and central axis of the centrifuge. In this case, β-values of the multilayer coil ranged from 0.64 (internal terminal) to 0.81 (external terminal). The maximum revolution speed of the Spectrum HSCCC instrument is limited to 1600 rpm. The HSCCC system was equipped with two preparative pumps NP7000 (Hanbon Sci. & Tec., Jiangsu, China), a NU3000 UV-vis detector (Hanbon Sci. & Tec., Jiangsu, China), a DLSB-10/40 °C constant temperature circulating instrument (Yarong Instruments Co. Ltd., Zhengzhou, China) and a CBS-A automatic fraction collector (Shanghai Huxi Analysis Instrument Factory Co. Ltd., Shanghai, China) to collect the fractions.

For HPLC analysis, we used an Agilent 1200 HPLC system (Agilent Technologies, Palo Alto, CA, USA) equipped with a G1322A vacuum degasser, a G1311A quaternary pump, a G1315D diode array detector (DAD) and a G1328B manual injection valve with a 20.0 μL loop. The system was controlled by Agilent Chemstation software (version A.10.02) (Agilent Technologies, Palo Alto, CA, USA). In addition, a SinoChrom ODS-BP analytical column (250 mm × 4.6 mm i.d., 5 μm, Elite, Dalian, China) was used. The viscosity was measured by a NDJ-8S digital viscometer (Shanghai Sunny Hengping Scientific Instrument Co., Ltd, Shanghai, China). Infrared spectra was obtained from a Nexus-870 FT-IR spectrometer (Nicolet, Madison, WI, USA) with a pellet of powdered potassium bromide and adsorbent in the range of 400–4700 cm−1. Transmission electron microscopy (TEM) image was performed on the TECNAI G2 F20 high-resolution transmission electron microscopy under a working voltage of 200 kV. Energy-dispersive X-ray spectroscopy (EDX) measurement was obtained on scanning electron microscopy (SEM, JEOL JSM-5600LV), equipped with energy dispersive X-ray spectroscopy.

2.2 Reagents, standards and samples

n-Hexane used for HSCCC separation was of analytical grade and purchased from Zhongqin Chemical Reagent Co., Ltd. (Shanghai, China). Ethyl acetate and methanol used in HSCCC were of analytical grade and purchased from Yantai Shuangshuang Chemical Co., Ltd. (Shandong, China). Methanol used for HPLC analysis was of chromatographic grade and purchased from Yuwang Group Co., Ltd. (Shandong, China). Ultrapure water, used for preparation of all the samples and solutions, was obtained from a Spring-R10 water purification system (Research Scientific Instrument Co., Ltd, Xiamen, China). O-Carboxymethyl chitosan was purchased from Zhejiang Aoxing Biotechnology Co., Ltd. (Zhengjiang, China). Multi-walled carbon nanotubes (MWCNTs as a raw control, purity: CNTs >95%, diamteter 8–15 nm, length 0.5–2 μm, specific surface area >60 m2 g−1) was supplied by Chengdu Institute of Organic Chemistry, Chinese Academy of Sciences (Chengdu, China).

2.3 Preparation of MWCNTs-COOH

MWCNTs (100.0 mg) was stirred in a mixture of 98% H2SO4 and 65% HNO3 (32.0 mL, v/v = 3[thin space (1/6-em)]:[thin space (1/6-em)]1) at 70 °C and refluxed for 6 h. Then, 10-fold ultrapure water was added; the solution was thoroughly shaken and left to stratify. The lower black solution was filtered through a 0.22 μm filter. The cut MWCNTs-COOH were thoroughly washed by ultrapure water until the pH of filtrate was about 7.0 and then dried at 40 °C for 24 h.

2.4 Preparation of MWCNTs/OMCS

MWCNTs-COOH (20.0 mg) was dispersed in 20.0 mL ultrapure water. 200.0 mg OMCS was dissolved in 20.0 mL ultrapure water. MWCNTs-COOH solution was dropped into OMCS solution. The above mixture was stirred at room temperature for 16 h. Then, the self-assembly MWCNTs/OMCS was filtered by a 0.45 μm filter, washed by ultrapure water to remove the excessive OMCS and lyophilized.

2.5 Selection of two phase solvent system

The selection of biphasic solvent system was based on K value (0.5 < K < 2.0) of each target compound. The K value was determined by HPLC as follows: a suitable amount of sample was added into a 5.0 mL test tube, then 2.0 mL of each pre-equilibrated two phases solvent system were added. The test tube was then stoppered and violently shaken to thoroughly equilibrate the sample between two phases. The two phases were separated and dried in vacuum; the lower and upper-phase samples were dissolved in equal volume of methanol; then, 20.0 μL of the upper and lower phases were measured by HPLC to determine the K values. The K value was expressed as the ratio of the peak area of target compounds in the lower phase to that in the upper phase in normal-phase HSCCC.

2.6 Measurement of settling time

The measurement of settling time was performed as follows:15 liquid–liquid (LL) two-phase and liquid–liquid/solid (LLS) three-phase systems were prepared and completely equilibrated. 3.0 mL upper phase and 3.0 mL lower phase were delivered into a 10.0 mL test tube. The test tube was violently shaken to make the two phases thoroughly mix and then left to rest in order to measure the time required for the two phases to form clear layers with a distinct interface.

2.7 Measurement of the viscosity and density

Viscosity of LLS and LL solvent systems were measured as follows: a series of solvent systems composed of n-hexane–ethyl acetate–methanol–water at a volume ratio of 5[thin space (1/6-em)]:[thin space (1/6-em)]6.5[thin space (1/6-em)]:[thin space (1/6-em)]5[thin space (1/6-em)]:[thin space (1/6-em)]6.5 were prepared in separated funnels; different amount of MWCNTs/OMCS was added to the above prepared solvent systems; all the solvent systems were shaken violently and allowed to thoroughly equilibrate at room temperature; 100.0 mL upper and lower phase of each solvent system were put into a 250.0 mL beaker; the measurement of viscosity was carried out at room temperature by NDJ-8S digital viscometer equipped with a 0 rotor. 60 rpm shear rate was applied in the viscosity measurement. The density of each phase was simply measured by weighing 5.0 mL upper and lower phase of each solvent system and the density was calculated with the formula: ρ = m/v, where ρ is density, m and v refer to weight and volume, respectively.

2.8 HSCCC separation procedure

2.8.1 Preparation of the biphasic solvent system and sample solution. The selected LLS three-phase and LL two-phase solvent systems composed of n-hexane–ethyl acetate–methanol–water (5[thin space (1/6-em)]:[thin space (1/6-em)]6.5[thin space (1/6-em)]:[thin space (1/6-em)]5[thin space (1/6-em)]:[thin space (1/6-em)]6.5, v/v/v/v) and different amount of MWCNTs/OMCS were prepared to separate flavonol aglycons. The LLS three-phase and LL two-phase solvent systems were firstly mixed in a separation funnel by repeated vigorous shaking, and then left to equilibrate at room temperature. The two liquid phases were separated and degassed by ultrasonication for 30 min shortly before use. Sample solution was prepared as follows: 1.0 mg of each flavonol aglycon (quercetin, luteolin and kaempferol) was dissolved in 1.0 mL of the solvent consisting of equal volume of each phase by sonication for analytical HSCCC separation.
2.8.2 HSCCC separation. Because “tail-to-head”-mode was used for HSCCC separation in this study, so at the beginning, the lower phase used as stationary phase was loaded into the HSCCC apparatus to fill the multilayer coiled column at a flow-rate of 5.0 mL min−1. As the apparatus was running at a revolution speed of 1600 rpm, the upper phase (mobile phase) was pumped into the column at a flow-rate of 0.8 mL min−1. After hydrodynamic equilibrium was reached as indicated by a clear mobile phase eluting at the outlet, the sample solution was finally applied into the separation column through the injection valve. The effluent from the outlet of the column was continuously monitored with UV-vis detector. All through the experiment, the separation temperature was controlled at 30 °C. The peak fractions were collected according to the elution profile.

2.9 Measurement of the effect of aqueous phase pH on HSCCC separation

A series of solvent systems (n-hexane–ethyl acetate–methanol–water, 5[thin space (1/6-em)]:[thin space (1/6-em)]6.5[thin space (1/6-em)]:[thin space (1/6-em)]5[thin space (1/6-em)]:[thin space (1/6-em)]6.5, v/v/v/v) containing 1.0 mg mL−1 MWCNTs/OMCS in the lower phase were prepared in separated funnels; all the solvent systems were shaken violently and allowed to thoroughly equilibrate at room temperature; the two phases were separated and the lower phases were adjusted to different pH values (pH = 2, 4, 6, 8, 10, 12); then the upper and lower phase were mixed, shaken violently and allowed to equilibrate again. Then, the HSCCC separation was the same as Section 2.8.2.

2.10 Measurement of the adsorption loss

Peak fractions of three flavonol aglycons with different amount of MWCNTs/OMCS (0.0 mg mL−1, 0.5 mg mL−1, 1.0 mg mL−1, 1.5 mg mL−1, 2.0 mg mL−1) as solvent additive were collected and evaporated to dryness under reduced pressure in room temperature. Then the residues were dissolved in 2.0 mL methanol and analyzed by HPLC. The peak area of the compounds was used to measure the adsorption loss caused by the addition of MWCNTs/OMCS.

2.11 HPLC Analysis

Reference standards and fractions separated by HSCCC were analyzed by HPLC. Flavonol aglycons were analyzed with SinoChrom ODS-BP analytical column using a gradient of water (A) and methanol (B). The gradient condition was as follows: 0–25 min, 50–81% B at a temperature of 30 °C. The flow-rate was kept at 1.0 mL min−1 for the over run. The effluent was monitored at 360 nm. All of the mobile phase was filtered through a 0.45 μm Millipore filter before use.

3 Results and discussion

3.1 Synthesis and characterization of MWCNTs-COOH and MWCNTs/OMCS

–COOH was grafted on the surface of MWCNTs to enhance the dispersion and stability of MWCNTs. The functionalization of MWCNTs was accomplished using a modified method reported before.16 As shown in Fig. 1, MWCNTs was carboxylated with mixed acid (a mixture of 98% H2SO4 and 65% HNO3, v/v = 3[thin space (1/6-em)]:[thin space (1/6-em)]1), and carboxylic acid groups were formed on the surfaces of MWCNTs. The structure of MWCNTs-COOH was characterized by FTIR spectra. As shown in Fig. 2, the stretching vibration of carboxylic acid groups at 1725 cm−1 clearly demonstrates that the treatment of MWCNTs with mixed acids introduced carboxyl groups on the nanotube surface.17
image file: c4ra03222e-f1.tif
Fig. 1 The scheme demonstrating the synthesis of MWCNTs/OMCS.

image file: c4ra03222e-f2.tif
Fig. 2 FTIR spectra of MWCNTs, OMCS, MWCNTs-COOH and MWCNTs/OMCS.

Composite formed by self-assembly via electrostatic attraction has good thermostability and long-term stability.18 OMCS is positively charged due to the protonation effect of its amino and MWCNTs-COOH is negatively charged, so OMCS and MWCNTs-COOH can self-assemble into composite by electrostatic attraction. The way of MWCNTs-COOH functioned with OMCS was based on the method described in the previous literature (Fig. 1).19 As shown in Fig. 2, the characteristic peak at 1650 cm−1 is the stretching vibration of amide on OMCS; while the stretching vibration of –OH occurs at 3300 cm−1. As shown in Fig. 3 (the TEM image of MWCNTs/OMCS), the surface of MWCNTs/OMCS is unsmooth indicating that OMCS was absorbed on MWCNTs-COOH. Table 1 shows the elemental composition of MWCNTs-COOH and MWCNTs/OMCS. As shown in Table 1, the O content is 18.75% indicating the oxidation of MWCNTs was achieved, and there is a little of S which was introduced by the oxidation reaction and was not wiped off thoroughly. Table 1 shows that N appeared in MWCNTs/OMCS and its content is 2.88%. The FTIR, TEM spectra and the result of EDX suggested that MWCNTs-COOH and OMCS had self-assembled into MWCNTs/OMCS composite successfully.


image file: c4ra03222e-f3.tif
Fig. 3 The TEM spectra of MWCNTs/OMCS.
Table 1 Elemental composition of MWCNTs-COOH and MWCNTs/OMCS
Compounds Atomic percent (%)
C O N S
MWCNTs-COOH 81.01 18.75 0.00 0.24
MWCNTs/OMCS 82.39 14.73 2.88 0.00


Two kinds of LLS three phase systems were established using MWCNTs/OMCS as additive to check the suitability of MWCNTs/OMCS in HSCCC. One based on n-hexane–ethyl acetate–methanol–water (5[thin space (1/6-em)]:[thin space (1/6-em)]6.5[thin space (1/6-em)]:[thin space (1/6-em)]5[thin space (1/6-em)]:[thin space (1/6-em)]6.5, v/v/v/v) and the other on chloroform–methanol–water (4[thin space (1/6-em)]:[thin space (1/6-em)]3[thin space (1/6-em)]:[thin space (1/6-em)]2, v/v/v). Fig. 4 shows the suspension of MWCNTs/OMCS when established in the lower phase (aqueous phase) of n-hexane–ethyl acetate–methanol–water (Fig. 4A) and in the upper phase (aqueous phase) of chloroform–methanol–water biphasic solvent system (Fig. 4B), respectively. From Fig. 4, we can know that MWCNTs/OMCS can only suspend in the phase containing water, so MWCNTs/OMCS is fit to be used as the additive of HSCCC. Moreover, a major advantage of MWCNTs/OMCS is its chemical and thermal stability, which is benefit for HSCCC separation.


image file: c4ra03222e-f4.tif
Fig. 4 Liquid–liquid/solid three-phase systems. (A) n-Hexane–ethylacetate–methanol–water (5[thin space (1/6-em)]:[thin space (1/6-em)]6.5[thin space (1/6-em)]:[thin space (1/6-em)]5[thin space (1/6-em)]:[thin space (1/6-em)]6.5, v/v/v/v) with MWCNTs/OMCS (1.0 mg mL−1) in aqueous phase. (B) Chloroform–methanol–water (4[thin space (1/6-em)]:[thin space (1/6-em)]3[thin space (1/6-em)]:[thin space (1/6-em)]2, v/v/v) with MWCNTs/OMCS (1.0 mg mL−1) in aqueous phase.

3.2 Selection of solvent system and other conditions of HSCCC

Some requirements must be satisfied when a solvent system is considered as a candidate for HSCCC separation: (a) the ideal partition coefficient (K) values of target compounds should be in a proper range (usually between 0.5 and 2.0);20 (b) the separation factor (α = K1/K2, where K1 > K2) should be greater than 1.5, so two compounds can be separated well;21 (c) the settling time of biphasic solvent system should be shorter than 20 s, which is vital for the stationary phase retention;21 (d) the retention of stationary phase has quite direct relation with peak resolution: good stationary phase retention usually generates good resolution.22 In our previous research, the partition coefficients of flavonol aglycons (Fig. 5) were measured in biphasic solvent systems composed of n-hexane–ethyl acetate–methanol–water with different volume ratios. At last, n-hexane–ethyl acetate–methanol–water at a volume ratio of 5[thin space (1/6-em)]:[thin space (1/6-em)]6.5[thin space (1/6-em)]:[thin space (1/6-em)]5[thin space (1/6-em)]:[thin space (1/6-em)]6.5 which had suitable K values was chosen as the solvent system.10 This solvent system was still used in this present study.
image file: c4ra03222e-f5.tif
Fig. 5 Chemical structures of flavonol aglycons.

In the present study, in consideration of the limitation resulted from using a UV detector, lower phase containing MWCNTs/OMCS has to be used as stationary phase in a “tail to head” mode (normal phase HSCCC). However, this HSCCC mode usually lead to poor retention of stationary phase which is disadvantage to the peak resolution. In this study, measurement of the settling time of biphasic solvent system was used to forecast the retention of stationary phase.23 The settling time is significantly influenced by the viscosity and dielectric constants of solvent system.4 As shown in Table 2, the settling time of the solvent systems (n-hexane–ethyl acetate–methanol–water, 5[thin space (1/6-em)]:[thin space (1/6-em)]6.5[thin space (1/6-em)]:[thin space (1/6-em)]5[thin space (1/6-em)]:[thin space (1/6-em)]6.5, v/v/v/v) containing different amount of MWCNTs/OMCS in lower phase increased with the increase of the additive amount of MWCNTs/OMCS. This can be explained by the fact that the addition of MWCNTs/OMCS made the viscosity of solvent systems increase and emulsification easily appear. When the concentration of MWCNTs/OMCS was more than 2.0 mg mL−1 in the aqueous phase, the settling time was above 29 s, which is detrimental to the stationary phase retention. In the light of settling time and separation effect, the additive amount of MWCNTs/OMCS which above 2.0 mg mL−1 was not tested. pH value of the aqueous phase was 6.

Table 2 A list of parameters of two-phase solvent systems (n-hexane–ethyl acetate–methanol–water at a volume ratio of 5[thin space (1/6-em)]:[thin space (1/6-em)]6.5[thin space (1/6-em)]:[thin space (1/6-em)]5[thin space (1/6-em)]:[thin space (1/6-em)]6.5) with MWCNTs/OMCS at different concentrations in aqueous phase
MWCNTs/OMCS (mg mL−1) Phase Viscosity (mpa. s) Density (g mL−1) STc (s)
a Upper phase of the solvent system.b Lower phase of the solvent system.c The settling time.
0.0 Ua 1.5 0.777 17
Lb 3.8 0.941
0.5 U 1.5 0.775 20
L 4.1 0.943
1.0 U 1.5 0.775 22
L 4.2 0.930
1.5 U 1.5 0.776 26
L 4.3 0.933
2.0 U 1.5 0.776 29
L 4.5 0.940


3.3 Separation of standards by HSCCC with MWCNTs/OMCS as additive in stationary phase

Flavonol aglycons (quercetin, luteolin and kaempferol) were used as model analytes to investigate the mechanism of MWCNTs/OMCS as the additive of HSCCC solvent system. pKa values of kaempferol, luteolin and quercetin are 7.05, 6.50 and 6.30, respectively. The lower pKa value is, the more hydroxyl active sites there are and the stronger the retention is.24 However, as shown in Fig. 6, the flavonol aglycons kaempferol, quercetin and luteolin display the same elution order in the LLS three-phase system and LL two-phase system composed of n-hexane–ethyl acetate–methanol–water at a volume ratio of 5[thin space (1/6-em)]:[thin space (1/6-em)]6.5[thin space (1/6-em)]:[thin space (1/6-em)]5[thin space (1/6-em)]:[thin space (1/6-em)]6.5 with/without MWCNTs/OMCS in the stationary aqueous phase using the organic phase as mobile phase. Tentatively this may be interpreted as that it is still the partition in the biphasic solvent system that governed the retardation and adsorption only takes subsidiary function.
image file: c4ra03222e-f6.tif
Fig. 6 Separation of flavonol aglycons by analytical HSCCC mode with different additive amount of MWCNTs/OMCS. Experimental conditions: Apparatus: Type-J coil planet centrifuge (DE Spectrum, 28.0 mL column volume with two coils of 0.8 mm ID tubing); solvent system: n-hexane–ethyl acetate–methanol–water 5[thin space (1/6-em)]:[thin space (1/6-em)]6.5[thin space (1/6-em)]:[thin space (1/6-em)]5[thin space (1/6-em)]:[thin space (1/6-em)]6.5 v/v/v/v with different concentrations of MWCNTs/OMCS in lower phase; sample: 2.0 mg of each quercetin, luteolin and kaempferol in 1.0 mL of equal volume of upper and lower phase; elution mode: lower aqueous phase was the stationary phase in a “tail-to-head” HSCCC mode; flow rate: 0.8 mL min−1; revolution speed: 1600 rpm; Sf: 65.0% (no additive), 64.3% (0.5 mg mL−1 and 1.0 mg mL−1), 58.9% (1.5 mg mL−1), 57.5% (2.0 mg mL−1); UV detection at 360 nm.

As shown in Fig. 6, the peak resolution (Rs) increased with the additive amount of MWCNTs/OMCS. As we all know, Rs has direct relationship with the retention of stationary phase (Sf). It was indicated that Sf is linearly decreasing with the square root of mobile phase flow rate.25

 
image file: c4ra03222e-t1.tif(1)
the constant A is related to the HSCCC column full of stationary phase (Sf = 100%) minus the dead volume, Vd, ratio (Vd/Vc, Vc refers to the column volume).25 The gradient B is related to the experimental conditions as:
 
image file: c4ra03222e-t2.tif(2)
where dc is the internal diameter of the coiled tube, μM is the mobile phase viscosity, ω is the rotor rotation speed, R is the rotor radius or distance between the spool axis and central axis, and ρ is the liquid phase density (U and L for respectively, upper and lower phase).25

As shown in Table 2, the densities of upper and lower phase almost did not change because the additive amount of MWCNTs/OMCS is too little to make the density vary. Meanwhile, the mobile phase viscosity (μM), which is the upper phase in this study, is constant. In addition, the same rotor rotation speed (1600 rpm) was used in this study. The above information told us that the gradient B in eqn (2) did not vary when the additive amount of MWCNTs/OMCS increased. The connecting dead volume (Vd) is constant, and A is invariable. At the same time, the same mobile phase flow rate (F = 0.8 mL min−1) was applied in each separation. Therefore, from eqn (1) we can know that MWCNTs/OMCS has no effect on the retention of Sf. So we speculate that MWCNTs/OMCS improves peak resolution by introducing intermolecular forces between itself and analytes.

In our previous research, we found that OMCS improved resolution by introducing intermolecular forces including hydrogen bond and electrostatic interaction. Now, the MWCNTs/OMCS composite (shown in Fig. 1) formed by self-assembly of MWCNTs and OMCS contains not only hydrogen bonding and electrostatic interaction sites but also π–π conjugation. So, hydrogen bond interaction, electrostatic interaction and π–π conjugation between MWCNTs/OMCS and quercetin, luteolin and kaempferol make the peak resolution improve. Fig. 6 shows that as the additive amount of MWCNTs/OMCS increased, the retardation of quercetin, luteolin and kaempferol became stronger and the tailing of solute peaks became seriously. Tentatively, this can be explained that liquid–liquid partition and liquid–solid adsorption were combined to play roles in the separation, and stronger intermolecular forces between MWCNTs/OMCS and the analytes generated due to more MWCNTs/OMCS was added. As shown in Fig. 7, compared with OMCS, the addition of the same amount of MWCNTs/OMCS into the stationary phase made the peak resolution between quercetin, luteolin and kaempferol increase more. This can be interpreted as more intermolecular forces are introduced by MWCNTs/OMCS than OMCS.


image file: c4ra03222e-f7.tif
Fig. 7 Comparison of the separation effect of OMCS and MWCNTs/OMCS. Experimental conditions: Apparatus: Type-J coil planet centrifuge (DE Spectrum, 28.0 mL column volume with two coils of 0.8 mm ID tubing); solvent system: n-hexane–ethyl acetate–methanol–water 5[thin space (1/6-em)]:[thin space (1/6-em)]6.5[thin space (1/6-em)]:[thin space (1/6-em)]5[thin space (1/6-em)]:[thin space (1/6-em)]6.5 v/v/v/v, with 2.0 mg mL−1 OMCS and 2.0 mg mL−1 MWCNTs/OMCS in lower phase; sample: 2.0 mg of each quercetin, luteolin and kaempferol in 1.0 mL of equal volume of upper and lower phase; elution mode: lower aqueous phase was the stationary phase in a “tail-to-head” HSCCC mode; flow rate: 0.8 mL min−1; revolution speed: 1600 rpm; Sf: 65.0% (no additive), 60.7% (2.0 mg mL−1 OMCS), 57.5% (2.0 mg mL−1 MWCNTs/OMCS); UV detection at 360 nm.

3.4 Effect of MWCNTs/OMCS on Rs

Peak resolution (Rs), which is a parameter to measure the separation effect of two adjacent chromatographic peaks, can be calculated with the formula:
 
Rs = 2(tR2tR1)/(W1 + W2) (3)
where tR2 and tR1 are the retention time of two adjacent peaks (tR2 > tR1); W1 and W2 are the baseline peak width.

As shown in Fig. 8, Rs1, the resolution of peak 1 and peak 2, decreased firstly and then increased with the MWCNTs/OMCS additive amount. However, Rs2 (the resolution of peak 2 and peak 3) increased all along. As shown in Fig. 6, peak 1 and peak 2 were baseline separated well with the LL two-phase system (n-hexane–ethyl acetate–methanol–water, 5[thin space (1/6-em)]:[thin space (1/6-em)]6.5[thin space (1/6-em)]:[thin space (1/6-em)]5[thin space (1/6-em)]:[thin space (1/6-em)]6.5, v/v/v/v). When MWCNTs/OMCS was suspended in the solvent system and liquid–solid adsorption was introduced, peak tailing of peak 2 became bad, so Rs1 decreased at first. When the MWCNTs/OMCS concentration was greater than 1.0 mg mL−1, the change of retention time was bigger than that of peak tailing, so Rs1 began to increase. As shown in Fig. 6, peak 2 and peak 3 were not baseline separated with LL two-phase solvent system containing no suspended MWCNTs/OMCS. After MWCNTs/OMCS was added and liquid–solid adsorption was introduced, the retention time gap between quercetin and luteolin became wider due to different intermolecular forces generated between MWCNTs/OMCS and analytes. Although peak 2 and peak 3 broadened as the increase of MWCNTs/OMCS additive amount, the change of retention time was more significant, so Rs2 increased all the time.


image file: c4ra03222e-f8.tif
Fig. 8 Effect of MWCNTs/OMCS concentration on resolution (Rs). Rs1: the resolution of peak 1 and peak 2; Rs2: the resolution of peak 2 and peak 3 (peaks are shown in Fig. 5).

3.5 Effect of the aqueous phase pH on the HSCCC separation

As shown in Fig. 9, MWCNTs/OMCS suspended in aqueous phase evenly when the pH was adjusted to 2, 4, 6 and 8. However, agglomeration appeared when the pH was greater than 10. This phenomenon can be explained that high alkalinity neutralized the H+ on the protonated nitrogen, therefore the electrostatic interaction between MWCNTs and OMCS was destroyed and the suspension reduced. So, the pH value of the lower phase solvent containing MWCNTs/OMCS cannot be greater than 10 when the solvent was used for HSCCC separation, otherwise, the column will be blocked. As shown in Fig. 10, Rs2 between peak 2 and peak 3 was not improved obviously when the pH of lower phase solvent containing MWCNTs/OMCS was lower than 4. However, Rs1 and Rs2 were both improved when the pH was 6 and 8. Tentatively this is interpreted such that hydrogen bonding is the main force between model analytes and MWCNTs/OMCS when acidity is high (pH ≤ 4); electrostatic interaction plays a vital role when the pH is slightly acidic and alkaline, however, electrostatic interaction is much stronger than hydrogen bonding. So the pH of aqueous phase solvent should be in the range of weak acid to weak base.
image file: c4ra03222e-f9.tif
Fig. 9 The effect of pH on the lower phase solvent.

image file: c4ra03222e-f10.tif
Fig. 10 The effect of pH on the HSCCC separation.

3.6 Adsorptivity of MWCNTs/OMCS for the model analytes

The adsorptivity of MWCNTs/OMCS for flavonol aglycons was examined. The sample size was same in each HSCCC performance with different additive amount of MWCNTs/OMCS (0.0 mg mL−1, 0.5 mg mL−1, 1.0 mg mL−1, 1.5 mg mL−1, 2.0 mg mL−1). The effluent from the outlet of the column was collected, dried and determined by HPLC. The peak area of each compound was used to evaluate the amount variation of the model analytes, as shown in Fig. 11, the peak area of flavonol aglycons kaempferol, quercetin and luteolin reduced with the increase of the additive amount of MWCNTs/OMCS. In other words, the addition of MWCNTs/OMCS indeed caused the loss of target compounds due to the strong adsorptivity of MWCNTs. However, the adsorption loss caused by the addition of MWCNTs/OMCS was not serious, and this loss can be acceptable when some compounds with similar K value and cannot be obtained by conventional HSCCC need to be separated.
image file: c4ra03222e-f11.tif
Fig. 11 The adsorption loss caused by the addition of MWCNTs/OMCS.

4 Conclusion

MWCNTs/OMCS was found to be a new additive of HSCCC solvent system and a new liquid–liquid/solid three-phase system was established. The mechanism of MWCNTs/OMCS to improve separation efficiency was investigated and intermolecular forces: hydrogen bond, electrostatic interaction and π–π conjugation introduced by MWCNTs/OMCS are the main reasons. We are undertaking further study on the use of MWCNTs/OMCS additive in preparative HSCCC and separation natural products from Chinese herbs. We intend to report the outcome of the studies in due course.

Acknowledgements

This research was financially supported by The National Natural Sciences Foundation of China (NSFC no. 20775083 and no. 21175142) and Open Fund of Key Laboratory of Chemistry of Northwestern Plant Resources of The Chinese Academy of Science (no. CNPR-2011kfkt-02).

References

  1. K. Shimizu, H. Kuribayashi, H. Watanabe, T. Shimasaki, K. Azuma, Y. Horie, K. Saitoh, S. Saito and M. Shibukawa, Anal. Chem., 2013, 85, 978–984 CrossRef CAS PubMed.
  2. H. Yin, S. Zhang, L. J. Long, H. Yin, X. P. Tian, X. M. Luo, H. H. Nan and S. He, J. Chromatogr. A., 2013, 1315, 80–85 CrossRef CAS PubMed.
  3. Y. Wei, K. Zhang, L. Yin, J. L. Du and G. L. Zhang, J. Sep. Sci., 2012, 35, 869–874 CrossRef CAS PubMed.
  4. D. Liu, Y. Ma, M. Gu, J. Jan-Christer, C. H. Wang and H. B. Xiao, J. Sep. Sci., 2012, 35, 2146–2151 CrossRef CAS PubMed.
  5. S. Q. Tong, J. Z. Yan, Y. X. Guan and Y. M. Lu, J. Chromatogr. A., 2011, 1218, 5602–5608 CrossRef CAS PubMed.
  6. Y. M. Wen, J. Y. Wang, X. M. Chen, Z. X. Le, Y. X. Chen and W. Zheng, J. Chromatogr. A., 2009, 1216, 4668–4672 CrossRef CAS PubMed.
  7. X. F. Chen, D. Pei, X. Y. Huang, Z. F. Feng and D. L. Di, Sep. Sci. Technol., 2013, 48, 2890–2899 CrossRef CAS.
  8. J. P. Nam, S. C. Park, T. H. Kim, J. Y. Jang, C. Y. Choi, M. K. Jang and J. W. Nah, Int. J. Pharm., 2013, 457, 124–135 CrossRef CAS PubMed.
  9. A. J. Zhao, X. B. Yuan and J. Chang, Polym. Bull., 2004, 4, 59–63 Search PubMed.
  10. Y. J. Liu, G. H. Wang, X. Y. Huang, Y. F. Liu and D. L. Di, New J. Chem., 2014, 38, 1150–1157 RSC.
  11. Y. K. Yang, G. Z. Fang, G. Y. Liu, M. F. Pan, X. M. Wang, L. J. Kong, X. L. He and S. Wang, Biosens. Bioelectron., 2013, 47, 475–481 CrossRef CAS PubMed.
  12. P. N. Venkatesan and S. Dharmalingam, J. Membr. Sci., 2013, 435, 92–98 CrossRef PubMed.
  13. Y. Wu, X. Feng, S. H. Zhou, H. Y. Shi, H. M. Wu, S. J. Zhao and W. B. Song, Microchim. Acta, 2013, 180, 1325–1332 CrossRef CAS.
  14. T. K. Zhao, G. M. Li, L. H. Liu and T. H. Li, Chin. J. of Nonferrous Met., 2010, 20, 1732–1736 CAS.
  15. D. B. Ren, Z. H. Yang, Y. Z. Liang, Q. Ding, C. Chen and M. L. Ouyang, J. Chromatogr. A., 2013, 1301, 10–18 CrossRef CAS PubMed.
  16. C. L. Lin, Y. F. Wang, Y. Q. Lai, W. Yang, F. Jiao, H. G. Zhang, S. F. Ye and Q. Q. Zhang, Colloids Surf., A, 2011, 83, 367–375 CAS.
  17. M. Terrones, N. Grobert, J. P. Zhang, H. Terrones, J. Olivares, W. K. Hsu, J. P. Hare, A. K. Cheetham, H. W. Kroto and D. R. M. Walton, Chem. Phys. Lett., 1998, 285, 299–305 CrossRef CAS.
  18. F. Yin, Z. X. Zhao, B. Y. Wu, X. S. Wang, Y. Y. Wang and Q. Chen, Chin. J. Anal. Chem., 2007, 35, 1021–1024 CAS.
  19. X. Zhang, L. Meng, Q. Lu and Z. Fei, Biomaterials, 2009, 30, 6041–6047 CrossRef CAS PubMed.
  20. Y. Ito, J. Chromatogr. A., 2005, 1065, 145–168 CrossRef CAS PubMed.
  21. S. He, H. Q. Wang, X. J. Yan, P. Zhu, J. J. Chen and R. Yang, J. Chromatogr. A., 2013, 1272, 15–19 CrossRef CAS PubMed.
  22. Y. Zeng, G. Liu, Y. Ma, X. Y. Chen and Y. Ito, J. Chromatogr. A., 2011, 1218, 8715–8717 CrossRef CAS PubMed.
  23. Y. Ito and W. D. Conway, J. Chromatogr., 1984, 301, 405–414 CrossRef CAS.
  24. O. N. Fedyanina and P. N. Nesterenko, Russ. J. Phys. Chem. A, 2010, 84, 476–480 CrossRef CAS.
  25. K. Faure, E. Bouju, P. Suchet and A. Berthod, Anal. Chem., 2013, 85, 4644–4650 CrossRef CAS PubMed.

This journal is © The Royal Society of Chemistry 2014
Click here to see how this site uses Cookies. View our privacy policy here.