DOI:
10.1039/C4RA03087G
(Paper)
RSC Adv., 2014,
4, 27708-27713
Incorporating Ce3+ into a high efficiency phosphor Ca2PO4Cl:Eu2+ and its luminescent properties†
Received
7th April 2014
, Accepted 17th June 2014
First published on 18th June 2014
Abstract
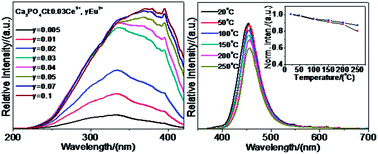
A series of Ce3+, Eu2+ and Ce3+/Eu2+ doped Ca2PO4Cl phosphors are synthesized by a high temperature solid-state method. Not only is the emission intensity of Ca2PO4Cl:Eu2+ obviously enhanced by codoping Ce3+, but also the spectral profile of the excitation band is almost not influenced. The energy transfer from Ce3+ to Eu2+ in Ca2PO4Cl has been validated and proved to be a resonant type via a dipole–dipole interaction. Under the 400 nm radiation excitation, the luminescent intensity of Ca2PO4Cl:Ce3+, Eu2+ is found to be about 200% that of Ca2PO4Cl:Eu2+, and 300% that of BaMgAl10O17:Eu2+. The thermal quenching properties reveal that Ca2PO4Cl:Ce3+, Eu2+ has excellent characteristics. Therefore, Ca2PO4Cl:Ce3+, Eu2+ may have potential application as a blue-emitting phosphor for white LEDs.
1 Introduction
In recent years, there has been growing importance focused on research on light emitting diodes (LEDs) because of their long operation lifetime, energy-saving features and high material stability.1 Therefore, white LEDs are promising candidates to replace conventional incandescent and fluorescent lamps. At present, the most wide used method to obtain white emission is the combination of a blue LED chip and a yellow phosphor YAG:Ce. However, the white LEDs exhibit a high correlated color temperature (CCT ≈ 7750 K) and a poor color rendering index (CRI ≈ 70–80), because they are lack of red component.2 During the past few years, white LEDs fabricated using a near ultraviolet (n-UV) LED (380–420 nm) coupled with red, green and blue phosphors have attracted much attention.3 The most frequently used blue phosphor for n-UV LED is BaMgAl10O17:Eu2+ (BAM).4 However, the absorption of BAM for wavelength above 400 nm is quite poor. Accordingly, it is urgent to develop new blue phosphors that could be effectively excited in the n-UV range especially for wavelength of 400 nm.5–7 For example, Song et al. investigated the luminescent property of RbBaPO4:Eu2+;8 Liu et al. synthesized a high efficiency and high color purity blue-emitting phosphor NaSrBO3:Ce3+.9 Moreover, in order to effectively improve the luminescence of phosphor, the interest in this field arises because the energy transfer from a donor to an acceptor. Actually, the energy transfer from the donor (sensitizer) Ce3+ to the acceptor (activator) Eu2+ has been already reported. For example, the energy transfer from Ce3+ to Eu2+ in LiSr4(BO3)3 is studied, and the emission color of phosphor can be tuned by appropriate adjustment of the relative proportion of Ce3+/Eu2+, and the energy transfer mechanism of Ce3+ → Eu2+ in LiSr4(BO3)3 is the dipole–dipole interaction.10 Actually, for many compounds, such as SrSi2O2N2, CaSi2O2N2, Ba1.3Ca0.7SiO4, Sr3Gd(PO4)3, Ca9Y(PO4)7, NaMg4(PO4)3, NaMgPO4, Ca8Gd2(PO4)6O2 and BaMg2(PO4)2, the similar types of Ce3+ → Eu2+ energy transfer are also observed.11–19 Obviously, the Eu2+ emission can be efficiently enhanced by Ce3+ → Eu2+ energy transfer. Hence, the exploration of material can effectively support our demand and guarantee the continuation of progress. Ca2PO4Cl:Eu2+ which has the excellent internal and external quantum efficiencies, the intense emission, the high quantum efficiency and excellent thermal stability,20 and may serve as a potential candidate for n-UV LED. Therefore, in the present work, we tentatively introduced Ce3+ into Ca2PO4Cl:Eu2+ to enhance its emission intensity. The energy transfer from Ce3+ to Eu2+ is systematically studied using the photoluminescence excitation and emission spectra, and lifetimes, and the thermal quenching property of Ca2PO4Cl:Ce3+, Eu2+ is also investigated.
2 Experimental
2.1 Sample preparation
A series of Ca2−x−yPO4Cl:xCe3+, yEu2+ (x, y molar concentration) samples are synthesized by a high temperature solid-state method. The initial materials, including CaCO3 (A.R.), CaCl2·6H2O (A.R.), NH4H2PO4 (A.R.), CeO2 (99.99%) and Eu2O3 (99.99%), are weighed in stoichiometric proportion, thoroughly mixed and ground by an agate mortar and pestle for more than 30 min till they are uniformly distributed. The obtained mixtures are heated at 1000 °C for 2 h in crucibles along with a reducing atmosphere (5% H2/95% N2), and then are naturally cooled to room temperature. In order to measure the characteristics of the phosphor, the samples are ground into powder.
2.2 Materials characterization
The phase formation is determined by X-ray diffraction (XRD) in a Bruker AXS D8 advanced automatic diffractometer (Bruker Co., German) with Ni-filtered Cu Kα1 radiation (λ = 0.15405 nm), and a scan rate of 0.02° s−1 is applied to record the patterns in the 2θ range from 10° to 70°. The steady time resolved photoluminescence spectra are detected by a FLS920 fluorescence spectrometer, and the exciting source is a 450 W Xe lamp. The curve fittings are performed on the luminescence decay curves to confirm the decay time. The Commission International de I'Eclairage (CIE) chromaticity coordinates of sample are measured by a PMS-80 spectra analysis system. All measurements are carried out at room temperature.
3 Results and discussion
3.1 Phase formation
The XRD patterns of Ca2PO4Cl:Ce3+, Ca2PO4Cl:Eu2+ and Ca2PO4Cl:Ce3+, Eu2+ are measured and a similar diffraction patterns are observed for each sample. As a representative, Fig. 1 shows the XRD patterns of Ca2PO4Cl:0.03Ce3+, Ca2PO4Cl:0.07Eu2+, Ca2PO4Cl:0.03Ce3+, 0.07Eu2+. Compared the diffraction data with the standard JCPDS card (no. 19-0247), and there has no difference between the doped impurity Ca2PO4Cl and the pure Ca2PO4Cl. The uniform diffraction patterns indicate that the phase formation of Ca2PO4Cl is not influenced by a little amounts of Ce3+, Eu2+, or Ce3+/Eu2+. Ca2PO4Cl which crystallizes in the orthorhombic system with space group of Pbcm(57) and with four formula units per unit cell (N = 4), and the dimensions of unit cell are a = 0.6185 nm, b = 0.6983 nm and c = 1.082 nm.20–25
 |
| | Fig. 1 XRD patterns of Ca2PO4Cl:0.03Ce3+, Ca2PO4Cl:0.07Eu2+ and Ca2PO4Cl:0.03Ce3+, 0.07Eu2+. The standard data of Ca2PO4Cl (JCPDS no. 19-0247) is shown as reference. | |
3.2 Luminescent properties of Ce3+, Eu2+ and Ce3+/Eu2+ in Ca2PO4Cl
Fig. 2a presents Ca2PO4Cl:0.07Eu2+ has a broad emission band under the 370 nm radiation excitation, and the peak locates at 450 nm which is typically attributed to the 4f65d1 → 4f7 electronic dipole allowed transition of Eu2+ ion. Because two different crystallographic sites are available for the divalent Ca2+ ions, one with site symmetry C2 and the other with site symmetry CS. Therefore, Eu2+ ions may occupy two different Ca2+ sites.20 The excitation band is observed to mainly consist of unresolved band due to the 4f7 → 4f65d1 transition of Eu2+ ion. When the Eu2+ ions occupy the lattice sites with C2 or CS symmetry in Ca2PO4Cl, the fivefold degeneracy of the 5d levels is expected in the excitation spectrum. Nevertheless, the dominating bands in the excitation spectrum is difficult to resolve because of serious overlap between 5d levels. The broad excitation band is ascribed to the high covalency of CaEu–Cl bonding and large crystal-field splitting. The inset of Fig. 2a shows the emission intensity of Ca2PO4Cl:Eu2+ as function of Eu2+ doping content, and the optimal doping content is 0.07 mol.
 |
| | Fig. 2 Emission and excitation spectra of (a) Ca2PO4Cl:0.07Eu2+ and (b) Ca2PO4Cl:0.03Ce3+. The inset: (a) the emission intensity of Ca2PO4Cl:0.07Eu2+ as function of Eu2+ doping content (λex = 370 nm); (b) the emission spectrum of Ca2PO4Cl:xCe3+ (λex = 334 nm). | |
Fig. 2b depicts Ca2PO4Cl:0.03Ce3+ exhibits a strong broad emission band between 320–500 nm under the 334 nm radiation excitation, and the emission peak locates at 367 nm due to the 4f05d1 → 4f1 transition of Ce3+ ion. The excitation spectrum shows broad band from 200 to 350 nm, and the peaks locate at 268 nm and 334 nm, respectively, which correspond to the 4f1 → 4f05d1 transition of Ce3+ ion.20–22 The inset of Fig. 2b presents the emission spectra of Ca2PO4Cl:Ce3+ with the different Ce3+ doping content. The emission spectra have no obvious change in the wavelength and band shape with increasing the Ce3+ doping content, which indicated that the crystal-field strength experienced by the activator does not change. In other words, doping into the lattice site does not cause the expansion or shrinkage of the unit cell, as revealed by the XRD data. However, the emission intensity of Ca2PO4Cl:Ce3+ is influenced by the Ce3+ doping content, and the optimal doping content is 0.03 mol Ce3+, and the concentration quenching effect is also observed.
Generally, the trivalent rare earths ions, such as Ce3+, substitute for the bivalent alkaline earth, such as Ca2+, in the compound, there has the charge unbalance which may result in the formation of defects in the phosphor. Hence the incorporation of alkali metal ions might offset the charge unbalance generated by Ce3+ ion substitution for Ca2+ ion, reduced the lattice distort, and affected the luminescent properties.26–28 Among the radii of Li+, Na+ and K+, there has the slightest difference between Na+ and Ca2+ ions, Therefore, Na+ ion may lead to the slightest negative influence on the luminescence of Ce3+ in Ca2PO4Cl. Under the 334 nm radiation excitation, the emission spectra of Ca2PO4Cl:0.03Ce3+, and Ca2PO4Cl:0.03Ce3+, 0.03Na+ are shown in Fig. S1 (ESI).† The results present that the two phosphors have the same spectral profile, however, the emission intensity of Ca2PO4Cl:0.03Ce3+, 0.03Na+ is appreciably stronger than that of Ca2PO4Cl:0.03Ce3+. The results indicate that incorporating Na+ into Ca2PO4Cl:Ce3+ has no negative influence on the luminescence of Ca2PO4Cl:Ce3+, to some extent, can enhance its emission intensity. In the present work, the research focuses on the luminescence and energy transfer of Ce3+ → Eu2+ in Ca2PO4Cl. Therefore, the problem of charge compensation is no longer discussed.
As shown in Fig. 2, there has an obvious spectral-overlap between the emission spectrum of Ce3+ and the excitation spectrum of Eu2+, indicating the possibility of energy transfer from Ce3+ to Eu2+ in Ca2PO4Cl. Under the Ce3+ 334 nm excitation peak, the spectra of Ca2PO4Cl:0.03Ce3+, yEu2+ (y = 0–0.1) are measured and shown in Fig. 3. With the lower Eu2+ doping content, there has both Ce3+ and Eu2+ emission bands, and the emission intensities of Ce3+ decrease with increase the Eu2+ doping content. With the higher Eu2+ doping content, such as 0.05 mol Eu2+, the Ce3+ emission disappears, only the Eu2+ emission exists in the spectra of Ca2PO4Cl:0.03Ce3+, yEu2+. The results mean that the energy transfer from Ce3+ to Eu2+ in Ca2PO4Cl is validated. Fig. S2 (ESI)† depicts the emission spectra of Ca2PO4Cl:0.07Eu2+, Ca2PO4Cl:0.03Ce3+, 0.07Eu2+ and BaMgAl10O17:Eu2+ under the 400 nm radiation excitation. The results obviously present that the luminescent intensity of Ca2PO4Cl:Ce3+, Eu2+ is found to be about 200% as high as that of Ca2PO4Cl:Eu2+, and 300% as high as that of BaMgAl10O17:Eu2+.
 |
| | Fig. 3 Emission spectra of Ca2PO4Cl:0.03Ce3+, yEu2+ (λex = 334 nm). The inset: variation of ηT for Ca2PO4Cl:0.03Ce3+, yEu2+ (y = 0–0.1) with the Eu2+ doping content. | |
Generally, the energy transfer efficiency (ηT) from a sensitizer to an activator can be expressed according to Paulose et al.29
where
IS0 and
IS are the luminescent intensities of the sensitizer in the absence and presence of the activator. In fact, for Ce
3+/Mn
2+, Eu
2+/Mn
2+, Ce
3+/Eu
2+ and Ce
3+/Tb
3+ codoped phosphors, the energy transfer efficiency can be easily achieved using
eqn (1),
30–33 generally, the energy transfer efficiency (
ηT) from the sensitizer to the activator gradually increases with increase the activator doping content. In the present work, In order to well understand the energy transfer process, using
eqn (1), the energy transfer efficiencies (
ηT) Ce
3+ → Eu
2+ of Ca
2PO
4Cl:Ce
3+,
yEu
2+ (
y = 0–0.1) are calculated, and shown in the inset of
Fig. 3. As a result, the
ηT is found to gradually increase with enhancing the Eu
2+ doping content. The results mean that the efficient energy transfer Ce
3+ → Eu
2+ exist in Ca
2PO
4Cl.
For the 450 nm emission of Ca2PO4Cl:0.03Ce3+, yEu2+, the corresponding excitation spectra are shown in Fig. 4. It can be seen from Fig. 2, Ca2PO4Cl:Eu2+ has an obvious absorption in the range of 300–355 nm, and Ca2PO4Cl:Ce3+ presents a strong excitation band from 300 to 340 nm. However, Ca2PO4Cl:Ce3+ has weaker absorption in the range of 345–355 nm. Therefore, though the intensity of excitation band (from 330 to 355 nm) increases with enhancing the amount of Eu2+ doping content. In fact, the corresponding excitation band which is common to the 4f7 → 4f65d1 transition of Eu2+ ion and the 4f1 → 4f05d1 transition of Ce3+ ion. Hence the increase of intensity (330–355 nm) comes from the emission of Eu2+, not Ce3+. In other words, the results mean that the excitation characteristics of Ce3+ decreases, and that of Eu2+ increases. Especially, there has only the excitation characteristics of Eu2+ with further increase the Eu2+ doping content, viz., the efficient energy transfer from Ce3+ to Eu2+ ought to exist in Ca2PO4Cl.
 |
| | Fig. 4 Excitation spectra of Ca2PO4Cl:0.03Ce3+, yEu2+ (λem = 450 nm). | |
To further validate the process of energy transfer, the fluorescence lifetimes, τ, for Ce3+ with the different Eu2+ doping content are measured, as a representative, the results of Ca2PO4Cl:0.03Ce3+, Ca2PO4Cl:0.03Ce3+, 0.01Eu2+, Ca2PO4Cl:0.03Ce3+, 0.05Eu2+ and Ca2PO4Cl:0.03Ce3+, 0.07Eu2+ are shown in Fig. 5 (λex = 334 nm, λem = 367 nm). The decay curves are well fitted with a second-order exponential decay mode by eqn (2)34–36
| | |
I = A1 exp(−t/τ1) + A2 exp(−t/τ2)
| (2) |
where
I is the luminescence intensity;
A1 and
A2 are constants;
t is the time, and
τ1 and
τ2 are the lifetimes for the rapid and slow decays, respectively. The average lifetimes (
τ*) can be calculated by the formula as follow
34–36| | |
τ* = (A1τ12 + A2τ22)/(A1τ1 + A2τ2)
| (3) |
 |
| | Fig. 5 Decay curves of Ce3+ emission monitored at 367 nm for Ca2PO4Cl:0.03Ce3+, yEu2+ (λex = 334 nm). | |
For Ca2PO4Cl:0.03Ce3+, yEu2+ (y = 0–0.1), the calculated average lifetimes (τ*) are 52.96, 43.69, 35.51, 29.68, 23.89, 17.98, 14.91, 10.02 and 6.87 ns, respectively. The energy transfer efficiency (ηT) can be calculated using the following equation29, 37–39
| | |
ηT = 1 − (IS/IS0) ≈ 1 − (τS/τS0)
| (4) |
where
τS0 and
τS are the decay lifetimes of the sensitizer Ce
3+ in the absence and presence of the activator Eu
2+. With increase the Eu
2+ doping content, the
ηT value is calculated and shown in
Fig. 6. And the energy transfer efficiency from Ce
3+ to Eu
2+ gradually increases with enhancing the Eu
2+ doping content. At 0.1 mol Eu
2+, the energy transfer efficiency is 87.03%.
 |
| | Fig. 6 Variation of ηT for Ca2PO4Cl:0.03Ce3+, yEu2+ (y = 0–0.1) with the Eu2+ doping content. | |
On the basis of Dexter's energy transfer formula for exchange and multipolar interactions, the following relation can be obtained40–44
where
η0 and
η are the luminescence quantum efficiency of Ce
3+ in the absence and presence of Eu
2+, respectively;
C is the total doping content of the Ce
3+ and Eu
2+.
Eqn (5) corresponds to the exchange interaction, and
eqn (6) with
α = 6, 8, 10 corresponds to the dipole–dipole, dipole–quadrupole, and quadrupole–quadrupole interactions, respectively. Actually, for many codoped phosphors, the energy transfer mechanisms for exchange and multipolar interactions have already been discussed using
eqn (5 and 6). For example, Guo
et al. investigated the energy transfer mechanism of Eu
2+/Mn
2+ codoped Ca
9Lu(PO
4)
7,
41 Shang
et al. reported the luminescence and energy transfer of Ce
3+/Eu
2+ in Ca
8La
2(PO
4)
6O
2.
32 Therefore, in the present work, the energy transfer mechanism of Ce
3+/Eu
2+ in Ca
2PO
4Cl can also be explored by
eqn (5 and 6). Because the value of
η0/
η can be approximately estimated from the correlated lifetime ratio (
τS0/
τS), hence
eqn (5 and 6) can be changed as follows
The relationships of ln(τS0/τS) ∝ C and (τS0/τS) ∝ Cα/3 are illustrated in Fig. 7. By consulting the fitting factor R, the relation (τS0/τS) ∝ C6/3 has the best fitting, implying that the dipole–dipole interaction is applied for the energy transfer from Ce3+ to Eu2+.
 |
| | Fig. 7 Dependence of ln(τS0/τS) of Ce3+ on (a) C and τS0/τS of Ce3+ (b) C6/3, (c) C8/3, and (d) C10/3. | |
In general, the critical distance (Rc) can be calculated by the concentration quenching method. The critical distance RCe–Eu between Ce3+ and Eu2+ can be estimated by45
| | |
RCe–Eu = 2[3V/(4πxcN)]1/3
| (9) |
where
x is the sum concentration of Ce
3+ and Eu
2+,
N is the number of Z ions in the unit cell (for Ca
2PO
4Cl,
N = 4), and
V is the volume of the unit cell (for Ca
2PO
4Cl,
V = 0.46731 nm
3).
The estimated distance (RCe–Eu) for Ca2PO4Cl:0.03Ce3+, yEu2+ phosphors (xc = 0.03, 0.035, 0.04, 0.05, 0.06, 0.07, 0.08, 0.1 and 0.13) are 1.95, 1.85, 1.77, 1.65, 1.55, 1.47, 1.41, 1.31 and 1.20 nm, respectively. The distances between Ce3+ and Eu2+ become shorter with increasing the Eu2+ doping content. x is the critical concentration at which the emission intensity of the donor (Ce3+) in the presence of the acceptor (Eu2+) is half that in the absence of the acceptor (Eu2+). Therefore, the critical distance (Rc) of energy transfer is calculated to be about 1.77 nm for Ca2PO4Cl:0.03Ce3+, y Eu2+. RCe–Eu for various Eu2+ content levels is much larger than the typical critical distance for the exchange interaction (0.5 nm).46 The results indicate that the exchange interaction plays no role in the energy transfer process for Ca2PO4Cl:0.03Ce3+, yEu2+. Therefore, the energy transfer between Ce3+ and Eu2+ exists in Ca2PO4Cl, and the emission intensities of Eu2+ are obviously enhanced by the efficient energy transfer from Ce3+ to Eu2+, which belongs to the multipolar interaction.
3.3 Thermal stability and CIE coordinates Ca2PO4Cl:Ce3+, Eu2+
For the application of high power LEDs, the thermal stability of phosphor is one of important issues to be considered. For Ca2PO4Cl:0.03Ce3+, 0.07Eu2+, the temperature dependence of emission spectra under the 370 nm radiation excitation is shown in Fig. 8. The activation energy (Ea) can be expressed by20,47| |
ln(I0/I) = ln A − Ea/kT
| (10) |
where I0 and I are the luminescence intensity of Ca2PO4Cl:Ce3+, Eu2+ at room temperature and the testing temperature, respectively. A is a constant; k is the Boltzmann constant (8.617 × 10⁻⁵ eV K−1). Ea is achieved to be 0.0114 eV K−1. The inset depicts and compares the thermal quenching properties of Ca2PO4Cl:Ce3+, Eu2+ and BAM. We observed only 6% decay at 100 °C for Ca2PO4Cl:Ce3+, Eu2+, as shown in Fig. 8, Ca2PO4Cl:Ce3+, Eu2+ has thermal quenching as good as that of BAM.
 |
| | Fig. 8 Temperature-dependent emission spectra of Ca2PO4Cl:0.03Ce3+, 0.07Eu2+ (λex = 370 nm). Inset: normalized intensity of Ca2PO4Cl:0.03Ce3+, 0.07Eu2+ and BAM as function of temperature (λex = 370 nm). | |
Color coordinates are one of the important factors for evaluating phosphors' performance, and the chromatic standard issued by the Commission Internationale de I'Eclairage in 1931 (CIE 1931). For Ca2PO4Cl:0.03Ce3+, 0.07Eu2+, the CIE color coordinates are (0.1454, 0.0448). It can be seen that the color coordinates of Ca2PO4Cl:0.03Ce3+, 0.07Eu2+ are about the blue region. The all results also indicate that Ca2PO4Cl:Ce3+, Eu2+ may be a potential blue phosphor for the high-LED application.
4 Conclusions
In summary, Ca2PO4Cl:Ce3+, Eu2+ phosphors are synthesized by the conventional solid state method. Ca2PO4Cl:Ce3+, Eu2+ can produce two emission bands, which correspond to the 4f05d1 → 4f1 transition of Ce3+ ion and the 4f65d1 → 4f7 transition of Eu2+ ion, respectively. The energy transfer Ce3+ → Eu2+ in Ca2PO4Cl has been validated and proved to be a resonant type via the dipole–dipole interaction. The thermal quenching property reveals that Ca2PO4Cl:Ce3+, Eu2+ has an excellent characteristics. Based on the results, we are currently evaluating the potential application of Ca2PO4Cl:Ce3+, Eu2+ as a blue-emitting n-UV convertible phosphor.
Acknowledgements
The work is supported by the National Natural Science Foundation of China (no. 50902042), the Natural Science Foundation of Hebei Province, China (no. A2014201035; E2014201037) and the Education Office Research Foundation of Hebei Province, China (nos. ZD2014036; QN2014085).
References
- N. Guo, Y. Jia, W. Lü, W. Lv, Q. Zhao, M. Jiao, B. Shao and H. You, Dalton Trans., 2013, 5649–5654 RSC.
- C.-W. Yeh, W.-T. Chen, R.-S. Liu, S.-F. Hu, H.-S. Sheu, J.-M. Chen and H. T. Hintzen, J. Am. Chem. Soc., 2012, 134, 14108–14117 CrossRef CAS PubMed.
- D. Hou, C. Liu, X. Ding, X. Kuang, H. Liang, S. Sun, Y. Huang and Y. Tao, J. Mater. Chem. C, 2013, 1, 493–499 RSC.
- N. Pradal, G. Chadeyron, S. Thérias, A. Potdevin, C. V. Santilli and R. Mahiou, Dalton Trans., 2014, 1072–1081 RSC.
- S. Ray, Y.-C. Fang and T.-M. Chen, RSC Adv., 2013, 3, 16387–16391 RSC.
- Z. Tao, Y. Huang and H. J. Seo, Dalton Trans., 2013, 2121–2129 RSC.
- J. Zhou, Z. Xia, M. Yang and K. Shen, J. Mater. Chem., 2012, 22, 21935–21941 RSC.
- H. J. Song, D. K. Yim, H.-S. Roh, I. S. Cho, S.-J. Kim, Y.-H. Jin, H.-W. Shim, D.-W. Kim and K. S. Hong, J. Mater. Chem. C, 2013, 1, 500–505 RSC.
- W.-R. Liu, C.-H. Huang, C.-P. Wu, Y.-C. Chiu, Y.-T. Yeh and T.-M. Chen, J. Mater. Chem., 2011, 21, 6869–6874 RSC.
- Q. Wang, D. Deng, Y. Hua, L. Huang, H. Wang, S. Zhao, G. Jia, C. Li and S. Xu, J. Lumin., 2012, 132, 434–438 CrossRef CAS PubMed.
- Y. Fang, L. Li, Y. Chen, H. Wang and R. Zeng, J. Lumin., 2013, 144, 13–17 CrossRef CAS PubMed.
- X. Song, R. Fu, S. Agathopoulos, H. He, X. Zhao and R. J. Li, Electrochem. Soc., 2010, 157, J34–J38 CrossRef CAS PubMed.
- R. Fu, S. Agathopoulos, X. Song, X. Zhao, H. He and X. Yu, Opt. Mater., 2010, 33, 99–102 CrossRef CAS PubMed.
- J. Sun, J. Zeng, Y. Sun and H. J. Du, Alloys Compud, 2012, 540, 81–84 CrossRef CAS PubMed.
- M. Shang, D. Geng, Y. Zhang, G. Li, D. Yang, X. Kang and J. Lin, J. Mater. Chem., 2012, 22, 19094–19104 RSC.
- L. Lan, H. Feng, Y. Tang and W. Tang, Opt. Mater., 2011, 34, 175–178 CrossRef CAS PubMed.
- C.-H. Huang, L. Luo and T.-M. J. Chen, Electrochem. Soc., 2011, 158, J341–J344 CrossRef CAS PubMed.
- W. Tang, D. Chen and H. Yang, Appl. Phys. A, 2013, 103, 263–266 CrossRef.
- Z. Wang, X. Teng and P. J. Li, Alloys Compud, 2014, 589, 549–552 CrossRef CAS PubMed.
- Y.-C. Chiu, W.-W. Liu, C.-K. Chang, C.-C. Liao, Y.-T. Yeh, S.-M. Jang and T.-M. Chen, J. Mater. Chem., 2010, 20, 1755–1758 RSC.
- A. Meijering and G. Blasse, J. Phys.: Condens. Matter, 1990, 2, 3619–3628 CrossRef.
- R. Yu, C. Guo, T. Li and Y. Xu, Curr. Appl. Phys., 2013, 13, 880–884 CrossRef PubMed.
- Z. Wang, P. Li, Z. Yang and Q. Guo, J. Lumin., 2014, 151, 170–175 CrossRef CAS PubMed.
- M. Greenblatt, E. Banks and B. Post, Acta Crystallogr., 1967, 23, 166–171 CrossRef CAS.
- M. Greenblatt, E. Banks and B. Post, Acta Crystallogr., Sect. B: Struct. Crystallogr. Cryst. Chem., 1969, 25, 2170–2171 CrossRef.
- M. Jiao, Y. Jia, W. Lü, W. Lv, Q. Zhao, B. Shao and H. You, Dalton Trans., 2014, 3202–3209 RSC.
- H. Liu, L. Liao and Z. Xia, RSC Adv, 2014, 4, 7288–7295 RSC.
- S. Dutta, S. Som and S. K. Sharma, Dalton Trans., 2013, 9654–9661 RSC.
- P. I. Paulose, G. Jose, V. Thomas, N. V. Unnikrishnan and M. K. R. Warrier, J. Phys. Chem. Solids, 2003, 64, 841–846 CrossRef CAS.
- W. Lv, Y. Jia, Q. Zhao, M. Jiao, B. Shao, W. Lv and H. You, RSC Adv., 2014, 14074–14080 RSC.
- W. Lv, Y. Jia, Q. Zhao, M. Jiao, B. Shao, W. Lü and H. You, RSC Adv., 2014, 4, 7588–7593 RSC.
- M. Shang, G. Li, D. Geng, D. Yang, X. Kang, Y. Zhang, H. Lian and J. Lin, J. Phys. Chem. C, 2012, 116, 10222–10231 CAS.
- Z. Xia and R.-S. Liu, J. Phys. Chem. C, 2012, 116, 15604–15609 CAS.
- W. Lv, W. Lü, N. Guo, Y. Jia, Q. Zhao, M. Jiao, B. Shao and H. You, Dalton Trans., 2013, 13071–13077 RSC.
- C.-H. Huang, T.-M. Chen, W.-R. Liu, Y.-C. Chiu, Y.-T. Yeh and S.-M. Jang, ACS Appl. Mater. Interfaces, 2010, 2, 259–264 CAS.
- C.-H. Huang and T.-M. Chen, J. Phys. Chem. C, 2011, 115, 2349–2355 CAS.
- W.-J. Yang and T.-M. Chen, Appl. Phys. Lett., 2006, 88, 101903 CrossRef PubMed.
- K. H. Kwon, W. B. Im, H. S. Jang, H. S. Yoo and D. Y. Jeon, Inorg. Chem., 2009, 48, 11525–11532 CrossRef CAS PubMed.
- G. Li, Y. Zhang, D. Geng, M. Shang, C. Peng, Z. Cheng and J. Lin, ACS Appl. Mater. Interfaces, 2012, 4, 296–305 CAS.
- D. L. Dexter and J. H. Schulman, J. Chem. Phys., 1954, 22, 1063–1070 CrossRef CAS PubMed.
- N. Guo, Y. Huang, H. You, M. Yang, Y. Song, K. Liu and Y. Zheng, Inorg. Chem., 2010, 49, 10907–10913 CrossRef CAS PubMed.
- R. Reisfeld, E. Greenberg, R. Velapoldi and B. Barnett, J. Chem. Phys., 1972, 56, 1698–1705 CrossRef CAS PubMed.
- U. Caldiňo, J. L. Hernández-Pozos, C. Flores, A. Speghini and M. Bettinelli, J. Phys.: Condens. Matter, 2005, 17, 7297–7306 CrossRef.
- R. Martínez-Martínez, M. García, A. Speghini, M. Bettinelli, C. Falcony and U. Caldiňo, J. Phys.: Condens. Matter, 2008, 20, 395205 CrossRef.
- G. Blass, Philips Res. Rep., 1969, 24, 131–144 Search PubMed.
- G. Blasse and B. C. Grabmaier, Luminescent Materials, Springer, Berlin, 1994 Search PubMed.
- C.-H. Huang, Y.-C. Chen, T.-M. Chen, T.-S. Chan and H.-S. Sheu, J. Mater. Chem., 2011, 21, 5645–5649 RSC.
Footnote |
| † Electronic supplementary information (ESI) available: Fig. S1, emission spectra of Ca2PO4Cl:0.03Ce3+ and Ca2PO4Cl:0.03Ce3+, 0.03Na+. Fig. S2, emission spectra of Ca2PO4Cl:0.07Eu2+, Ca2PO4Cl:0.03Ce3+, 0.07Eu2+ and BaMgAl10O17:Eu2+. See DOI: 10.1039/c4ra03087g |
|
| This journal is © The Royal Society of Chemistry 2014 |
Click here to see how this site uses Cookies. View our privacy policy here.