An accelerated route of glycerol carbonate formation from glycerol using waste boiler ash as catalyst

Vidhyaa Paroo Indrana, Nor Ain Syuhada Zuhaimia, Mohd Asyrak Deramana, Gaanty Pragas Maniamab, Mashitah Mohd. Yusoffa, Taufiq-Yap Yun Hinc and Mohd Hasbi Ab. Rahim*ad
aFaculty of Industrial Sciences & Technology, Universiti Malaysia Pahang, Lebuhraya Tun Razak, 26300 Kuantan, Pahang, Malaysia. E-mail: mohdhasbi@ump.edu.my
bCentral Laboratory, Universiti Malaysia Pahang, Lebuhraya Tun Razak, 26300 Kuantan, Pahang, Malaysia
cCatalysis Science and Technology Research Centre, Faculty of Science, Universiti Putra Malaysia, 43400 Serdang, Selangor, Malaysia
dCentre for Earth Resources Research & Management, Universiti Malaysia Pahang, Lebuhraya Tun Razak, 26300 Kuantan, Pahang, Malaysia

Received 2nd April 2014 , Accepted 29th May 2014

First published on 29th May 2014


Abstract

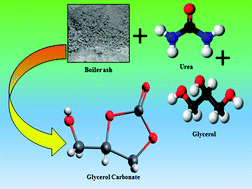
Waste boiler ash was successfully utilised as catalyst for the direct synthesis of glycerol carbonate from glycerol and urea. A series of catalysts were prepared using various calcination temperatures. The physico-chemical properties of the catalysts have been investigated by using XRD, BET, TGA, FESEM-EDX, ICP-MS, Hammett test and CO2-TPD. From the study it was found that boiler ash had significant catalytic activity towards conversion of glycerol into glycerol carbonate. It is believed that the potassium metal ion which detaches from potassium silicate had a major impact on the catalytic data where the potassium ion being a weak Lewis acid causes selective catalytic transformation of glycerol into glycerol carbonate. The mechanistic pathway through glycerol carbamate intermediate was confirmed through time online analysis study using 13C-NMR and ATR-FTIR, respectively. However, the selective transformation of glycerol carbamate into glycerol carbonate is reported to be different where it is formed in an accelerated manner. The highest catalytic activity resulted in an average percentage of 93.6 ± 0.4% glycerol conversion, 90.1 ± 1.0% glycerol carbonate selectivity and 84.3 ± 1.1% glycerol carbonate yield. Besides, for the first time the novel idea of using waste material, specifically boiler ash, is proposed as a catalyst for synthesis of glycerol carbonate from glycerol and urea. The current research employed suggests an alternative route for proper disposal of waste boiler ash.

Introduction

Over the years, production of glycerol as a crude waste from biodiesel making industries has been largely increasing. For every 100 kg of biodiesel produced, 10 kg of glycerol is produced as a by-product which corresponds to 10 weight percent of biodiesel. It is estimated that by the year 2016, the production of crude glycerol will reach 4 billion gallons.1 Thus, in order to make this waste a useful substance for future use, the conversion of glycerol to other value added products is suggested.2

Glycerol carbonate is one of the value added product of glycerol which is important to many industries. Glycerol carbonate has low toxicity, noble biodegradability and high boiling point.3 There are also further investigations that supports glycerol carbonate to be used in cosmetic and medical institutes as they have low toxicity, volatility, combustibility and good moisturizing ability.4 Besides, they also play a major role as a component of surfactants, paints, coatings and gas-separation membranes.3 Additionally, there is a general consensus that the potential of glycerol carbonate as an anti-explosive additive for gasoline and diesel will result in an unprecedented growth in the coming years.5–7

There are various routes for producing glycerol carbonate from glycerol. One of the methods employed traditionally was synthesis of glycerol carbonate from glycerol by utilising phosgene.8 However, due to the toxicity and hazard issues, other synthesis routes were suggested such as from propylene and ethylene carbonate.9 Ethylene carbonated was later found to be non-cost effective chemical. Thus, the direct carbonylation using carbon dioxide (CO2) was suggested. Nevertheless, the synthesis route also suffered from optimisation under high pressure reactors and had some thermodynamic limitations which also affected the cost effectiveness of the reaction.10–12 Glycerol carbonate was also proposed to be produced with dimethyl carbonate (DMC). The reaction required higher ratio of DMC to glycerol besides requiring expensive catalyst as well as shift in chemical equilibrium.13 Another route is by reacting glycerol and urea. Glycerol and urea are relatively cheaper and readily available.3,14

Malaysia was testified to be the world's second leading palm oil producer in the year of 2010 by Foreign Agricultural Service, Production, Supply and Distribution Online, United States Department of Agriculture (USDA) with over 18.6 million tonnes of production.15 Besides, about 4 million tonnes of boiler ash is produced per year from incineration of palm fruits, palm kernel, palm shells, and palm fiber.16,17 Therefore, there were rising costs on proper disposal of these ashes that resulted in research to make use of these ashes as catalysts.18 To add on, boiler ash over the years has been vastly used in many area of application. It was found that boiler ash could act as a good absorbent due to its spongy and porous characteristic. Thus, it was employed in a wastewater treatment research where it was capable removing 97% zinc ions from wastewater with capacity of 0.01 mg g−1 absorbance. Besides, this research affirmed that boiler ash could act as good absorbent of moisture.19 Recent research also proposed the use of boiler ash as additional cement-like material where it improved the strength of the cements.20,21 Furthermore, boiler ash was also utilised to convert waste cooking oil into biodiesel through transesterification.22

The current study, for the first time focuses on the use of waste material as catalyst for the synthesis of glycerol carbonate from glycerol and urea. For that reason, boiler ash from palm oil mill in Lepar Hilir, Malaysia is introduces as catalyst herein. The reaction is carried out as previously reported by Hasbi and co-researchers in 2012.23 However, the catalysts used in the previous study were of gold and metal alloys supported catalysts meanwhile in the current study, it focuses in the use of boiler ash (BA) waste which contains variety of metals of those being major are K, Ca, and Mg. This is a new, cheap and abundant catalyst which is introduced in this research for the transformation of glycerol into glycerol carbonate. Significantly, development of new catalyst from waste is addressed in the study following the synthesis pathway as in Fig. 1.


image file: c4ra02910k-f1.tif
Fig. 1 Reaction network for glycerol carbonate synthesis using glycerol and urea as feedstock.

Results and discussion

Effect of calcination temperature on boiler ash towards glycerol conversion, glycerol carbonate selectivity and yield

Table 1 illustrates the effect of calcination heat pre-treatment of boiler ash towards glycerol conversion, glycerol carbonate selectivity and glycerol carbonate yield. From the reaction conducted, it is evident that boiler ash is capable of selectively converting glycerol into glycerol carbonate. However, calcination of catalyst at various temperatures did not significantly alter the conversion of glycerol. All catalyst used reported had almost relatively comparable glycerol conversion which was ≥90% at 4 h reaction time (Table 1). BA 900 showed the highest selectivity and yield of about 90.1 ± 1.0% and 84.3 ± 1.1% respectively which was significantly higher than reaction conducted without catalyst. It is worth to note that glycerol carbonate yield obtained from blank reaction is comparable with previously reported literature.23 The yield of glycerol carbonate obtained follows the order of BA 900 > BA 700 > BA 1100 > BA 110 > BA 500. This could have resulted from the influence of basic metal oxides present in the catalyst with almost similar strength even after different heat pre-treatment was carried out. It is also justified that potassium as the most major metal in the catalyst could have been the target metal that has actively played the role in the catalytic activity of boiler ash. The catalytic data was also comparably higher with recently reported study where 75% yield of glycerol carbonate was obtained using metal monoglycerolates as catalyst under same temperature conditions.24 Besides, the turn over frequency, TOF (mmol g−1 cat. h−1) of boiler ash was relatively higher than most of the previously reported study (ESI, Table S1). It can be said that the current study promises good yield and selectivity with utilisation of boiler ash as catalyst from waste. Therefore, the research could critically ensure as an alternative method for proper disposal of waste boiler ash.
Table 1 Effect of boiler ash calcination temperature on glycerol conversion, glycerol carbonate selectivity and yielda
No. Catalyst Temp. heat treatment (°C) Gly. conv. % Selectivity % GC yield % TOF (mmol g−1 cat. h−1)
GC Comp. (3) Comp. (5) Comp. (6)
a Reaction conditions: temperature, 150 °C; gas, N2; glycerol[thin space (1/6-em)]:[thin space (1/6-em)]urea, 1[thin space (1/6-em)]:[thin space (1/6-em)]1.5 (molar ratio); catalyst mass, 0.25 g; time, 4 h; standard stirring rate, 340 rpm. TOF: calculated based on the mmol of glycerol converted per gram catalyst per total reaction time (h). Relative Standard Deviation (RSD): <5%. Note: Gly. is glycerol; GC is glycerol carbonate; Comp. (3) is 2,3-dihydroxypropyl carbamate; Comp. (5) is 4-(hydroxymethyl) oxazolin-2-one; Comp. (6) is (2-oxo-1,3-dioxolan-4-yl)methyl carbamate.
1 Blank 78.7 32.8 24.0 43.1 25.8
2 BA 110 110 91.1 83.5 1.9 11.1 3.5 76.2 136.7
3 BA 500 500 91.1 82.7 4.3 10.0 2.9 75.3 136.7
4 BA 700 700 94.1 88.6 3.5 4.8 2.9 83.4 141.2
5 BA 900 900 93.6 90.1 4.1 3.9 1.9 84.3 140.4
6 BA 1100 1100 89.8 85.6 5.5 6.4 2.4 77.0 134.7


Effect of metal on catalytic activity

In order to clearly identify the metal which has played the role in enhancing the catalytic activity, a series of reaction comprising various metals from most dominant metal content in boiler ash were carried out. The metals for analysis were chosen based on the elemental analysis carried out using ICP-MS. Reaction involving sylvite (KCl), potassium hydroxide (KOH), calcium oxide (CaO), magnesium oxide (MgO) and silicon oxide (SiO2) were carried out and are illustrated in Fig. 2. From Fig. 2, it is evident that the potassium regardless in form of hydroxide (KOH) or sylvite (KCl) has the highest catalytic effect towards glycerol carbonate yield and selectivity compared to other metal oxides such as MgO and CaO. Besides, the catalytic reaction of SiO2 also yielded lower glycerol carbonate. This phenomenon is expected since SiO2 is a covalently bonded non-polar molecule which does not affect the catalytic behavior of the reaction. Potassium predominantly exist as KCl and potassium silicate (K2SiO3) in boiler ash, but for this reaction, KOH was also used for the reason that potassium does not only leach while dissolving into reaction solution as potassium ion and activate the transformation of glycerol into the target product but also absorbs moisture from the environment. Thus, it is supposed that the preform of potassium metal does not play a significant role in the reaction but the catalytic reaction is subjected to the presence of potassium ion.
image file: c4ra02910k-f2.tif
Fig. 2 Effect of metals towards glycerol conversion (%), glycerol carbonate selectivity (%) and glycerol carbonate yield (%). Reaction conditions: temperature, 150 °C; gas, N2; glycerol[thin space (1/6-em)]:[thin space (1/6-em)]urea, 1[thin space (1/6-em)]:[thin space (1/6-em)]1.5 (molar ratio); catalyst mass, 0.25 g; time, 4 h; standard stirring rate, 340 rpm.

Additionally, study on other minor metal elements presence in boiler ash such as aluminium (Al) and iron (Fe) was not carried out as it was previously reported with poor yield and selectivity of glycerol carbonate in form of mixture of Al/Ca (metal oxide) and Fe/Mg hydrotalcites. The yield obtained was only 10% and 39% respectively. An increase in aluminium and iron content decreases the basic site density which decreases active sites to catalyse the reaction.25 Besides, other metal such as zirconium in form of ZrO2 was also reported to produce lower yield of glycerol carbonate (31%).26 Zr was detected to be present in boiler ash in low levels through FESEM-EDX analysis (Table 2). Therefore, it can be inferred that potassium ion is the responsible metal that acts as a weak Lewis acid to catalyse the reaction.

Table 2 Elemental analysis of BA 900 using FESEM-EDX
Element Weight (%)
C 9.97
O 53.24
Mg 3.39
Al 0.70
Si 6.01
S 1.42
Cl 1.10
K 18.53
Zr 5.65
Total 100.00


Time online study

Fig. 3 illustrates the time online study for boiler ash in the reaction with glycerol and urea from 0 minute to 10 h reaction time. From the figure it is evident that glycerol conversion using boiler ash specifically BA 900 shows a consistent increase in conversion from 0 h to 6 h. At 6 h, 8 h and 10 h, the conversion hits a maximum level and remains unchanged which is about 97% conversion. In this study, we report that the maximum yield of glycerol carbonate is at 4 h reaction time reaching 84.3 ± 1.1% of yield from the triplicate study of BA 900. Moreover, the maximum yield stipulated the most optimum time for the reaction to be conducted. On the contrary, selectivity percentage and yield percentage of glycerol carbonate decreased gradually from 5 h to 10 h. Low selectivity and yield at prolonged reaction time was due to the decomposition of glycerol carbonate into carbamate of glycerol carbonate. This is due to the availability of primary hydroxyl group (–OH) in glycerol carbonate molecule which has higher possibility to react with urea to form (2-oxo-1,3-dioxolan-4-yl)methyl carbamate.7 The availability of urea at prolonged reaction time was confirmed by the time online analysis using ATR-FTIR and 13C NMR, respectively. Therefore, the time online analysis (TOL) depicts that 4 h reaction time is the most suitable time of reaction with BA 900 to assist production of maximum yield. On the other hand, Fig. 4 illustrates the selectivity percentage of glycerol carbonate, compound (3), compound (5) and compound (6). It is evident that by prolonging the reaction time, decomposition of glycerol carbonate into (6) increases and at the same time formation of compound (5) originated from carbamate intermediate also increased. The figure also depicts that the glycerol carbamate, compound (3) formed was decomposed into glycerol carbonate in an accelerated manner. It is important to note that in previous studies, compound (3) was observed to be present in large amount in the initial stages of reaction and then gradually converted into glycerol carbonate at prolonged reaction time.23,25,27
image file: c4ra02910k-f3.tif
Fig. 3 Time online analysis (TOL) of glycerol conversion (%), glycerol carbonate selectivity (%) and glycerol carbonate yield (%) of BA 900. Reaction conditions: temperature, 150 °C; gas, N2; glycerol[thin space (1/6-em)]:[thin space (1/6-em)]urea, 1[thin space (1/6-em)]:[thin space (1/6-em)]1.5 (molar ratio); catalyst mass, 0.25 g; standard stirring rate, 340 rpm.

image file: c4ra02910k-f4.tif
Fig. 4 Time online analysis (TOL) of glycerol carbonate synthesis in presence of BA 900 catalyst. Key: ■ selectivity of glycerol carbonate, ◆ selectivity of compound (3), ▲ selectivity of compound (5) and ● selectivity of compound (6). Reaction conditions: temperature, 150 °C; gas, N2; glycerol[thin space (1/6-em)]:[thin space (1/6-em)]urea, 1[thin space (1/6-em)]:[thin space (1/6-em)]1.5 (molar ratio); catalyst mass, 0.25 g; standard stirring rate, 340 rpm.

Analysis of reaction products using ATR-FTIR

To corroborate results from analysis of product using GC-FID, ATR-FTIR analysis (Fig. 5) was carried out on glycerol standard, glycerol carbonate standard, product of reaction at 4 h and 10 h. From Fig. 5, it is evident that glycerol is detectable through ATR-FTIR where transmittance of peak at range (1500–1200) cm−1 indicates glycerol moiety as in pattern (a) and (c). These peaks are assigned to overlapping of C–H in planes and O–H bending in the glycerol molecule. The O–H bending is further supported by the –OH stretching at peak range of (3500–3000) cm−1.28 On the other hand, glycerol carbonate is evident to be present in pattern (b) and (c). The occurrence of O–H vibration from 2-hydroxyethyl chain at peaks 3432 cm−1 and 3343.57 cm−1 indicates presence of –OH functional group. Besides, peak observation from range (2950–2850) cm−1 further specifies presence of glycerol carbonate. The two peaks observed are due to CH2 and CH vibration of the O-methylene and O-methylindyne groups of cyclic carbonate. Moreover, the peak present at range (1790–1760) cm−1 signifies C[double bond, length as m-dash]O functional group which is a result of C[double bond, length as m-dash]O stretching of the 5 membered cyclic carbonate.
image file: c4ra02910k-f5.tif
Fig. 5 ATR-FTIR spectra of (a) standard glycerol, (b) standard glycerol carbonate, (c) product of reaction catalysed using BA 900 at 4 h reaction time and (d) product of reaction catalysed by BA 900 at 10 h reaction time.

Finally, peaks at range (1200–1000) cm−1 also support presence of glycerol carbonate where these peaks indicate C–C and C–O stretching of 2-hydroxyethyl chain.29 In pattern (c) the two peaks ranging from (1610–1670) cm−1 indicate presence of urea as previously reported.7 The urea peak is still visible in pattern (d) for the product of reaction catalysed by BA 900 at 10 h reaction time signifying urea is not completely used up in the prolonged reaction as urea is employed excessively. However, the decrease of glycerol moiety peaks were noticed in pattern (d) indicating loss of glycerol where it suggest almost 97% conversion of glycerol in prolonged reaction time. Besides, the C[double bond, length as m-dash]O stretch was also shifted in pattern (d) to the right from 1790 cm−1 into 1730 cm−1 due to decrease in selectivity of formation of glycerol carbonate and increase in formation of 4-(hydroxymethyl) oxazolidin-2-one (compound 5) at prolonged reaction time at 10 h. The shifted peak was observed to occur due to the (C[double bond, length as m-dash]O) being adjacent to N–H group in compound (5). As for glycerol carbonate, the C[double bond, length as m-dash]O is partly adjacent in between two –O groups which indicates the peak in spectra (b) and (c) to be in-line and sharper compared to spectra (d). Thus, C[double bond, length as m-dash]O group is still expected to persist at 10 h due to the increase formation in compound (5).

Mechanistic study

Fig. 6(a) and (b) illustrates the 13C NMR analysis for time online analysis (TOL) of BA 900. From the 13C NMR pattern, it is evident that glycerol carbonate (4) was selectively formed through carbonylation of intermediate 2,3-dihydroxypropyl carbamate (3).30 At 4 h of reaction time, 4-(hydroxymethyl) oxazolin-2-one (5) and (2-oxo-1,3-dioxolan-4-yl)methyl carbamate (6) was seen to be present. As the reaction time was prolonged up to 10 h, gradual increase in the peak pattern of (5) and (6) was observed which clearly indicated that selectivity towards glycerol carbonate formation decreased from 4 h onwards due to formation of (5) and (6). This is due to the further reaction of glycerol carbonate with excess of urea forms (6) and the intermediate 2,3-dihydroxypropyl carbamate (3) forms compound (5) through a parallel reaction.31
image file: c4ra02910k-f6.tif
Fig. 6 (a) 13C NMR overlay of standard glycerol (STD GLY), standard glycerol carbonate (STD GC) and TOL of BA 900. Key: (1) glycerol; (3) 2,3-dihydroxypropyl carbamate, (4) glycerol carbonate; (5) 4-(hydroxymethyl) oxazolin-2-one; (6) (2-oxo-1,3-dioxolan-4-yl)methyl carbamate. (b) 13C NMR overlay of standard glycerol (STD GLY), standard glycerol carbonate (STD GC) and TOL of BA 900. Key: (2) urea and (4) glycerol carbonate.

From Fig. 6(a), glycerol (1) is detected through peak at 74.0 ppm and 64.5 ppm where the peak is observed from the presence of –CH–O– and –CH2–O– bonds respectively. Compound (3) was detected at 71.8 ppm which may attribute to –C–N– bond. Compound 5 on the other hand attributed to peaks at 43.0 ppm, 63.5 ppm and 78.9 ppm which are resultant of –CH–C– (C tertiary), –CH–N– as well as –C–O– bonds respectively. Compound 4 exhibits peaks at 62.3 ppm, 67.8 ppm and 79 ppm which correspond to –CH2–O–, –CH–O– as well as –C–O–. Besides, compound 6 showed presence of peaks at 55.3 ppm, 64.1 ppm and 68.9 ppm which is attributed by –CH2–O–, –C–N– as well as –CH–O–. On the other hand, Fig. 6(b) is labelled with urea (2) at 165 ppm. This peak directly corresponds to the C[double bond, length as m-dash]O group that is attached to amide group in urea. The pattern of the decomposition of urea is also clear as the C[double bond, length as m-dash]O peak of urea gradually reduces from 30 min to 10 h until only a minimal amount of urea is left. The result also corresponds to spectra (d) in Fig. 5 for analysis of product using ATR-FTIR at 10 h reaction time where presence of urea is still detected at minimal amount. On the other hand, peak at 157.8 corresponds to C[double bond, length as m-dash]O of glycerol carbonate adjacent to –O which belongs to glycerol carbonate. However, in this study we report that the quantity of (3) did not show direct correlation to glycerol carbonate formation as (3) was not clearly observed at 0.5 h of reaction time. Nonetheless, presence of intermediate (3) may have attributed to the formation of glycerol carbonate but in an acceleration manner as the intermediate (3) formed quickly transformed into glycerol carbonate. These results also correlated to the previous analysis of TOL using GC-FID (Fig. 3) which resulted in the highest glycerol carbonate yield at 4 h reaction time and the yield decreased with prolonged reaction time as the selectivity towards glycerol carbonate decreased due to formation of (5) and (6). From the study we believe that the synthesis route of glycerol carbonate still follow the mechanistic pathway reported by Hasbi and co-researchers in 2012 as well as Kim and co-researchers in 2014 but the selective transformation of glycerol carbamate intermediate decomposed in an accelerated manner to form glycerol carbonate.23,31

To validate the 13C NMR results on time online analysis of BA 900, analysis using ATR-FTIR was carried out for the reaction from 0.5 h to 10 h (Fig. 7). From the spectra it is observed that glycerol (1) peak gradually shifted from 1450 cm−1 closer to 1400 cm−1 as the time for reaction was prolonged. Peak of urea (2) also showed similar behavior of where the two peaks (1665 and 1620) cm−1 was observed to gradually shift. This phenomenon is expected to persist as most glycerol quickly converted into glycerol carbonate and other products. Intermediate (3) was detected at 2 h and 4 h reaction time in range of (1710–1715) cm−1. However, from 6 h to 10 h the peak shifted to 1730 cm−1 indicating the conversion of carbamate (3) into product (5).31 Presence of peak at 1790 cm−1 indicated C[double bond, length as m-dash]O stretch of glycerol carbonate (4) at 2 h onwards. However, glycerol carbamate peak (3) was not clearly observed at 0.5 h to 4 h due to reaction mechanism occurring in an accelerated manner to directly decompose intermediate (3) into (4). This result was also in agreement with the previously discussed 13C NMR. Besides, no peaks were observed in range of 2250 cm−1 indicating the presence of N–C–O stretching of isocyanic acid which was also similar to the study previously reported by Aresta and in his co-researchers in 2009.3,31 Therefore the mechanistic pathway for the synthesis of glycerol carbonate using BA 900 is suggested as in Scheme 1.


image file: c4ra02910k-f7.tif
Fig. 7 ATR-FTIR spectra for time online analysis of BA 900 reaction from 0.5 h to 10 h. Key: (1) glycerol; (2) urea; (3) 2,3-dihydroxypropyl carbamate; (4) glycerol carbonate; (5) 4-(hydroxymethyl)oxazolin-2-one.

image file: c4ra02910k-s1.tif
Scheme 1 Mechanistic pathways for synthesis of glycerol carbonate using glycerol, urea and boiler ash (BA 900) as catalyst. Key: (1) glycerol; (2) urea; (3) 2,3-dihydroxypropyl carbamate, (4) glycerol carbonate; (5) 4-(hydroxymethyl) oxazolin-2-one; (6) (2-oxo-1,3-dioxolan-4-yl)methyl carbamate.

Catalyst characterisation

Thermogravimetric (TGA) analysis. Based on Fig. 8, the TGA thermogram (Fig. 8a) displays significant weight loss in boiler ash where the weight decreased from 100% to 60% from temperature 0 °C to 1100 °C. There is about 40% loss in weight percentage which is due to presence of many components in the boiler ash such as moisture and other organic matter such as carbon that can be lost through heating. Besides, halogenated metal compound containing chlorine could have resulted in evaporation under high thermal treatment. For example, sylvite (KCl) could have been transformed into potassium silicate (K2SiO3) under high thermal treatment at 900 °C.
image file: c4ra02910k-f8.tif
Fig. 8 Thermo-gravimetric analysis (TGA) of boiler ash. (a) Weight percentage (%) loss and (b) Derivative Thermal Gravimetric (DTG).

These phenomena can be also compared and observed from the XRD diffractogram. Moreover the DTG thermogram (Fig. 8b) illustrates the possibility of the boiler ash catalyst to exist in various phases at different calcination temperature. At temperature 100 °C to 200 °C there is variation in peaks drop that could be indicating moisture lost through heating. The transformation of peak from temperature 400 °C to 1100 °C could indicate loss of elements such as organic matters and phase transformation of the catalyst. This analysis was done to identify changes in phase transformation at various level of temperature. Thus, the boiler ash was dried at 110 °C and calcined from 350 °C to 1100 °C in order to obtain suitable catalyst.

Fourier transform infrared (FTIR) analysis of catalysts. Results from FTIR analysis (Fig. 9) on the boiler ash (BA) suggests that major peak for BA 700 and BA 900 catalyst was observed at 3325.47 cm−1 which is attributed to the presence of –OH functional group. Similarly the –OH band was observed in BA 110 at 3245.63 cm−1. The presence of –OH group was confirmed with peaks observed in both catalyst at 680–620 cm−1 where it assigns –OH out of plane bending. The presence of the band indicates water adsorbed on the surface of the catalyst from the atmosphere.32 Boiler ash is found to have spongy and porous characteristic that can easily absorb moisture. The band at range of (1300–1400) cm−1 attributes the deformation of –OH.22 Other than that, the presence of band at range (1010–1020) cm−1 was attributed to alternating –SiO and –AlO bands in BA 700 and BA 900.33 It is visible from the FTIR spectrum that metal ions present in the boiler ash BA 700 as well as BA 900 have gone transformation to form metal oxides, metal hydroxides and other forms of metals such as MgO, Al2O3, CaO, KOH and K2SiO3, where there is sharp peak indicating presence of oxide at (1010–2010) cm−1 (ref. 33) and broad range of –OH functional group at 3325.47 cm−1, respectively. From Fig. 9, it is also evident that both BA 700 and BA 900 exhibits similar FTIR pattern which may attribute to findings in this study that the catalytic behaviour is relatively similar.
image file: c4ra02910k-f9.tif
Fig. 9 FTIR spectra of (a) BA 110, (b) BA 700 and BA 900.
X-Ray diffraction analysis. It can be seen from Fig. 10 that BA 110 showed the characteristics peak of sylvite (KCl) at 2θ = 28.60°, 40.69°, 66.71° and 73.85°, respectively. The presence of calcite (CaCO3) could be examined at diffraction peak of 2θ = 30.61° whereas potassium silicate (K2SiO3) was detected at 2θ = 30.93°. For BA 700, similar phase composition as BA 110 containing KCl, CaCO3 and K2SiO3 were observed to presence. However, for BA 900, in addition to CaCO3 and K2SiO3, calcium oxide (CaO) was identified to be present at 2θ = 26.46° and 32.83° respectively. The occurrence of CaO in BA 900 is expected since CaCO3 was known to decompose into CaO as temperature for calcination treatment is higher than 800 °C.
image file: c4ra02910k-f10.tif
Fig. 10 XRD Diffractogram of (a) BA 110, (b) BA 700 and (c) BA 900 catalysts.

The change in the XRD pattern could be mainly influenced by calcination temperature where at different calcination temperatures, phase transformation occurred as evident from TGA data in Fig. 8 and FTIR analysis in Fig. 9. In general, potassium from sylvite form in BA 110 transformed into potassium silicate with higher thermal heat treatment as observed in BA 700 and BA 900. Even though, KCl was not detected in BA 900 in the XRD data we believe that KCl is still present in BA 900 as referred to the elemental analysis using FESEM-EDX. Moreover, the presence of potassium as the predominant peak is detected in all three catalysts. Therefore, this factor contributed to the insignificant difference in catalytic results for all three catalysts. However, BA 900 and BA 700 exhibits better catalytic results than BA 110 due to the dominance presence of potassium silicate phase at higher calcination temperature. However, it is important to note that the present reported study on boiler ash characteristic is not relatively similar of those reported earlier.33 The difference in the particular characteristic could have been due to difference in calcination method, where in previous study calcination in closed system was employed and in the current study the calcination process was carried out under static air in tube furnance. Even though, magnesium was not detected in the major peaks visible from the XRD diffractogram, it is believed that magnesium metals are present in minor amount in boiler ash which is supported by the elemental analysis using EDX and ICP-MS. Since magnesium and calcium are generally present in lower amount in oil palm boiler ash as reported in elemental analysis study by Boey and co-researchers in 2011,33 using X-ray Fluorescence (XRF), it plainly supports the detection level of these specific elements to be very minimal in this characterisation technique by XRD. These element were particularly looked through because magnesium and calcium supported catalyst have shown good yield of glycerol carbonate in previous studies.7 Besides, these metals are reported to be in the form of oxides in palm oil boiler ash by Boey and co-researches in 2011. Thus, it is likely evident that metal present in boiler ash exist in solid metal oxides phase.

Morphology and elemental analysis of boiler ash using FESEM-EDX and ICP-MS. From Tables 2 and 3, it is apparent that potassium is the most dominant metal present in boiler ash which supports the catalytic activity of the boiler ash to be influenced by potassium. Besides, the results are also in-line with the XRD data where due to minimal amount, peaks containing magnesium element were not visible.
Table 3 Metal content in BA 900 (ICP-MS)*a
Metals Percentage (%)
a Note: * analysis carried out for environmental metals only.
Potassium (K) 86.8
Calcium (Ca) 9.8
Magnesium (Mg) 2.0
Aluminium (Al) 1.1
Others (Fe, Ag, Cu, and Na) 0.4


These elemental results also correlated to previous results reported by Yin and co-researchers in 2008.32 Fig. 11 on the other hand, simply depicts the nature of boiler ash to be spongy and porous where it could act as a good absorbent of moisture.19,34 This characteristic is important because waste glycerol contains moisture and catalyst which can absorb moisture will favour the forward reaction in case of if direct utilisation of waste glycerol with urea is proposed.


image file: c4ra02910k-f11.tif
Fig. 11 FESEM of (a) BA 110 and (b) BA 900.
BET surface area analysis. From the BET analysis it was found that BA 110 had surface area of about 8.05 m2 g−1 and BA 900 had surface area about 2.00 m2 g−1. The surface area of the dried boiler ash at 110 °C was relatively larger than the boiler ash calcined at 900 °C. This is because at higher temperature agglomeration of particles occur causing particles to bind closely to each other and exist as cluster where this dramatically causes surface area to decrease. However, surface area did not particularly influence the catalytic results in this study because no distinct difference in catalytic data was observed.

Acidity and basicity analysis

Hammett test. Based on Table 4, it can be summarized that the Hammett test showed that all catalyst BA 110, BA 500, BA 700, BA 900 and BA 1100 changed the colour of phenolphthalein (H_ = 8.2) from colourless to pink. However, for all three indicator 2,4-dinitroaniline (H_ = 15), 4-nitroaniline (H_ = 18.4) and methyl red (H_ = 4.8) remained unchanged. Therefore, it can be concluded that the basicity of the catalyst lie in the range of 8.2 < H_ < 15 and the catalyst is not acidic in nature. In concise, the basic strength of the catalysts tested is of mildly basic in nature. The low basicity of the catalyst is essentially influenced by OH groups, medium basicity by metal-O groups and strong basicity by O−2 groups.35
Table 4 Hammett test
Catalyst Methyl red (H_ = 4.8) Phenolphthalein (H_ = 8.2) 2,4-Dinitroaniline (H_ = 15) 4-Nitroaniline (H_ = 18.4)
BA 110 No changes Colourless to pink solution No changes No changes
BA 500 No changes Colourless to pink solution No changes No changes
BA 700 No changes Colourless to pink solution No changes No changes
BA 900 No changes Colourless to pink solution No changes No changes
BA 1100 No changes Colourless to pink solution No changes No changes


Temperature Programmed Desorption (CO2-TPD). From Fig. 12, BA 110 is classified as a basic material with total gas CO2 desorbed about 7066.9 μmol g−1. A total of four distinct peaks were observed at different temperatures with different amount of CO2 gas desorbed ranging from weak basic property to high basic property. This is regard to the influence of homogeneously distributed weak alkaline metals and strong alkaline metals in BA 110. BA 700 (Fig. 12) on the other hand showed basic property with total amount of CO2 gas desorbed about 780.3 μmol g−1 while BA 900 showed 1249.3 μmol g−1 of CO2 gas desorbed. A total of three peaks were observed with different amount of gas desorbed. According to carbon dioxide temperature programmed desorption technique (CO2-TPD), it can be roughly classified that peaks absorbed at temperature (<200 °C) contains weak basic sites, at temperature (200 °C–400 °C) contains medium basic sites and at temperature (>400 °C) contains strong basic sites respectively.36
image file: c4ra02910k-f12.tif
Fig. 12 CO2-TPD of BA 110, BA 700 and BA 900.

For the case of BA 110, strong basic sites corresponds to the peak desorbed at temperature 446 °C (b), 635 °C (c) and 744 °C (d) respectively. On the other hand for BA 900 strong basic site is present at peak 647 °C (g) while BA 700 exhibited strong basic sites at peak 667 °C (h) and 834 °C (i). Even though, all three BA 110, BA 700 and BA 900 contain strong basic sites, the Hammett test indicated these three catalysts to show mild basic property. Thus, this could be an influence of mixture of weak and strong metal oxides that results in mild basic property of boiler ash in the Hammett Test as depicted in Table 5. Even though, BA 110 exhibits almost 6 times higher basic property from the CO2-TPD analysis, BA 700 and BA 900 still depicted higher yield of glycerol carbonate compared to BA 110. Thus, it is expected that the potassium metal ion which acts as a weak Lewis acid had played the major role in the catalytic activity. This is because it is reported that Lewis acid sites activates the carbonyl group of urea while the conjugated base site activates hydroxyl group on glycerol to form glycerol carbonate.30 It is also understood that the preform of potassium does not show a major effect on the catalytic data obtained. In addition to that, presence of K2SiO3 is more dominant in BA 700 and BA 900 compared to BA 110 which is evident from the XRD as well as FESEM-EDX data. Therefore, the availability of O−2 species could assist in superior catalytic activity of BA 700 and BA 900 to form glycerol carbonate.

Table 5 Basic sites distribution calculated on the basis of CO2-TPD profile
Catalyst Basic sites (μmol g−1) Contribution of strong basic site (%)
Weak Medium Strong Total
BA 110 265.1 6801.7 7066.9 96
BA 700 780.3 780.3 100
BA 900 44.9 54.8 1149.6 1249.3 92


Conclusions

In concise, it can be concluded that the use of waste boiler ash as catalyst for the reaction of producing glycerol carbonate from bio-renewable feedstock glycerol and urea is an economic synthesis route. Other than that, the reaction is also environmentally friendly where it ensures proper disposal of waste besides providing an alternative route for a modest and cheap synthesis of glycerol carbonate at larger scale due the amount of waste boiler ash and glycerol generated yearly. Besides, the percentage of yield of glycerol carbonate and percentage of conversion of glycerol which are 84.3% as well as 93.6% respectively also shows a promising approach for the synthesis of glycerol carbonate utilising waste boiler ash. From the overall study, it was found that the potassium metal ion acts as a weak Lewis acid played a major role as the active metal ion for the catalytic activity of boiler ash while O−2 groups in boiler ash could have also acted as a strong base to activate glycerol to form glycerol carbonate. The reaction pathway was confirmed to follow glycerol carbamate route. However, the decomposition of glycerol carbamate was found to occur at an accelerated manner from initial stages of the catalytic reaction.

Experimental

Materials

Glycerol (99.5%) and urea (AR Grade) were purchased from Friendemann Schmidt Chemical. Waste boiler ash used as catalyst was collected from palm oil mill located in Lepar Hilir, Pahang, Malaysia. The boiler ash used is the ash obtained from incineration of palm fruits, palm kernel, palm shells and palm fiber. Potassium hydroxide ≥85.0%, potassium chloride ≥99.0%, magnesium oxide ≥99.0%, calcium oxide ≥99.99% and silicon oxide ≥99.9% used were purchased from Sigma-Aldrich.

Catalyst preparation

Raw boiler ash obtained from palm oil mill in Lepar Hilir, Pahang, Malaysia was dried at 110 °C overnight and then powdered using mortar and pestle (denoted as BA 110). Then the ash was sieved using 200 μm sized sieve. Later, 2 g of the sieved ash were loaded on the combustion boat and calcined under static air at temperature (500 °C, 700 °C, 900 °C and 1100 °C respectively) for 4 h. The catalysts were later denoted as BA 500, BA 700, BA 900 and BA 1100, respectively.

Catalytic testing

The reaction was carried out using a three-neck round bottom flask. Typically, 13.8 g of glycerol was allowed to heat up to 150 °C under the flow of nitrogen gas. When the temperature reached 150 °C, 13.5 g urea and 0.25 g catalyst was added to the reaction and stirred using magnetic stirrer under 340 rpm of stirring rate. The molar ratio of glycerol to urea used was (1[thin space (1/6-em)]:[thin space (1/6-em)]1.5). Sampling was done from 0 h to 4 h (typical or otherwise mentioned) with the time interval of 1 h. 50 μl of sample was transferred in 1450 μl of deionised water. The results were analysed using Gas Chromatography-Flame Ionised Detector (GC-FID) Agilent Technologies 7890A equipped with Varian Capillary Column, CP-ParaBOND Q (25 m, 0.53 mm, 10 μm).

Product analysis

Gas Chromatography-Flame Ionised Detector (GC-FID) Agilent Technologies 7890A equipped with Varian Capillary Column, CP-ParaBOND Q (25 m, 0.53 mm, 10 μm) was used to analyse the product of reaction. The temperature ramping was set at 10 °C per minute increased up to 300 °C. Sampling was done during reaction for analysis from 0 h to 4 h with time interval of 1 h (typical or otherwise mentioned) where 50 μl of sample was added to 1450 μl of deionized water. Standard calibration for glycerol and glycerol carbonate was done using GC-FID before samples from catalytic reaction were analysed. Tetraethylene glycol (TEG) was used as external standard. Helium gas was used as the carrier gas with a flow rate of 35 ml min−1. The temperature of the injector and the detector were 225 °C and 250 °C, respectively. The temperature of the column was programmed to have a 2 min initial hold at 80 °C, then 10 °C min−1 ramp from 80 °C to 250 °C and 15 °C min−1 ramp from 250 °C to 300 °C with 3 min hold time. The split ratio was 1[thin space (1/6-em)]:[thin space (1/6-em)]10 and injection volume was 1 μl.

Time online analysis of products was also analysed using Attenuated Total Reflectance-Fourier Transform infrared spectroscopy (ATR-FTIR) Perkin Elmer, USA with resolution of 4 cm−1 per second and Nuclear Magnetic Resonance (NMR) BRUKER Ultra Shield Plus 500 MHz. For the case of analysis of liquid product using ATR-FTIR, 50 μl of sample was immediately sampled and one drop was placed onto the sample holder. The drop was then immediately analysed. On the other hand, the sample for 13C NMR analysis was prepared by sampling 150 μl into the NMR tubes and then diluting them with 500 μl deuterated methanol-d4.

Catalyst characterisation

X-Ray Diffraction RigakuMini Flex II was set to analyse the XRD pattern of the catalysts. Diffraction patterns were recorded with Cu Kα radiation over the range of 3 degree to 80 degree at 2 theta (θ) for crystalline phase determination.

Thermo-gravimetric Analyser Mettler Toledo TGA/DSC-HT/1600 used was analysed in the range of temperature between ambient to 1200 °C under static air.

The Hammett test were carried out on BA 110, BA 500, BA 700, BA 900 and BA 1100 where phenolphthalein, 2,4-dinitroaniline, 4-nitroaniline and methyl red were used as indicators to determine the qualitative acidic as well as basic properties of the catalyst. 25 mg of catalyst were weighed and prepared in three batches. 5 ml of methanol was added to the catalyst. Then 1 ml of the indicator was added to 4 ml of methanol. Final volume of 5 ml indicators were added separately to the catalysts weighed in batches. The mixture was then left to equilibrate for 2 h. The colour changes were observed and noted.

The quantitative basicity strength was analysed using CO2-Temperature Programmed Desorption, (Thermo Finnigan TPD/R/O 1100) Thermo electron for BA 110, BA 700 and BA 900. The TPD was equipped with a thermal conductivity detector (TCD). 50 mg of sample was treated at 200 °C for 1 h by passing helium at a flow rate of 20 ml min−1. Then, the sample was saturated with carbon dioxide at a flow rate of 30 ml min−1 and at temperature ramping of 10 °C min−1 up to 200 °C for 1 h. Subsequently, the system was flushed with helium (20 ml min−1) at 200 °C for 1 h to eliminate physisorbed CO2. Desorption was carried out from ambient temperature to 900 °C at a heating ramp of 5 °C min−1.

Other than that, Field Emission Scanning Electron Microscope (FESEM) and Energy Dispersive X-Ray (EDX), JEOL (JSM-7800f) with spatial resolution up to 1 nm was used to study the surface morphology and elemental analysis of the catalyst.

Inductive Coupled Plasma-Mass Spectrometer (ICP-MS) Agilent 7500c was used to study the environment metal content in the catalyst using in-house method CHEMITEL/WI/CHEM-TM/001 based on AOAC999.10.

Fourier Transform infrared spectroscopy (FTIR) Perkin Elmer, USA was used to study the functional group present in the catalyst that could also attribute to depict the phase of metal present in the catalyst. Fourier transform infrared spectroscopy (FTIR) transmission data were collected for pressed catalyst disk made with KBr with ratio of (1[thin space (1/6-em)]:[thin space (1/6-em)]10) catalyst to KBr in the range of 4000–400 cm−1.

The BET (Brunauer–Emmett–Teller) method was used to measure the total specific surface areas of the boiler ash catalysts using a Thermo Finnigan Sorptomatic 1990 nitrogen adsorption–desorption analyzer. Sample was oven dried at 100 °C for 12 h before analysis. Degassing of sample was conducted for 24 h with 8 h slow degassing followed by 16 h fast degassing before analysis.

Acknowledgements

The authors thank Universiti Malaysia Pahang, Universiti Putra Malaysia and the Ministry of Education for Research Acculturation Collaborative Effort (RACE) and Universiti Malaysia Pahang Internal Grants Scheme (RDU121301 as well as 120363). We also would like to thank the Ministry of Education and Universiti Malaysia Pahang for funding MyBrain15 as well as Graduate Research Scheme (GRS) scholarship, respectively.

References

  1. N. Rahmat, A. Z. Abdullah and A. R. Mohamed, Renewable Sustainable Energy Rev., 2010, 14, 987–1000 CrossRef CAS PubMed.
  2. D. T. Johnson and K. A. Taconi, Environ. Prog., 2007, 26, 338–348 CrossRef CAS.
  3. M. Aresta, A. Dibenedetto, F. Nocito and C. Ferragina, J. Catal., 2009, 268, 106–114 CrossRef CAS PubMed.
  4. V. Plasman and T. Caulier, Plast. Addit. Compd., 2005, 7, 30–33 CrossRef CAS.
  5. M. A. Pacheco and C. L. Marshall, Energy Fuels, 1997, 11, 2–29 CrossRef CAS.
  6. A. Dibenedetto, A. Angelini, M. Aresta, J. Ethiraj, C. Fragale and F. Nocito, Tetrahedron, 2011, 67, 1308–1313 CrossRef CAS PubMed.
  7. C. Hammond, J. A. Lopez-sanchez, A. R. Mohd Hasbi, N. Dimitratos, R. L. Jenkins, A. F. Carley, Q. He, C. J. Kiely, D. W. Knight and G. J. Hutchings, Dalton Trans., 2011, 40, 3927 RSC.
  8. Encyclopedia of Chemical Processing and Design, ed. J. J. McKetta (Executive Ed.) and W. A. Cunningham (Assistant Ed.), Marcel Decker, New York, 1984, vol. 20, p. 177 Search PubMed.
  9. Z. Mouloungui, J.-W. Yoo, C.-A. Gachen, A. Gaset, and G. Vermeersch, European Patent, EP0739888 A1, pp. 1–13, 1996.
  10. C. Vieville, J. W. Yoo, S. Pelet and Z. Mouloungui, Catal. Lett., 1998, 60(56), 245–247 CrossRef.
  11. M. Aresta, A. Dibenedetto, F. Nocito and C. Pastore, J. Mol. Catal. A: Chem., 2006, 257, 149–153 CrossRef CAS PubMed.
  12. J. George, Y. Patel, S. M. Pillai and P. Munshi, J. Mol. Catal. A: Chem., 2009, 304, 1–7 CrossRef CAS PubMed.
  13. S. C. Kim, Y. H. Kim, H. Lee, D. Y. Yoon and B. K. Song, J. Mol. Catal. B: Enzym., 2007, 49, 75–78 CrossRef CAS PubMed.
  14. S. Fujita, Y. Yamanishi and M. Arai, J. Catal., 2013, 297, 137–141 CrossRef CAS PubMed.
  15. Foreign Agric. Serv. Prod. Supply Distrib. Online, United States Dep. Agric. (USDA), http//www.%20fas.usda.gov/psdonline/psdHome.aspx.
  16. K. T. Lee, N. F. Zainudin and A. R. Mohamed, in The Seventh Asia-Pacific International Symposium on Combustion and Energy Utilization, 2004, pp. 1–8 Search PubMed.
  17. N. Zainudin, K. Lee, A. Kamaruddin, S. Bhatia and A. Mohamed, Sep. Purif. Technol., 2005, 45, 50–60 CrossRef CAS PubMed.
  18. S. H. Shuit, K. T. Tan, K. T. Lee and A. H. Kamaruddin, Energy, 2009, 34, 1225–1235 CrossRef CAS PubMed.
  19. K. H. Chu and M. A. Hashim, J. Chem. Technol. Biotechnol., 2002, 77, 685–693 CrossRef CAS.
  20. W. Tangchirapat, J. Tangpakasit, S. Waew-kum and C. Jaturapitakkul, KMUTT Research and Development Journal, 2003, 26, 459–473 Search PubMed.
  21. V. Sata, C. Jaturapitakkul and K. Kiattikomol, J. Mater. Civ. Eng., 2004, 16, 623–628 CrossRef CAS.
  22. L. H. Chin, B. H. Hameed and A. L. Ahmad, Energy Fuels, 2009, 23, 1040–1044 CrossRef CAS.
  23. M. Hasbi Ab Rahim, Q. He, J. A. Lopez-Sanchez, C. Hammond, N. Dimitratos, M. Sankar, A. F. Carley, C. J. Kiely, D. W. Knight and G. J. Hutchings, Catal. Sci. Technol., 2012, 2, 1914 CAS.
  24. T. W. Turney, A. Patti, W. Gates, U. Shaheen and S. Kulasegaram, Green Chem., 2013, 15, 1925–1931 RSC.
  25. M. J. Climent, A. Corma, P. De Frutos, S. Iborra, M. Noy, A. Velty and P. Concepción, J. Catal., 2010, 269, 140–149 CrossRef CAS PubMed.
  26. M. Lelovský and A. Kaszonyi, in Glycerol carbonate from bioglycerol. 44th International Petroleum Conference, Bratislava, Slovak Republic, 2009, pp. 1–6 Search PubMed.
  27. K. Jagadeeswaraiah, C. R. Kumar, P. S. S. Prasad, S. Loridant and N. Lingaiah, Appl. Catal., A, 2014, 469, 165–172 CrossRef CAS PubMed.
  28. A. H. Hazimah, T. L. Ooi and A. Salmiah, J. Oil Palm Res., 2003, 15, 1–5 CAS.
  29. V. Calvino-Casilda, G. Mul, J. F. Fernández, F. Rubio-Marcos and M. A. Bañares, Appl. Catal., A, 2011, 409–410, 106–112 CrossRef CAS PubMed.
  30. M. J. Climent, A. Corma, P. De Frutos, S. Iborra, M. Noy, A. Velty and P. Concepción, J. Catal., 2010, 269, 140–149 CrossRef CAS PubMed.
  31. D. Kim, K. Park, M. Kim, D. Kang, J. Yang and D. Park, Appl. Catal., A, 2014, 473, 31–40 CrossRef CAS PubMed.
  32. C. Y. Yin, S. A. S. A. Kadir, Y. P. Lim, S. N. Syed-Ariffin and Z. Zamzuri, Fuel Process. Technol., 2008, 89, 693–696 CrossRef CAS PubMed.
  33. P.-L. Boey, S. Ganesan, S.-X. Lim, S.-L. Lim, G. P. Maniam and M. Khairuddean, Energy, 2011, 36, 5791–5796 CrossRef PubMed.
  34. P.-L. Boey, S. Ganesan, G. P. Maniam, M. Khairuddean and S. Lim, Energy Convers. Manage., 2012, 56, 46–52 CrossRef CAS PubMed.
  35. X. Deng, Z. Fang, Y. Liu and C.-L. Yu, Energy, 2011, 36, 777–784 CrossRef CAS PubMed.
  36. L. Wang, Y. Ma, Y. Wang, S. Liu and Y. Deng, Catal. Commun., 2011, 12, 1458–1462 CrossRef CAS PubMed.

Footnote

Electronic supplementary information (ESI) available. See DOI: 10.1039/c4ra02910k

This journal is © The Royal Society of Chemistry 2014
Click here to see how this site uses Cookies. View our privacy policy here.