The thermal conductivity and mechanical properties of poly(p-phenylene sulfide)/oxided-graphene and poly(p-phenylene sulfide)/defect-graphene nano-composites by molecular dynamics simulation
Chun-Yi Changa,
Shin-Pon Ju*b,
Jia-Wei Changc,
Sheng-Chieh Huangd and
Hsi-Wen Yang*e
aYunlin, Chiayi and Tainan Regional Teaching Resource Center, National Cheng Kung University, Tainan 701, Taiwan. E-mail: list1860@gmail.com
bDepartment of Mechanical and Electro-Mechanical Engineering, Center for Nanoscience and Nanotechnology, National Sun Yat-sen University, Kaohsiung 804, Taiwan. E-mail: jushin-pon@mail.nsysu.edu.tw
cDepartment of Mechanical and Electro-Mechanical Engineering, Center for Nanoscience and Nanotechnology, National Sun Yat-sen University, Kaohsiung 804, Taiwan. E-mail: m003020037@gmail.com
dDepartment of Mechanical and Electro-Mechanical Engineering, Center for Nanoscience and Nanotechnology, National Sun Yat-sen University, Kaohsiung 804, Taiwan. E-mail: m013020087@student.nsysu.edu.tw
eDepartment of Material Engineering, National United University, Miao-Li, 36003, Taiwan. E-mail: hwyang@nuu.edu.tw
First published on 2nd June 2014
Abstract
Molecular dynamics simulations are used to study the thermal and mechanical properties of the PPS matrix with defect graphene and graphene oxide. For the PPS matrix with defect graphene at different weight fractions, the defect graphene dispersed in the system when the weight fraction of defect graphene was less than 10 wt%. When the weight fraction of defect graphene was more than 20 wt%, the defect graphene will aggregate. In the case of the graphene oxide in the PPS matrix, all the results reveal that the graphene is dispersed in the PPS matrix. The thermal conductivities of PPS/DG and PPS/GO increase when the weight fractions of DG and GO increase. However, the thermal conductivities significantly increase when the weight fractions of PPS/DG and PPS/GO are more than 20 wt%.
1 Introduction
Graphene is a two-dimensional sheet of sp2-hybridized carbon, which is the basic building block of other important allotropes due to its extended honeycomb network. Long-range π-conjugation in graphene possesses extraordinary thermal, mechanical, and electrical properties.1–3 Therefore, graphene is predicted to have high thermal conductivity, great mechanical properties and excellent electronic transport properties.4Recently, the development of graphene-based polymer nanocomposites with improved the properties such as high thermal and electrical conductivity, improved heat distortion temperatures, gas barrier performance, electromagnetic shielding, and fire protection.5,6 Particularly, graphene-based polymer nanocomposites have also been employed as electrodes for supercapacitors and lithium ion batteries, counter electrodes of dye-sensitized solar cells, and transparent conducting electrodes.7 Because of graphene can be used to provide value-added properties to the pristine polymer, graphene-based polymer nanocomposites have attracted great interest for their potential applications.
In order to realize the possible applications of graphene-based polymer nanocomposites, the properties of graphene-based polymer nanocomposites have been extensively studied by experiment. Ramanathan et al.8 investigated the creation of polymer nanocomposites with functionalized graphene sheets. An unprecedented shift in glass transition temperature of over 40 °C is obtained for poly(acrylonitrile) at 1 wt% functionalized graphene sheet, and with only 0.05 wt% functionalized graphene sheet in poly(methyl methacrylate) (PMMA) there is an improvement of nearly 30 °C. Villar-Rodil et al.9 studied the effect of graphene nanosheets on the thermal stability PMMA. The graphene sheets noticeably improves the thermal stability of the polymer, the degradation process is shifted to higher temperatures by around 10 °C, and the degradation rate become slower. Liang et al.10 prepared the first poly(vinyl alcohol) (PVA) nanocomposites to use graphene as a mechanical reinforcement material, and the mechanical properties of graphene/PVA nanocomposites was obtained at fairly low concentrations of graphene oxide. They found the tensile strength is increment of 76%, and the Young's modulus is improvement of 62% by addition of 0.7 wt% of graphene oxide. Zhao et al.11 investigated the nanocomposites based on fully exfoliated graphene nanosheets and PVA by a facial aqueous solution. The mechanical properties of graphene/PVA composites are significantly enhanced at low graphene loading. In addition, the tensile strength is improvement of 150% and a nearly 10 times increase of Young's modulus at graphene loading of 1.8 vol% Jiang and Drzal12 studied the effect of exfoliated graphene nanoplatelets (GNP) on the crystallization behavior, thermal conductivity, and electrical conductivity of high-density polyethylene (HDPE)/GNP nanocomposites. The results indicate that GNP can significantly increase crystallization temperature and crystallinity of HDPE. However, at high GNP loading, GNP particles retard the crystallization process. Additionally, the thermal stability and thermal conductivity of HDPE/GNP nanocomposites can be significantly enhanced as a function of GNP concentration. Carotenuto et al.13 researched the mechanical properties of low-density polyethylene (LDPE) nanocomposites to establish the effect of nanoscale reinforcement within the polymer matrix. The results show that the filler does not involve a change in the microscopic structure of the polymer. However, on a macroscopic scale, GNPs limit the mobility of the polymer chains, resulting in an increase in stiffness for the final composite.
Since investigating mixture mechanism of polymeric molecules and graphene is difficult due to the very small scale involved, numerical methods must be used to retrieve the information beyond experimental limitations. Among these numerical methods, molecular dynamics (MD) simulation is a powerful tool for the investigation of mixture mechanism at an atomic level. Adopting this technique, Hu et al.14 investigated the model graphene nanoplatelets in organic matrix by MD simulation. The results show that the thermal conductivity of the graphene filler–organic matrix composites is limited by the interfacial thermal resistance; however, this limitation can be alleviated by the use of high aspect ratio fillers. Lv et al.15 studied the influence of the chemical functionalization of graphene on the interfacial bonding property between graphene and polymers using molecular mechanics (MM) and MD simulation. The results indicate that the bonding energy and shear stress between graphene and the polymer increase with the increase of the concentration of functionalized group. Wang and Duan16 used MD simulation to research the molecular mechanisms of nucleation and growth of polyethylene molecule. In their study, the temperature is an important factor for single polyethylene chain crystallization on graphene. In addition, the two steps, adsorption and orientation, of single polyethylene chain crystallization can be observed from the polymer crystallization process and the particle number distribution of CHx group. Xue et al.17 used MD simulation with cooling process to predict the glass transition temperature (Tg) of graphene/polymer composites. The functionalization of graphene can greatly enhance Tg of graphene/polymer composites, and the functionalized graphene can intensify the arrest of the polymer chains mobility. Rahman and Haque18 investigated the mechanical properties of graphene/cellulose (GC) nanocomposites. The results reveal that the Young's modulus of GC nanocomposites are seen to be comparatively higher than those of neat cellulose resin, and also significantly improved compared that to neat cellulose.
Poly(p-phenylene sulfide) (PPS) can be mainly applied to the reinforced form with glass fiber or mineral fillers as a high-performance thermoplastic. It shows excellent mechanical properties, high thermal stability, excellent chemical resistance, excellent flame retardance, good electrical and electronic properties, and good mold precision. Among the encapsulation materials for electronic components, PPS has a glass-transition temperature of about 80–90 °C, melting temperature of 280–290 °C and operating temperature of 220–240 °C,19,20 displaying good thermoplastic characteristics and higher heat stability.21 In the recent study, Chae and co-workers22 investigated the electrical and thermal properties of PPS/reduced graphite oxide (RGO) nanocomposites. Their results reveal that as graphene oxide content increased in the PPS/RGO composites, the crystallization temperature and electrical conductivity of the composites increased and the percolation threshold value was at 5–8 wt% of graphene oxide. Our previous study23 investigated the thermal conductivity of graphite flake (GF)/PPS composites at different GF weight fractions by experimental and non-equilibrium molecular dynamics simulation. From the SEM micrographs, it reveals that the GFs distributions uniformly within the PPS matrix for samples prepared by the hot press method, while gradient distributions of GFs are found for the injection method samples. The results of non-equilibrium molecular dynamics simulation confirm the influence of GF weight fractions on the value of thermal conductivity and are in agreement with the results for the hot press method. Although PPS possesses outstanding advantages and various applications, there is still lack the relative research about the improved properties of nanocomposites with PPS. Therefore, in this study, we extend our previous research to investigate the thermal conductivity and the mechanical properties of PPS polymer matrix with defect graphene (DGs) and graphene oxide (GOs) at different weight percentages. To further realize the improvement of thermal properties of PPS/DG and PPS/GO nanocompositions, the thermal conductivities and temperature distribution profiles were used to obtain the thermal properties and temperature gradient, respectively. In addition, the mechanical behavior of PPS/DG and PPS/GO nanocomposites under tensile loadings was also obtained.
2 Simulation model
Molecular dynamics simulation was carried out by using the Discover package,24 and the COMPASS force field was used in our simulation with time step of 1 fs for the trajectory integration. In order to construct a model appropriate for our computing resources, GF was represented by a stack of three graphene sheets with H-terminated edges, because structures with two graphene layers are not flat enough within the PPS matrix, and therefore cannot reflect a realistic graphite flake structure. The graphene oxide was modified by randomly grafting O–H and C–O–C group, Fig. 1(a) shows the defect graphene and graphene oxide structures in our simulation, each of which has dimensions of 50 Å × 50 Å, with the chemical structure of PPS demonstrated in Fig. 1(b).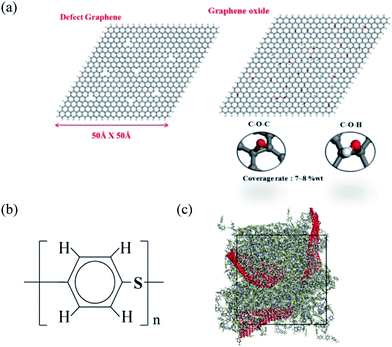 | ||
| Fig. 1 Physical models of (a) defect graphene (DG) and graphene oxide (GO); (b) PPS chemical formula and; (c) DG/PPS polymer composite material. | ||
The procedure to obtain equilibrium configurations of the PPS/DG and PPS/GO systems are described as follows: (1) the modified graphite flake and PPS chains were randomly distributed in a large simulation box. (2) After energy minimization by the conjugate gradient algorithm,25 the system was quenched from 1000 K to 300 K with a cooling rate of 5 K per ps at 1 atm by an isobaric–isothermal ensemble (NPT). The rescaling method26 and the Anderson method27 were used as the thermostat and barostat. (3) Finally, after analyzing the last 20![[thin space (1/6-em)]](https://www.rsc.org/images/entities/char_2009.gif) 000 temperature and 20
000 temperature and 20![[thin space (1/6-em)]](https://www.rsc.org/images/entities/char_2009.gif) 000 pressure data of the 50 ps-long relaxation process at 300 K and 1 atm, the standard deviations of temperature and pressure are about 4.3 K and 0.01 Gpa, indicating the system has completely reached the equilibrium condition. Fig. 1(c) shows one of these GO/PPS composite structures with a PBC box after this procedure, in which the GO is embedded within the PPS matrix.
000 pressure data of the 50 ps-long relaxation process at 300 K and 1 atm, the standard deviations of temperature and pressure are about 4.3 K and 0.01 Gpa, indicating the system has completely reached the equilibrium condition. Fig. 1(c) shows one of these GO/PPS composite structures with a PBC box after this procedure, in which the GO is embedded within the PPS matrix.
3 Determination of thermal conductivity
For calculations of thermal conductivities, the non-equilibrium molecular dynamics (NEMD) simulation was performed by a NVE ensemble, which provides direct information on transport phenomena. The heat flux is proportional to the negative temperature gradient with a coefficient, the thermal conductivity, via Fourier's law is shown as23| J = −λ·∇T | (1) |
 | (2) |
 is the time average of the temperature distributions at each time interval after the system reaches the steady-state temperature distribution. The heat flux JZ can be calculated directly as23
 | (3) |
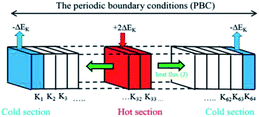
Fig. 2 shows the schematic diagram of the NEMD simulation model. To obtain the temperature distribution, the length of the simulation box along the heat flux direction was divided into 64 equal parts as labeled from K1 to K64. Sections K1 and K64 at the two ends of the PBC box were named as the “cold” sections, from which ΔEk was extracted, and sections K32 and K33 in the middle of the model were named as the “hot” sections that ΔEk extracted from the cold sections was imposed into.
By rescaling the atomic velocities for the addition and extraction of the desired kinetic energy ΔEk in the hot and cold sections, the heat flux can be applied to produce a temperature gradient along the heat flux direction. Besides producing a heat flux in the system, the conservations of the total energy of the system and the momentum at the hot and cold sections should be obeyed after the velocity adjustment. The related equations to achieve the above demands are listed in eqn (4)–(6):23
| Vi′ = R·Vi − Vsub | (4) |
 | (5) |
 | (6) |
 of the cold (or hot) sections before and after the energy extraction (or addition) so that the reservoirs remain stationary; N is number of atoms at the cold (or hot) sections.
After the system reaches the steady state, the temperature Tk at the k-th region lying between hot and cold sections can be obtained by eqn (7):23
 | (7) |
3.1 Determination of Young's modulus
In our simulation models, the concerned elastic region is under the strain of 0.003 for the small deformations. Considering the small deformations, the stress σ is defined as the following equation:28–30
 | (8) |
| σi = Cijεj | (9) |
 | (10) |
The elastic stiffness coefficients are defined as28,29
 | (11) |
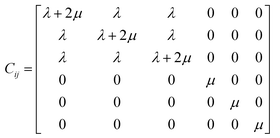 | (12) |
 | (13) |
4 Results and discussion
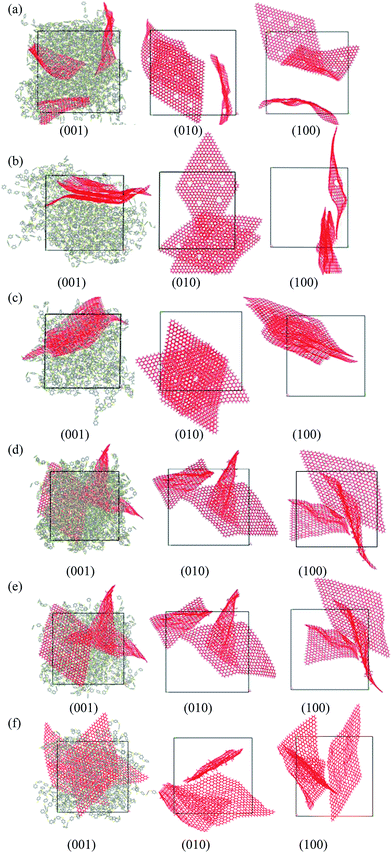
Above all, to check our simulation method, we first simulation a PPS matrix and compare the density and solubility parameter of the equilibrium structure with those of the experimental study. Our results show that the density and the solubility parameter of PPS are similar to the experimental results, as shown in Table 1. After ensuring that the system can be used to obtain the equilibrium state, our aim research is to investigate the thermal conductivities and mechanical properties of PPS/DG and PPS/GO at different graphene weight fractions by MD simulation.For clearly investigating the dispersity of graphene within the polymer matrix, the morphologies from three view directions are shown for each case, and the polymer matrixes are only shown in the morphology along the (0 0 1) direction. Fig. 3 shows the morphologies of PPS/DG and PPS/GO at different weight fractions graphene materials of 10 wt%, 20 wt%, and 30 wt%, respectively. For the PPS matrix with defect graphene at different weight fractions, the defect graphene dispersed in the system when the weight fraction of defect graphene less than 10 wt%. As the weight fraction of defect graphene more than 20 wt%, the defect graphene will aggregate together as shown in Figs. 3(a–c). From the previous research,30 the agglomerated structures oxf multi-walled carbon nanotubes (MWCNTs) are dispersed in the PPS matrix due to the strong intermolecular van der Waals interactions among the MWCNTs at high concentrations. In addition, the mechanical behaviors of graphene/polymer composite are strongly influenced by the relative strength of van der Waals interaction between the polymer and graphene. Since the van der Waals interaction holds graphene sheets together, it clamps graphene and leads to a strong tensioning phenomenon that dominates its bending rigidity in a large number of important situations.31 Therefore, from Fig. 3(a–c), it indicates that the interaction between PPS molecules and graphene is weaker than the van der Waals interaction between graphene, so the graphene sheets tend to disperse in the PPS matrix at weight fraction equals to 10 wt%. Nevertheless, the interaction between PPS molecules and graphene is stronger than the van der Waals interaction between graphene, so the graphene will aggregate together when the weight fraction larger than 10 wt%. In the case of the graphene oxide in the PPS matrix, all results reveal that the graphene are dispersed in the PPS matrix shown in Fig. 3(d–f). This is because the solubility parameter of graphene oxide is approximate to that of PPS, so the graphene will easily disperse in the PPS matrix.32 It suggests that the interaction between PPS molecules and graphene oxides is stronger than the van der Waals interaction between graphene oxides. Therefore, the graphene oxides in the PPS matrix are dispersed.
In order to understand the improvement of the thermal and mechanical properties of the nanocomposites, the thermal conductivity and Young's modulus were used to observe the effects of the graphene materials at different weight fractions. We have calculated the mean values of thermal conductivities and Young's modulus from different direction of Cartesian coordinate components. Fig. 4 shows the thermal conductivity profiles with the corresponding error bars for PPS/DG and PPS/GO at different weight fractions. Each TC value shown in Fig. 4 is the average on the TC values in the x, y, and z dimensions obtained by the NEMD. The results reveal that the thermal conductivities of PPS/DG and PPS/GO increase with the increase of the weight fraction. Increasing of thermal conductivities of PPS/DG and PPS/GO are not clear when the weight fraction less than 10 wt%, however, the thermal conductivities significantly increase as the weight fractions of PPS/DG and PPS/GO more than 20 wt%.
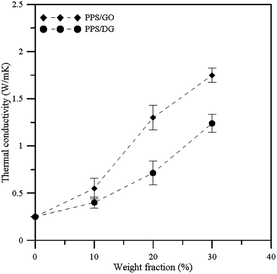 | ||
| Fig. 4 Thermal conductivity profiles with error bars of PPS/DG and PPS/GO at different weight fractions. | ||
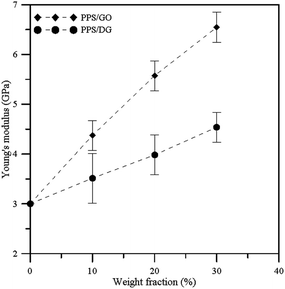
Fig. 5 illustrates the Young's modulus profiles of PPS/DG and PPS/GO at different weight fractions. Each Young's modulus is calculated by taking the average on the Cxx, Cyy, and Czz values obtained by eqn (11) for each system. When the weight fraction increases, the Young's modulus of PPS/DG and PPS/GO will increase. In addition, from the results, the Young's modulus of PPS/GO is higher than that of PPS/DG, it means that the stiffness of the PPS/GO is stiffer than the PPS/DG. This is because the GOs are uniformly dispersed in the PPS matrix due to the solubility parameter of GO is approximate to PPS.
According to Sun and co-worker's research,33 the thermal conductivity can be improved when the polymeric materials are mixed with the graphene or graphene oxide. In addition, the thermal conductivity of the PPS/GO is higher than that of the PPS/DG due to the defect graphene in PPS matrix aggregate together when the weight fraction larger than 20 wt%, this can be attributed to the fact that the stronger interaction between PPS molecules and graphene affect the equilibrium structure of graphene oxides. The thermal conductivity is also affected by the interaction between graphene and polymer, which increases when the interaction between the graphene and polymer is stronger.34 Accordingly, our results are in good agreement with the previous researches.
5 Conclusions
In this study, molecular dynamics simulation is used to investigate the thermal conductivities and mechanical properties of PPS/DG and PPS/GO at different weight fractions. For the PPS matrix with defect graphene at different weight fractions, the defect graphene disperse in the system when the weight fraction of defect graphene less than 10 wt%. As the weight fraction of defect graphene more than 20 wt%, the defect graphene will aggregate together. It indicates that the interaction between PPS molecules and graphene is weaker than the van der Waals interaction between graphene, so the graphene are dispersed in the PPS matrix at weight fraction equals to 10 wt%. Nevertheless, the interaction between PPS molecules and graphene is stronger than the van der Waals interaction between graphene, so the graphene will aggregate together when the weight fraction larger than 10 wt%. In the case of the graphene oxide in the PPS matrix, all results reveal that the graphene are dispersed in the PPS matrix. This is because the solubility parameter of graphene oxide is approximate to that of PPS, so the graphene will easily disperse in the PPS matrix.The thermal conductivities of PPS/DG and PPS/GO increase when the weight fractions of DG and GO increase. However, the thermal conductivities significantly increase as the weight fractions of PPS/DG and PPS/GO more than 20 wt%. In addition, the thermal conductivity of the PPS/GO is higher than that of the PPS/DG due to the defect graphene in PPS matrix aggregate together when the weight fraction larger than 20 wt%, this can be attributed to the fact that the stronger interaction between PPS molecules and graphene affect the equilibrium structure of graphene oxides. Finally, when the weight fraction increases, the Young's modulus of PPS/DG and PPS/GO will increase.
Acknowledgements
The authors would like to acknowledge the (1) National Science Council, Republic of China, under Grant Number NSC 101-2628-E-110-003-MY3 for the financial support, (2) National Center for High-performance Computing, Taiwan, for the use of computer time, (3) National Center for Theoretical Sciences, Taiwan.Notes and references
- M. J. Allen, V. C. Tung and R. B. Kaner, Chem. Rev., 2010, 110, 132 CrossRef CAS PubMed.
- S. Sato, N. Harada, D. Kondo and M. Ohfuchi, Fujitsu Sci. Tech. J., 2010, 46, 103 CAS.
- G. W. Flynn, J. Chem. Phys., 2011, 135, 050901 CrossRef PubMed.
- T. Kuilla, S. Bhadra, D. Yao, N. H. Kim, S. Bose and J. H. Lee, Prog. Polym. Sci., 2010, 35, 1350 CrossRef CAS PubMed.
- P. Steurer, R. Wissert, R. Thomann and R. Mülhaupt, Macromol. Rapid Commun., 2009, 30, 316 CrossRef CAS PubMed.
- T. K. Das and S. Prusty, Polym.-Plast. Technol. Eng., 2013, 53, 319 CrossRef.
- Y. Sun and G. Shi, J. Polym. Sci., Part B: Polym. Phys., 2013, 51, 231 CrossRef CAS.
- T. Ramanathan, A. A. Abdala, S. Stankovich, D. A. Dikin, M. Herrera-Alonso, R. D. Piner, D. H. Adamson, H. C. Schniepp, X. Chen, R. S. Ruoff, S. T. Nguyen, I. A. Aksay, R. K. P. Homme and L. C. Brinson, Nat. Nanotechnol., 2008, 3, 327 CrossRef CAS PubMed.
- S. Villar-Rodil, J. I. Paredes, A. Martinez-Alonso and J. M. D. Tascon, R. Soc. Chem., 2009, 19, 3591 CAS.
- J. Liang, Y. Huang, L. L. Zhang, Y. Wang, Y. Ma, T. Guo and Y. Ghen, Adv. Funct. Mater., 2009, 19, 2297 CrossRef CAS.
- X. Zhao, Q. Zhang and D. Chen, Macromolecules, 2010, 43, 2357 CrossRef CAS.
- X. Jiang and L. T. Drzal, Polym. Compos., 2012, 636 CrossRef CAS.
- G. Carotenuto, S. D. Nicola, M. Palomba, D. Pullini, A. Horsewell, T. W. Hansen and L. Nicolas, Nanotechnology, 2012, 23, 485705 CrossRef CAS PubMed.
- L. Hu and P. Keblinski, J. Appl. Phys., 2011, 110, 033517 CrossRef PubMed.
- C. Lv, Q. Xue, D. Xia, M. Ma, J. Xie and H. Chen, J. Phys. Chem., 2010, 114, 6588 CAS.
- L. Z. Wang and L. L. Duan, Comput. Theor. Chem., 2012, 1002, 59 CrossRef CAS PubMed.
- Q. Xue, C. Lv, M. Shen, H. Zhang, C. Ling, X. Zhou, C. Ling, X. Zhou and Z. Jiao, Comput. Mater. Sci., 2013, 71, 66 CrossRef CAS PubMed.
- R. Rahman and A. Haque, Procedia Eng., 2013, 56, 789 CrossRef CAS PubMed.
- B. Ibadan, Polymer Data Handbook, Oxford University Press, 1999, pp. 714–721 Search PubMed.
- S. I. Lee and B. C. Chun, J. Mater. Sci., 2000, 35, 1187 CrossRef CAS.
- W. H. Tang, X. Y. Hu, J. Tang and R. G. Jin, J. Appl. Polym. Sci., 2007, 106, 2648 CrossRef CAS.
- B. J. Chae, D. H. Kim, I. S. Jeong, J. R. Hahn and B. C. Ku, Carbon Letters, 2012, 13, 221 CrossRef.
- S.-P. Ju, T. J. Haung, C. H. Liao and J.-W. Chang, Polymer, 2013, 54, 4702–4709 CrossRef CAS PubMed.
- A. S. Accelrys Materials Studio 5.0, Inc., San Diego, 2010 Search PubMed.
- R. Fletcher and C. M. Reeves, Comput. J., 1964, 7, 149 CrossRef.
- H. C. Andersen, J. Comp. Phys., 1983, 52, 23 Search PubMed.
- B. J. O. Telemana and E. Sven, Mol. Phys., 1987, 60, 193 CrossRef.
- Materials Studio 5.0 Classical simulation theory-mechanical properties Accelrys Inc.
- M. Bohlen and K. Bolton, Comput. Mater. Sci., 2013, 68, 73 CrossRef CAS PubMed.
- D. Wu, L. Wu, W. Zhou, T. Yang and M. Zhang, Polym. Eng. Sci., 2009, 1727 CAS.
- Z. Lu and M. L. Dunn, J. Appl. Phys., 2010, 107, 044301 CrossRef PubMed.
- J. Gupta, C. Nunes, S. Vyas and S. Jonnalagadda, J. Phys. Chem. B, 2011, 115, 2014 CrossRef CAS PubMed.
- X. B. Sun, A. P. Yu, P. Ramesh, E. Bekyarova, M. E. Itkis and R. C. Haddon, J. Electron. Packag., 2011, 133 Search PubMed.
- T. F. Luo and J. R. Lloyd, Adv. Funct. Mater., 2012, 22, 2495 CrossRef CAS.
- N. BULAKH and J. P. JOG, J. Macromol. Sci., Part B: Phys., 1999, 38, 277–287 CrossRef.
| This journal is © The Royal Society of Chemistry 2014 |

