Study on intramolecular charge transfer processes, solvation dynamics and rotational relaxation of coumarin 490 in reverse micelles of cationic gemini surfactant

Sonu, Amit K. Tiwari, Sunita Kumari and Subit K. Saha*
Department of Chemistry, Birla Institute of Technology & Science (BITS), Pilani, Rajasthan 333 031, India. E-mail: sksaha@pilani.bits-pilani.ac.in; subitksaha@gmail.com; Fax: +91 1596 244183; Tel: +91 1596 515279

Received 27th March 2014 , Accepted 15th May 2014

First published on 15th May 2014


Abstract

The steady-state fluorescence properties, steady-state fluorescence anisotropy, solvation dynamics and rotational relaxation of coumarin 490 (C-490) have been studied in cationic gemini surfactant 1,4-bis(dodecyl-N,N-dimethylammoniumbromide)butane (12-4-12)–cyclohexane–n-pentanol–water reverse micelles (RMs). C-490 molecule resides in the water pool of RMs. A lesser extent of hydrogen bonding interactions occurs between the –OH group of the alcohol and the C-490 molecule at the interface of the present RMs as compared to the RMs of reported conventional cationic surfactants. The effect of the more hydrophobic nature of coumarin 480 (C-480) used to study the RMs of conventional cationic surfactants cannot be ruled out. C-490 migrates to the water pool with increasing content of water molecules. Therefore, the results of steady-state fluorescence properties, rotational relaxation and solvation dynamics depend on the water loading of RMs, unlike the RMs of conventional cationic surfactants. Thus, the solvation dynamics in gemini surfactant RMs are one order of magnitude faster as compared to the RMs of conventional cationic surfactants. The faster solvation dynamics in gemini surfactant RMs as compared with the reported AOT RMs are due to the absence of hydrogen bonding interactions between the water molecules and quaternary ammonium headgroups of gemini surfactants. The polarity of the surrounding microenvironment is found to have very little effect on the rates of non-radiative processes in the water pool of gemini surfactant RMs. The rates of non-radiative processes in the present RMs are found to be higher than those in reported AOT RMs.

1. Introduction

The study of organized assemblies of molecules is an enduring goal of researchers. Organized assemblies include micelles, reverse micelles (RMs), vesicles etc., and these assemblies can mimic reactions in biological systems. The functions performed by biological membranes have encouraged researchers to look for a simple biological-mimicking system, which can mimic at least some of the physicochemical properties of the biological membrane architecture. RMs are one of the simplest biological membrane mimetic systems.1 In the RM system, the headgroups of the surfactant molecules point towards the pool w0 (w0 = [polar solvent]/[surfactant]) of a polar solvent, and the tails of the surfactant molecules project outwards into the nonpolar solvent phase. In addition to the presence of water in the pool of RMs, there are also reports on the use of other polar solvents such as methanol, acetonitrile, dimethylformamide, etc.2–4 The presence of water inside the RMs plays a vital role; it controls the size of the RMs.5 Water present inside the pool of the RMs differs vastly from bulk water. FT-IR studies have shown that water molecules present inside the pool of the RMs not only behave like bulk water, but also behave like bound water molecules.6 Furthermore, it has been reported that the properties of the water molecules present inside the pool of the RMs depend upon the size of the pool.7–10

The study of the dynamics of water molecules confined in various biological systems is of significant interest. The structure of water molecules present inside the pool of RMs have been studied by different techniques, including SANS,11,12 FT-IR and NMR,13 etc. Solvation dynamics is one of the best techniques used for studying the structure of water molecules because it enables the observation of an ultra-slow component, which is many orders of magnitude slower than that of bulk water.14 Bulk water exhibits very fast solvation dynamics.15 The solvation dynamics of bulk water with solvation time of less than 1 ps and single exponential decay have been studied by fluorescent probe molecules, namely, coumarin 343 (C-343) and coumarin 480.16 However, the dynamics of solvents are found to be slower in the presence of molecular assemblies.2,17–23 Bimodal behavior (fast and slow components of solvation) of water has been observed in different molecular assemblies.23–31

Solvation dynamics depend upon the nature of the molecular assemblies.3,32–35 Shirota et al.32 reported solvation dynamics in the micelles of cationic and anionic conventional surfactants in aqueous media. They reported that the dynamics are slower in the micelles of anionic surfactants than in those of cationic surfactants with quaternary ammonium headgroups in aqueous media. The slow solvation dynamics in the case of anionic surfactants is due to hydrogen bonding interactions between the water molecules and surfactant headgroups. Such hydrogen bonding does not occur in the case of cationic surfactants, which do not contain any hydrogen bonding site. Hazra et al.36 reported the solvation dynamics of C-480 in the water-in-oil microemulsions of various conventional surfactants. They observed that C-480 is located at the micellar interfacial region of cationic surfactant cetyltrimethylammonium bromide (CTAB), unlike AOT microemulsions,37 and the solvation dynamics was found to be independent of water content of the microemulsion. Corbeil et al.34 also reported that C-343 remains at the interface of the RMs of CTAB, and that the location is independent of water loading.

Gemini surfactants are a special class of surfactants having two hydrophobic chains and two hydrophilic headgroups connected with a spacer group.38 Gemini surfactants have superior properties than conventional surfactants. They have low critical micelle concentration (CMC), better solubilizing ability of numerous water-insoluble compounds, stronger biological activity, etc.38,39 They have widespread applications in chemistry, medicine, biology, etc.40 Gemini surfactants, like conventional surfactants, also form RMs in the presence of primary alcohols with medium chain length.34,41–44 Zhao et al.41–44 studied the various physical properties of the RMs of cationic gemini surfactants. They described the different states of water in the RMs of cationic gemini surfactants using the FT-IR spectroscopy.41 However, to the best of our knowledge the solvation dynamics in the RMs of gemini surfactants has not been reported. Recently, we studied the effect of a hydroxyl group-substituted spacer group of cationic gemini surfactants on the solvation dynamics and rotational relaxation of C-480 in aqueous micelles.23

Considering the superior surface active properties of gemini surfactants than conventional surfactants, we realized that the RMs of gemini surfactants are also very interesting systems for studying solvation dynamics. In the present work, we have studied the dynamics of the solvent relaxation of C-490 in the RMs of a cationic gemini surfactant, 1,4-bis(dodecyl-N,N-dimethylammoniumbromide)butane (12-4-12). (Molecular structures for C-490 and 12-4-12 are given in Scheme 1). RMs were prepared in cyclohexane (CHX) as a nonpolar solvent and n-pentanol as a co-surfactant. To the best of our knowledge, this is the first report on the solvation dynamics and rotational relaxation in RMs formed by a cationic gemini surfactant. The changes in the steady-state fluorescence, fluorescence anisotropic properties, solvation dynamics and rotational relaxation of C-490 were monitored by changing the size of the water pool of RMs. The effect of water loading on these properties was compared with that in the RMs of CTAB. The present study also compares the time scales of solvation dynamics in the gemini surfactant RMs and the reported AOT, both aqueous and non-aqueous, RMs.3 This study also suggests possible reasons for this difference. We also studied the effect of water loading in the pool of RMs on the rates of ICT processes of C-490.45,46


image file: c4ra02708f-s1.tif
Scheme 1 Molecular structure of cationic gemini surfactant (12-4-12) and C-490.

2. Materials and methods

C-490 of highest purity grade was procured from Sigma, and was used as received. CHX and n-pentanol of spectroscopic grade were purchased from Spectrochem India, and were used without further purification. The gemini surfactant 12-4-12 was synthesized according to a previously reported method,47 and recrystallized several times with methanol and ethyl acetate mixture. The structure of the synthesized compound was confirmed by 1H-NMR data (Table S1 in ESI). It was dried under vacuum at 50 °C for 10 h before use.2,3 Triple-distilled water was used for the preparation of RM solutions. The final concentration of C-490 was 0.01 mM and that of 12-4-12 was 20 mM in all the measurements. The RM solutions were prepared by transferring a calculated amount of 12-4-12 from a stock solution prepared in CHX and n-pentanol. A calculated amount of water was added using a micropipette. Extra n-pentanol was added to achieve a final concentration of 2.4%, and then the solution was made up to a desired volume by CHX. The solutions were sonicated until they were optically transparent.

Absorption spectra were recorded using a Jasco V-630 UV-visible spectrophotometer. Steady-state fluorescence measurements were performed using a Horiba Jobin Yvon Fluoromax-4 scanning spectrofluorometer. The excitation and emission slit widths used for the fluorescence measurements were 1 nm each. The emission and excitation spectra were corrected for instrument sensitivity. The steady-state fluorescence anisotropy measurements were performed with the same steady-state spectrofluorometer fitted with a polarizer attachment; the details are available elsewhere.23,48,49 The relative fluorescence quantum yields were determined with respect to quinine sulphate in 0.1 N sulphuric acid as standard (ϕf = 0.55), and by calculating the area under the corrected fluorescence bands of both C-490 in different environments and quinine sulphate.50

The excited singlet state lifetimes were determined from intensity decays using a Horiba Jobin Yvon Fluorocube-01-NL picosecond time-correlated single-photon counting (TCSPC) experimental setup. A picosecond diode laser of 375 nm (NanoLED 375L, IBH, UK) was used as a light source. The fluorescence signals were detected at a magic angle (54.7°) polarization using a TBX photon detection module (TBX-07C). The typical full width at half maximum (FWHM) after deconvolution using liquid scattering of the system response was about 165 ps for a 375 nm laser.

The decays were analyzed by IBH DAS-6 decay analysis software. The goodness of fits was analyzed by the χ2 criterion and visual inspection of the residuals of the fitted function to the data.

The time-resolved fluorescence anisotropy r(t) was calculated using eqn (1):

 
image file: c4ra02708f-t1.tif(1)
where G represents the correction factor for the sensitivity of the detector to the polarization detection of emission (the value of G for our instrument is ∼0.6), I(t) and I(t) are the fluorescence decays polarized parallel and perpendicular to the polarization of the excitation light, respectively. The anisotropy decays of C-490 are bi-exponential in nature in RM media. The bi-exponential anisotropy decay function can be represented as eqn (2):
 
image file: c4ra02708f-t2.tif(2)
where ro is the limiting anisotropy representing the inherent depolarization of the probe molecule, τ1r and τ2r are two rotational relaxation components of the probe molecule in RM media, and a1r and a2r are the relative amplitudes of two components, respectively where a1r + a2r = 1. The average rotational relaxation time for the bi-exponential decay in RMs was calculated using eqn (3):
 
τr〉 = a1rτ1r + a2rτ2r (3)

The average excited singlet state lifetime 〈τ〉 for a bi-exponential decay was calculated by eqn (4):44

 
τ〉 = a1τ1 + a2τ2 (4)
where a1 and a2 are the relative amplitudes, and a1 + a2 = 1. τi are the excited singlet state lifetimes. For the solvation dynamics study of C-490, the dynamics are quantitatively measured by the solvent correlation function (SCF) C(t) (eqn (5)), which was explained by Fleming and Maroncelli:51
 
image file: c4ra02708f-t3.tif(5)
where ν(0), ν(t) and ν() are the peak frequencies at time zero, t, and infinity, respectively. For the purpose of evaluating peak frequencies, time-resolved emission spectra (TRES) were constructed using the method of Fleming and Maroncelli,51 collecting the decay profiles at various wavelengths across the entire range of the emission spectrum. To deconvolute the instrument response function, each decay profile was fitted to a mono-exponential or bi-exponential (wherever it was required) function to have χ2 value between 1.0 and 1.2 using the decay analysis software DAS 6. The emission maximum at each time ν(t) was then obtained after fitting the TRES to a log-normal function.51,52 The time constants of the observable solvation were obtained after fitting the plot of solvent correlation function C(t) versus time. To obtain the solvent relaxation time constants, a bi-exponential function (eqn (6)) was used:
 
image file: c4ra02708f-t4.tif(6)
where τ1s and τ2s are the solvent relaxation time constants, a1s and a2s are relative amplitudes; a1s + a2s = 1. The average solvation time 〈τs〉 for a bi-exponential decay was calculated using eqn (7):
 
τs〉 = a1sτ1s + a2sτ2s (7)

All the spectroscopic measurements were carried out at 298.15 ± 1 K.

3. Results and discussions

3.1. UV-Visible absorption spectra

UV-visible absorption spectra of C-490 were measured in pure solvents, CHX + n-pentanol (2.4%) mixed solvent (mentioned as bulk solvent hereafter) and in RM systems. The absorption peak maxima values are tabulated in Table 1. The representative absorption spectra of C-490 in bulk solvent, pure water and RMs are shown in Fig. 1. In bulk solvent, a broad peak was observed at 356 nm. In pure water, the peak maximum appears at 366 nm, which is 10 nm red-shifted with respect to that in bulk solvent and 16 nm blue-shifted with respect to that in pure n-pentanol. This blue shift in the absorption spectra of C-490 in water is due to intermolecular hydrogen bonding interactions between water molecules and several positions of C-490, and is common in the ICT molecule.52–55 On the addition of 20 mM of 12-4-12 gemini surfactant to the bulk solvent, RMs are formed.40 There is a remarkable red shift of the absorption band of C-490 to 387 nm as peak maximum with an increase in absorbance in RMs with respect to that in bulk solvent (peak maximum at 356 nm). With the addition of water in RMs, there is a blue shift in peak maximum by 2 nm with a decrease in absorbance at 356 nm. This observation indicates that C-490 molecules are localised in the pool of RMs. At w0 = 0 and 30, the absorption peak maxima for C-490 are 387 nm and 385 nm, respectively, which are significantly different from those in pure water (peak maximum 366 nm). It implies that the microenvironment around C-490 in RMs is different from that in bulk water.
Table 1 Absorption and fluorescence peak maxima of C-490 in pure solvents, mixed solvent and in RM systems, and ET(30)
Systems λabsmax (nm) λflmaxa (nm) λflmaxb (nm) ET(30) (kcal mol−1)
a λexc = 375 nm.b λexc = 412 nm.
CHX + n-pentanol (2.4%) 356 457 460 39.8
n-Pentanol 382 477 478 49.1
Water 366 496 498 63.1
w0 = 0 387 474 477 47.3
w0 = 2 387 477 480 48.7
w0 = 20 385 482 485 51.3
w0 = 25 385 482 485 51.3
w0 = 30 385 482 485 51.3


image file: c4ra02708f-f1.tif
Fig. 1 UV-visible absorption spectra of C-490 in water, CHX + n-pentanol (2.4%) mixed solvent (bulk solvent) and in RM systems.

3.2. Steady-state fluorescence spectra

Steady-state fluorescence spectra of C-490 in the above-mentioned systems were recorded, and fluorescence peak maxima data are given in Table 1. Fig. 2a and b are the representative fluorescence spectra of C-490 in bulk solvent, pure water and RMs at λexc = 375 nm and 412 nm, respectively. When C-490 is excited at 375 nm, the peak maximum for the fluorescence band in the bulk solvent appears at 457 nm. On the addition of 20 mM (w0 = 0) of 12-4-12 gemini surfactant to the bulk solvent, the fluorescence band is red-shifted remarkably with peak maximum at 474 nm as compared to the bulk solvent. Fluorescence intensity is lower than that in the bulk solvent. On the addition of water to the RMs, there are red shifts in fluorescence band maxima with a decrease in fluorescence intensity at 457 nm. The fluorescence peak maxima in RMs at w0 = 0 and 30 are at 474 nm and 482 nm, respectively, and in pure water the peak maxima is at 496 nm. Thus, fluorescence results imply that with increasing the water content from w0 = 0 to 30, the probe molecules start residing in the pool of RMs, and that the microenvironment around the probe molecules is different from that in bulk water.
image file: c4ra02708f-f2.tif
Fig. 2 Steady-state fluorescence spectra of C-490 in water, bulk solvent and RM systems (a) λexc = 375 nm and (b) λexc = 412 nm.

To investigate the effect of excitation wavelength on fluorescence properties, the fluorescence spectra were also recorded at λexc = 412 nm (Fig. 2b). At this excitation wavelength, molecules residing in the pool of RMs are mostly excited. Therefore, emission characteristics reflect the properties of probe molecules entrapped in the pool of the RMs alone.2 It can be seen from Fig. 2b that the fluorescence intensities of C-490 in all the RMs are much higher than those in the bulk solvent. The fluorescence peak maxima in all the systems are approximately red-shifted by 2–3 nm as compared to the excitation at 375 nm. These results indicate that the probe molecules are partitioned to the interior of the RMs. Fig. 3 displays the excitation spectra of C-490 in RMs at w0 = 30 monitored at two different emission wavelengths, i.e. 435 and 550 nm. The excitation spectrum monitored at 435 nm resembles the absorption spectrum of C-490 in bulk solvent, while the spectrum at 550 nm resembles the absorption spectrum of C-490 at w0 = 30. These observations further demonstrate that C-490 molecules are located in two different environments in the RMs.2,36,37


image file: c4ra02708f-f3.tif
Fig. 3 Excitation spectra of C-490 recorded in w0 = 30 and monitored at (a) λems = 435 nm and (b) 550 nm, and absorption spectra of C-490 in (c) bulk solvent and (d) w0 = 30.

A red shift in the fluorescence peak maximum and a gradual decrease in fluorescence intensity were observed with an increase in w0 from 0 to 30. Hazra et al.36 studied the RMs of conventional surfactants using C-480 as a probe. They observed the location of probe molecules at the interface of the RMs of cationic surfactant CTAB. The different location of C-490 as compared to C-480 is because C-480 is a more hydrophobic probe having a tertiary amine substituent, which is not a hydrogen bond donor. However, C-490 has a primary amine substituent, which is a hydrogen bond donor. The red shift of the fluorescence band is because of the stabilization of the emitting state due to an increase in the static polarity of the pool of RMs with increasing water content, and the decrease in intensity is due to an increase in the rate of non-radiative processes in the more polar environment of the pool. The nature of water molecules becomes more like bulk water with an increasing number of water molecules in the RM pool.41 The decrease in intensity can be explained by introducing the model suggested by Jones II et al.45,56 In 7-aminocoumarin derivatives, a planar highly fluorescent ICT excited state deactivates to a non-fluorescent twisted intramolecular charge transfer (TICT) state.43,57 The conversion of an ICT to a TICT state depends on the static polarity of the environment, and this conversion becomes feasible with an increase in the polarity of the medium.37,58,59 Fluorescence intensity decreases with the increasing polarity of the environment due to the increasing population of the TICT state. In C-490 the main non-radiative path for ICT is the generation of a TICT state.37 Hazra et al.37 also observed red-shifted fluorescence spectra with a decrease in intensity in AOT RMs for C-490.

3.3. Micropolarity and microviscosity

The fluorescence properties of ICT molecular rotors are very sensitive to the microviscosity and micropolarity of the environment.23,49,60 To investigate the microenvironment of C-490 mostly entrapped in the pool of RMs, micropolarity expressed in an equivalent scale ET(30),61,62 which is an empirical solvent polarity parameter, was determined. Micropolarity was estimated by comparing the fluorescence behavior of C-490 in RM systems with that in different compositions of dioxane–water mixture.49 The fluorescence spectra of C-490 in different compositions of dioxane–water mixture were recorded at λexc = 412 nm. The fluorescence peak maxima of C-490 in dioxane-water mixtures of various compositions are plotted against ET(30)23,45 (Fig. S1 in ESI). Using this plot and the fluorescence peak maxima values of C-490 in different RMs, micropolarities in terms of ET(30) were calculated, and are given in Table 1. For calculating ET(30), the λflmax values obtained after excitation at 412 nm were considered to ensure that the probe molecules residing in the pool of RMs are only emitting. It can be seen that the ET(30) values for the RM systems are less than the ET(30) of water. This indicates that the average microenvironment of the probe molecules is less polar than that of the bulk water. At w0 = 30, the ET(30) value is close to that of ethanol [ET(30) = 51.9 kcal mol−1].61 This result implies that the probe molecules are mostly located in the water pool of the RMs. The slightly lower polarity observed as compared to AOT RMs2,36 is due to the presence of some probe molecules in the bulk solvent.

The steady-state fluorescence anisotropies of C-490 in all the RM systems were determined.48,49 Anisotropy decreases with a decrease in the rigidity of the environment.50,60 The steady-state anisotropy values of C-490 in all the RM systems are shown in Fig. 4. With an increase in w0, the steady-state anisotropy gradually decreases. It indicates that the microenvironment around C-490 becomes less rigid with increasing water content in RMs. In the RMs of a cationic gemini surfactant, Zhao et al.41 observed that with increasing w0 the amount of bulk-like water per surfactant rapidly increases; therefore, RMs swell. At higher w0, there is a decrease in the microviscosity of the environment around C-490, which is reflected by the lowering of steady-state anisotropy values. An increase in the polarity and a decrease in the microviscosity of the environment around C-490 for changing w0 from 0 to 30 indicate that the probe molecules are entrapped in the water pool of the RMs.


image file: c4ra02708f-f4.tif
Fig. 4 Steady-state fluorescence anisotropy (r) of C-490 vs. w0. Inset (a) plot of average rotational correlation times (τc) vs. w0 and (b) non-radiative rate constant (knr) vs. w0. λexc = 375 nm.

The average rotational correlation times for C-490 in RMs with increasing w0 were calculated by using Perrin's equation50 (eqn (8)). It ensures that the observed change in the steady-state anisotropy of C-490 with increasing w0 is not because of any change in lifetime.

 
τc = (〈τr)/(ror) (8)
where ro, r, and 〈τ〉 are the limiting anisotropy (=0.36, discussed later), steady-state anisotropy, and mean fluorescence lifetime of C-490 (discussed later), respectively. We can approximately use Perrin's equation using mean fluorescence lifetime because this equation is not strictly valid in heterogeneous media.50,63 Using the above equation, the rotational correlation times were determined at different w0 values. It can be seen from the inset of Fig. 4 that the rotational correlation time decreases with increasing w0. This result clearly indicates that the observed change in steady-state anisotropy is not because of any lifetime-induced artifacts. The decrease in rotational correlation time with increasing w0 supports our abovementioned conjecture that the rotational restriction experienced by the C-490 molecule is reduced with increasing w0. Mallick et al.50 also observed a decrease in rotational correlation times with an increase in the hydration in AOT RMs using the AODIQ probe molecule.

3.4. Excited singlet state lifetime

3.4.1. Radiative and non-radiative rate constants in RMs. In the case of ICT type molecular rotors because of the existence of the TICT state, the rates of non-radiative (knr) processes increase with an increase in the polarity of the medium due to a greater extent of stabilization of the TICT state.36 The rates of the radiative and non-radiative processes for C-490 in RMs were calculated using the following equations,2,37,50 and are summarized in Table 2:
 
kr = ϕf/τ (9)
 
knr = (kr/ϕf) − kr (10)
where ϕf and τ are the fluorescence quantum yield and excited singlet state lifetime, respectively, and kr and knr are the radiative and non-radiative decay rate constants, respectively. The rates for non-radiative decay processes increase for RMs with w0 = 0 to w0 = 20, and after that rates remain unchanged. It has been already stated that the steady-state emission spectra of C-490 show a bathochromic shift with an increase in the water content of RMs. Quantum yield (ϕf) decreases with the increasing water content of the RMs (Table 2). With increasing water content, the probe molecule C-490 experiences a more polar environment in the water pool of RMs and the excited singlet state gets stabilized. Therefore, the rates for non-radiative processes increase.58 However, the change in the rates for non-radiative processes is not very sensitive to the polarity of the environment, as was also reported by Hazra et al.37 The rates for non-radiative processes in these gemini surfactant RMs were found to be almost doubled as compared to AOT RMs.37
Table 2 Fluorescence quantum yield (ϕf), excited singlet state lifetimes (τi), radiative (kr) and non-radiative rate constants (knr) of C-490 in different systemsa
Systems ϕf τ1 (ns) a1 τ2 (ns) a2 τ〉 (ns) kr × 10−9 (s−1) knr × 10−9 (s−1) χ2
a λexc (for both steady-state and time-resolved) = 375 nm. Lifetime measured at λflmax.
CHX + n-pentanol 0.604 2.670 0.20 4.990 0.80 4.520 0.133 0.088 1.05
w0 = 0 0.610 3.690 0.27 4.347 0.73 4.169 0.146 0.094 1.08
w0 = 2 0.594 2.950 0.15 4.127 0.85 3.950 0.150 0.103 1.05
w0 = 20 0.511 2.680 0.21 3.738 0.79 3.516 0.145 0.139 1.03
w0 = 25 0.504 2.675 0.24 3.761 0.76 3.500 0.144 0.141 1.06
w0 = 30 0.499 2.188 0.13 3.662 0.87 3.470 0.143 0.144 1.07
Water 0.266 4.560 1.00 4.560 0.058 0.161 1.02


3.5. Time-resolved fluorescence anisotropy

To obtain further and more accurate information regarding the microenvironment surrounding the probe molecule in RMs, time-resolved fluorescence anisotropy measurements were performed. The time-resolved fluorescence anisotropy technique can be employed to obtain valuable information regarding the rotational relaxations of the probe within an organized assembly.33 The rotational relaxation time of C-490 in RMs was calculated using eqn (1) and monitoring fluorescence intensity at 477 nm (Table 3). The time resolved fluorescence anisotropy decays are shown in Fig. 5. The anisotropy decay in pure solvents was fitted by a single exponential decay function and in all the RM systems it was bi-exponential (eqn (2)).33 The relaxation process is much slower in RMs than that in the bulk solvent and bulk water.64 The average rotational relaxation time of C-490 decreases with an increasing amount of water in the pool of RMs. It indicates that with increasing the water content in the RMs from w0 = 0 to w0 = 30, the restrictive environment around C-490 becomes flexible. On increasing the water content in RMs, the size of the RM pool increases and the amount of bulk-like water also increases.41 These results further infer that the probe molecules are mostly located in the pool of RMs. However, these results are in contrast to a study on the RMs formed by CTAB carried out by Hazra et al.36 They reported that the probe molecule C-480 resides at the interface of the RMs. One reason for the dependency of the relaxation time of C-490 on w0 in the present study is the possibility of forming larger droplets in the case of RMs of gemini surfactant as compared with the RMs of conventional surfactants.42 Another reason could be, as mentioned above, the less hydrophobic nature of C-490 as compared to C-480.
Table 3 Rotational relaxation time of C-490 in pure solvents and RMs of gemini surfactant (12-4-12)
System r0 a1r τ1r (ns) a2r τ2r (ns) τr〉 (ns)
CHX + n-pentanol (2.4%) 0.20 1 0.194 0.194
n-Pentanol 0.30 1 0.613 0.613
w0 = 0 0.36 0.45 0.691 0.55 4.692 2.892
w0 = 2 0.36 0.39 0.518 0.61 4.026 2.658
w0 = 25 0.36 0.58 0.473 0.42 3.335 1.675
w0 = 30 0.36 0.62 0.457 0.38 3.295 1.535


image file: c4ra02708f-f5.tif
Fig. 5 Time-resolved fluorescence anisotropy decay of C-490 in RMs of 12-4-12.

The rotational relaxation time of C-490 in pure water is reported to be 95 ps.63 At w0 = 2, the relaxation process of C-490 in the present RMs is ∼14 times slower as compared to the bulk solvent and ∼28 times slower as compared to the bulk water. These results suggest that C-490 molecules are experiencing a more rigid environment in the pool of RMs than that in bulk solvent and bulk water. Therefore, the environment around the probe in the RM pool is different from that in bulk solvent and bulk water. The decrease in the rotational relaxation time with an increase in the amount of polar solvent in the AOT RMs has also been observed in other studies.7,33

3.6. Solvation dynamics

The fluorescence decays of C-490 in all the RM systems, n-pentanol and bulk solvent were recorded. The wavelength-dependent decays were observed for all these systems. In pure CHX and water, C-490 does not show any wavelength-dependent fluorescence decay. Fig. 6 represents the fluorescence decays of C-490 in RMs at w0 = 2. The decay at a short wavelength (425 nm) is very fast. However, at a longer wavelength (560 nm) it becomes slower, and there is a clear growth initially in the decay, which was followed by a slow decay with a negative pre-exponential factor. The fast decay at a short wavelength corresponds to the fluorescence from the unsolvated dipoles of C-490 created at the excited state without undergoing any relaxation process. However, decay occurring at longer wavelengths corresponds to the relaxation of the solvated dipoles followed by fluorescence emission, and is thus delayed by relaxation time.48,65
image file: c4ra02708f-f6.tif
Fig. 6 Time-resolved fluorescence decay of C-490 in 12-4-12 RMs (w0 = 2). 1 to 4 at 560 nm, 470 nm, 455 nm, and 425 nm, respectively, and 5 for instrument response function.

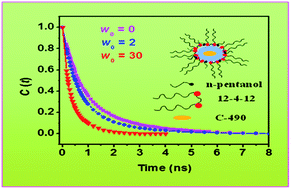
The time-resolved emission spectra (TRES) were constructed by applying the procedure of Fleming and Maroncelli.51 The dynamic Stokes shifts have been observed for the emission spectra of C-490 in n-pentanol, bulk solvent and RMs. A representative TRES is shown in the inset of Fig. 7. The solvent dynamics are monitored by solvent correlation function (SCF) C(t). Fig. 7 represents a plot of C(t) with time (t) at different w0. The decay characteristics of C(t) for RMs at various w0, n-pentanol, and for bulk solvent are tabulated in Table 4. The solvation time for n-pentanol was found to be 128 ps with a single exponential. Corbeil et al.34 reported this value to be 97 ps with a probe molecule C-343. This difference observed in solvation time could be due to the use of a different probe molecule and a different technique.


image file: c4ra02708f-f7.tif
Fig. 7 Decay of solvent correlation function C(t) of C-490 in RMs at (■) w0 = 0, (●) w0 = 2, (▼) w0 = 30. Inset shows the TRES of C-490 in RMs at w0 = 2 at (1) 0 ps, (2) 200 ps, (3) 1000 ps and (4) 4000 ps.
Table 4 Decay characteristics of C(t) of C-490 in RMs of gemini surfactant
Systems Δν (cm−1) a1s τ1s (ns) a2s τ2s (ns) τs〉 (ns) Missing component
CHX + n-pentanol (2.4%) 852 0.68 1.797 0.32 1.756 1.784
n-Pentanol 918 1 0.128 0.128
w0 = 0 816 0.60 0.612 0.40 1.828 1.098 0.053
w0 = 2 691 0.65 0.514 0.35 1.561 0.880 0.172
w0 = 25 386 0.71 0.356 0.29 1.624 0.724 0.703
w0 = 30 331 0.76 0.203 0.24 0.682 0.318 0.710


The average solvation time of C-490 in the bulk solvent was found to be 1.78 ns. This solvation time is greater as compared to pure n-pentanol. The slower solvation process in the mixed solvent system as compared to pure solvent was also observed by Hazra et al.36 The data in Table 4 reveal that C(t) consists of two components for the RMs, one with a longer lifetime and another with a shorter lifetime. The bimodal decay arises due to the presence of bound and free water molecules, and there is a dynamic exchange between them.29 In the present work, the bulk solvent in RMs consists of 2.4% n-pentanol. The presence of n-pentanol affects solvent reorganization in RMs. Corbeil et al.34 also observed the effect of n-pentanol for RMs of conventional surfactants. It is evident from the data in Table 4 that the solvation time corresponding to the slow component in RMs at w0 = 0 is close to that in the bulk solvent. However, the solvation time corresponding to the fast component in RMs with major weightage is very different from that in bulk solvent. The solvation time in RMs is also very different from that in pure n-pentanol. It is much faster in pure n-pentanol than that in RMs. Hence, the observed solvation dynamics in RMs is not exclusively the dynamics of n-pentanol in bulk solvent. The increase in the solvation time of n-pentanol in the vicinity of the cationic headgroups of gemini surfactant is clear because there is an electrostatic interaction between the lone pair of electrons of the oxygen atom of the hydroxyl group of n-pentanol and the positively charged nitrogen atom of the gemini surfactant.36

The solvation time for the slow component at w0 = 30 is reduced by more than half as compared to w0 = 0. On comparison with the steady-state fluorescence spectra of C-490 in bulk solvent and in RMs at w0 = 30, we found that the band in RMs is 25 nm red-shifted as compared to bulk solvent. These results indicate that C-490 molecules are moving towards the polar core of the RMs with increasing water loading. The number of free water molecules becomes greater at w0 = 30 than that at lower w0, and the solvation dynamics becomes faster.3,33 It has been found that the relative contribution of the fast component gradually increases with a subsequent decrease in the contribution of the slow component of solvation with an increasing water content in RMs (Table 4). Moreover, the solvation time for the fast components, along with the average solvation time, gradually decreases. Hazra et al.3 during their study on non-aqueous AOT RMs observed that the average solvation time decreases with the increasing content of polar solvents and concluded that the probe molecules C-490 are approaching the core of the RMs. However, in another study on the microemulsions of conventional cationic surfactant CTAB with C-480 as a probe, they noticed that the solvation dynamics at the interface is independent of water loading.36 However, in the present study with RMs of cationic gemini surfactant, the solvation dynamics mostly occurs in the water pool of the RMs; thus, the dynamics is dependent on water loading. Although the location of the probe molecules could be a reason for this difference in solvation dynamics, Corbeil et al.34 noticed water loading-independent dynamics even with a more polar dye (C-343) as compared to C-480 and C-490. Clearly, in the case of C-343, there are electrostatic interactions between the quaternary ammonium headgroup of CTAB and the –COO functional group of C-343.34 However, the difference in the structure of RMs of gemini surfactant and those of conventional cationic surfactants is also responsible for the dependence of solvation dynamics on water loading, as discussed in the following paragraph.

In the present work, the dependency of solvent relaxation time of C-490 on w0 is because of the larger droplets, which are formed in the case of RMs of 12-4-12 gemini surfactant42 as compared to the RMs of conventional surfactants. Larger droplets are suitable for solubilizing more water.42 Zhao et al.42 reported that the variation in the size of water pool with increasing w0 is more sensitive for the RMs of gemini surfactants as compared to conventional surfactants.42 It is worth noting that the solvation dynamics does not depend on the chain length of alcohol used to form RMs for CTAB–n-heptanol–cyclohexane–water and CTAB–n-pentanol–cyclohexane–water RMs, as reported by Corbeil et al.34 The –OH groups of alcohol molecules interact with the headgroups of gemini surfactant. With the increasing size of the water pool, the interfacial curvature is reduced, which allows more water molecules to associate with the ionic heads of gemini surfactant. Therefore, a part of the alcohol molecules are expelled from the interface.41 Based on the results obtained by Zhao et al.42 on gemini surfactant RMs, we can suggest that in the present case the surfaces of larger droplets formed by 12-4-12 gemini surfactant require smaller amounts of alcohol in the gaps between the headgroups of the surfactant as compared to conventional surfactants. A lesser extent of hydrogen bonding interaction between –OH groups of the alcohol and the C-490 molecule is expected at the interface of the present RMs of gemini surfactant than those of conventional surfactants. Consequently, the solvation time in Gemini surfactant RMs is faster as compared to conventional surfactants. Because the location of the probe molecules in the present gemini surfactant RMs is different from that in the reported RMs of conventional surfactants, the timescale of solvation dynamics is also different in these two cases. The solvation dynamics in the pool of the present gemini surfactant RMs are faster than those in the bulk solvent, which is different from the RMs of conventional surfactants.34 The solvation time for pure water is 0.5 ps.37 Thus, the water dynamics are many times slower in the pool of RMs as compared to bulk water. It is worth noting that the contribution from Br ions to the measured solvation dynamics in the pool of RMs is considered negligible.36 However, some of the n-pentanol molecules present at the interface would also contribute to the salvation dynamics.

It is reported that solvation time depends upon the nature of molecular assemblies.32 The solvation time observed in the present study with cationic gemini surfactant RMs is different from that observed by other researchers in AOT RMs using the same probe C-49037 and by different probe molecules.33 The solvation time of solvent molecules in organised assemblies depends on the interactions between the solvent molecules and the organised assemblies.32 Hydrogen bonding, electrostatic interaction, counter-ion interaction, etc., make the relaxation process of a solvent many times slower in organised assemblies as compared to bulk solvent. We observed faster solvation as compared to the solvation (at w0 = 4 and w0 = 32 the average solvation times are 2.97 and 1.17 ns, respectively) in AOT RMs using the same probe C-490 reported by Hazra et al.37 They reported the average solvation time in nanosecond timescales but we have reported the average solvation time in sub-nanosecond timescales with different water content in the RMs except at w0 = 0, where there is no water molecule added externally. Clearly, the solvation time will be different because the headgroups of AOT and gemini surfactant are different. In AOT RMs, there is strong hydrogen bonding between the water molecules and the oxygen atoms of the AOT surfactant. Hydrogen bonding between water molecules and the quaternary ammonium headgroups of gemini surfactant is absent in the RMs of gemini surfactant. However, there are n-pentanol molecules present at the interface of the RMs of the gemini surfactant but the hydrogen bonding of water molecules with n-pentanol may not be as strong as with the oxygen atoms of AOT surfactant.41 Zhao et al.41 on the basis of their FT-IR study confirmed the weak interaction between n-hexanol and water molecules at the interface of RMs.

The method proposed by Fee and Maroncelli51,66 was used for calculating time zero frequency (eqn (11)) for C-490 in RMs because the excitation wavelength 375 nm and absorption maxima ∼385 nm in RMs are very close:

 
νp,md(t = 0) ≈ νp,md(abs) − [νnp,md(abs) − νnp,md(ems)] (11)
where the subscripts ‘p’ and ‘np’ refer to the polar and nonpolar solvent, respectively. Here, the frequencies are not the frequencies at the maxima but correspond to the midpoint frequencies (νmd) in the solvent. CHX is used as the nonpolar solvent. It can be seen from Table 4 that the missing component increases with increasing w0 values. The increase in the missing component with w0 is reasonable because with increasing w0, the water inside the RMs behaves as bulk water. Shirota et al.32 observed the increasing tendency of missing component with increasing the methanol content in AOT RMs using C-343 as a fluorescent probe molecule.

4. Conclusions

The steady-state fluorescence, steady-state fluorescence anisotropy, rotational relaxation and solvation dynamics data suggest that the probe molecule C-490 resides in the water pool of the gemini surfactant 12-4-12–cyclohexane–n-pentanol–water RMs. This result is unlike C-480 and C-343, which are reported to be present at the interface of the RMs of conventional cationic surfactants. C-490 is less hydrophobic than C-480. C-343 undergoes electrostatic interactions with the quaternary ammonium headgroup of a cationic surfactant. However, the structure of RMs is also responsible for the different locations of the probe molecules. The droplet size of the present RMs is larger than that of the RMs of conventional cationic surfactant. Thus, a smaller extent of hydrogen bonding interaction between the –OH groups of alcohol and the probe molecule occurs at the interface of the present RMs as compared to conventional cationic surfactants. In the present case, more and more probe molecules move towards the water pool on increasing the content of water molecules, and thus the rotational relaxation, solvation dynamics and other steady-state fluorescence properties depend on w0. For the same reason, the solvation dynamics in gemini surfactant RMs are one order of magnitude faster as compared with the previously reported RMs of conventional cationic surfactant. As compared to AOT RMs, the comparatively faster solvation dynamics observed in gemini RMs are due to the absence of hydrogen bonding interaction between the water molecules and quaternary ammonium headgroups of surfactant in gemini RMs. The polarity of the medium has very little effect on the rates of non-radiative processes in the water pool of RMs. These rates are found to be double of those in AOT RMs.

Acknowledgements

SKS acknowledges the University Grants Commission (UGC) special assistance program (F.540/14/DRS/2007 (SAP-I)), Department of Science and Technology (DST) FIST program, Government of India and also the Aditya Birla Group for financial support. Sonu acknowledges UGC for financial support under junior research fellowship. AKT acknowledges CSIR for financial support under senior research fellowship.

References

  1. P. L Luisi, M. Giomini, M. P Pileni and B. H Robinson, Biochim. Biophys. Acta, 1988, 947, 209 CrossRef.
  2. P. Hazra, D. Chakrabarty and N. Sarkar, Langmuir, 2002, 18, 7872 CrossRef CAS.
  3. P. Hazra and N. Sarkar, Phys. Chem. Chem. Phys., 2002, 4, 1040 RSC.
  4. N. M. Correa, J. J. Silber, R. E. Riter and N. E. Levinger, Chem. Rev., 2012, 112, 4569 CrossRef CAS PubMed.
  5. D. Mandal, S. K. Pal, A. Datta and K. Bhattacharya, Anal. Sci., 1998, 14, 199 CrossRef CAS.
  6. T. K. Jain, M. Varshney and A. Maitra, J. Phys. Chem., 1989, 93, 7409 CrossRef CAS.
  7. R. E. Riter, D. M. Willard and N. E. Levinger, J. Phys. Chem. B, 1998, 102, 2705 CrossRef CAS.
  8. S. Abel, F. Sterpone, S. Bandyopadhyay and M. Marchi, J. Phys. Chem. B, 2004, 108, 19458 CrossRef CAS.
  9. I. R. Piletic, D. E. Moilanen, D. B. Spry, N. E. Levinger and M. D. Fayer, J. Phys. Chem. A, 2006, 110, 4985 CrossRef CAS PubMed.
  10. B. Baruah, J. M. Roden, M. Sedgwick, N. M. Correa, D. C. Crans and N. E. Levinger, J. Am. Chem. Soc., 2006, 128, 12758 CrossRef CAS PubMed.
  11. A. Bumajdad, J. Eastoe, P. Griffiths, D. C. Steytler, R. K. Heenan, J. R. Lu and P. Timmins, Langmuir, 1999, 15, 5271 CrossRef CAS.
  12. A. Bumajdad, J. Eastoe, S. Nave, D. C. Steytler, R. K. Heenan and I. Grillo, Langmuir, 2003, 19, 2560 CrossRef CAS.
  13. Q. Li, T. Li and J. Wu, J. Phys. Chem. B, 2000, 104, 9011 CrossRef CAS.
  14. N. Nandi, K. Bhattacharya and B. Bagchi, Chem. Rev., 2000, 100, 2013 CrossRef CAS PubMed.
  15. M. L. Horng, J. A. Gardecki and M. Maroncelli, J. Phys. Chem. A, 1997, 101, 1030 CrossRef CAS.
  16. R. Jimenej, G. R. Fleming, P. V. Kumar and M. Maroncelli, Nature, 1994, 369, 471 CrossRef.
  17. S. K. Pal, D. Sukul, D. Mandal, S. Sen and K. Bhattacharyya, J. Phys. Chem. B, 2000, 104, 2613 CrossRef CAS.
  18. D. K. Sasmal, S. S. Mojumdar, A. Adhikari and K. Bhattacharyya, J. Phys. Chem. B, 2010, 114, 4565 CrossRef CAS PubMed.
  19. D. Chakrabarty, P. Hazra, A. Chakraborty and N. Sarkar, J. Phys. Chem. B, 2003, 107, 13643 CrossRef CAS.
  20. P. Setua, C. Ghatak, V. G. Rao, S. K. Das and N. Sarkar, J. Phys. Chem. B, 2012, 116, 3704 CrossRef CAS PubMed.
  21. R. Karmakar and A. Samanta, J. Phys. Chem. A, 2002, 106, 6670 CrossRef CAS.
  22. M. Amaro, J. Brezovský, S. Kováčová, L. Maier, R. Chaloupková, J. Sýkora, K. Paruch, J. Damborský and M. Hof, J. Phys. Chem. B, 2013, 117, 7898 CrossRef CAS PubMed.
  23. A. K. Tiwari, Sonu and S. K. Saha, J. Phys. Chem. B, 2014, 118, 3582 CrossRef CAS PubMed.
  24. D. K. Sasmal, S. Ghosh, A. K. Das and K. Bhattacharyya, Langmuir, 2013, 29, 2289 CrossRef CAS PubMed.
  25. S. K. Das and M. Sarkar, J. Lumin., 2012, 132, 368 CrossRef CAS PubMed.
  26. A. Patra, P. K. Verma and R. K. Mitra, J. Phys. Chem. B, 2012, 116, 1508 CrossRef CAS PubMed.
  27. R. Pramanik, S. Sarkar, C. Ghatak, V. G. Rao and N. Sarkar, Chem. Phys. Lett., 2011, 512, 217 CrossRef CAS PubMed.
  28. A. Sengupta, R. V. Khade and P. Hazra, J. Phys. Chem. A, 2011, 115, 10398 CrossRef CAS PubMed.
  29. N. Nandi and B. Bagchi, J. Phys. Chem. B, 1997, 101, 10954 CrossRef CAS.
  30. M. Maroncelli, X. X. Zhang, M. Liang, D. Roy and N. P. Ernsting, Faraday Discuss., 2012, 154, 409 RSC.
  31. X. X. Zhang, M. Liang, N. P. Ernsting and M. Maroncelli, J. Phys. Chem. B, 2013, 117, 4291 CrossRef CAS PubMed.
  32. Y. Tamoto, H. Segawa and H. Shirota, Langmuir, 2005, 21, 3757 CrossRef CAS PubMed.
  33. H. Shirota and K. Horie, J. Phys. Chem. B, 1999, 103, 1437 CrossRef CAS.
  34. E. M. Corbeil and N. E. Levinger, Langmiur, 2003, 19, 7264 CrossRef CAS.
  35. C. D. Grant, M. R. D. Ritter, K. E. Steege, T. A. Fadeeva and E. W. Castner, Jr, Langmuir, 2005, 21, 1745 CrossRef CAS PubMed.
  36. P. Hazra, D. Chakrabarty, A. Chakraborty and N. Sarkar, Chem. Phys. Lett., 2003, 382, 71 CrossRef CAS PubMed.
  37. P. Hazra and N. Sarkar, Chem. Phys. Lett., 2001, 342, 303 CrossRef CAS.
  38. F. M. Menger and J. S. Keiper, Angew. Chem., Int. Ed., 2000, 39, 1906 CrossRef.
  39. R. Zana, Adv. Colloid Interface Sci., 2002, 97, 205 CrossRef CAS.
  40. D. Shukla and V. K. Tyagi, J. Oleo Sci., 2006, 55, 381 CrossRef CAS.
  41. J. Zhao, S. Deng, J. Liu, C. Lin and O. Zheng, J. Colloid Interface Sci., 2007, 311, 237 CrossRef CAS PubMed.
  42. O. Zheng, J. Zhao and X. Fu, Langmuir, 2006, 22, 3528 CrossRef CAS PubMed.
  43. O. Zheng, J. X. Zhao and X. M. Fu, J. Colloid Interface Sci., 2006, 300, 310 CrossRef CAS PubMed.
  44. O. Zheng, J. X. Zhao and X. M. Fu, Acta Phys.-Chim. Sin., 2006, 22, 322 CrossRef CAS.
  45. G. Jones, W. R. Jackson, C. Y. Choi and W. R. Bergmark, J. Phys. Chem., 1985, 89, 294 CrossRef CAS.
  46. K. Rechthaler and G. Kohlar, Chem. Phys., 1994, 189, 99 CrossRef CAS.
  47. R. Zana, M. Benrraou and R. Rueff, Langmuir, 1991, 7, 1072 CrossRef CAS.
  48. J. R. Lakowicz, Principles of fluorescence spectroscopy, Kluwer Academic, New York, 1999 Search PubMed.
  49. S. Muthusubramanian, A. K. Tiwari, Sonu and S. K. Saha, Soft Matter, 2012, 8, 11072 RSC.
  50. A. Mallick, B. Haldar, S. Maiti, S. C. Bera and N. Chattopadhyay, J. Phys. Chem. B, 2005, 109, 14675 CrossRef CAS PubMed.
  51. M. Maroncelli and G. R. Fleming, J. Chem. Phys., 1987, 86, 6221 CrossRef CAS PubMed.
  52. A. Maciejewski, J. Kubicki and K. Dobek, J. Phys. Chem. B, 2003, 107, 13986 CrossRef CAS.
  53. B. K. Paul, A. Samanta, S. Kar and N. Guchhait, J. Lumin., 2010, 130, 1258 CrossRef PubMed.
  54. Z. Grabowski, K. Rotkiewicz and W. Rettig, Chem. Rev., 2003, 103, 3899 CrossRef PubMed.
  55. A. Mallick, P. Purkayastha and N. Chattopadhya, J. Photochem. Photobiol., C, 2007, 8, 109 CrossRef CAS PubMed.
  56. W. R. Bergmark, A. Davis, C. York, A. Macintosh and G. Jones, J. Phys. Chem., 1990, 94, 5020 CrossRef CAS.
  57. X. Li, M. Liang, A. Chakraborty, M. Kondo and M. Maroncelli, J. Phys. Chem. B, 2011, 115, 6592 CrossRef CAS PubMed.
  58. J. M. Hicks, M. Vandersall, Z. Babarogic and K. B. Eisenthal, Chem. Phys. Lett., 1985, 116, 18 CrossRef CAS.
  59. A. Dutta, D. Mandal, S. K. Pal and K. Bhattacharyya, J. Phys. Chem. B, 1997, 101, 10221 CrossRef.
  60. A. K. Tiwari, Sonu, M. Sowmiya and S. K. Saha, J. Photochem. Photobiol., A, 2011, 223, 6 CrossRef CAS PubMed.
  61. C. Reichardt, Chem. Rev., 1994, 94, 2329 CrossRef.
  62. E. M. Kosower, H. Dodiuk, K. Tanizawa, M. Ottolenghi and N. Orbach, J. Am. Chem. Soc., 1975, 97, 2167 CrossRef CAS.
  63. H. Raghuraman, S. K. Pradhan and A. Chattopadhyay, J. Phys. Chem. B, 2004, 108, 2489 CrossRef CAS.
  64. D. Chakrabarty, P. Hazra, A. Chakraborty and N. Sarkar, Chem. Phys. Lett., 2004, 392, 340 CrossRef CAS PubMed.
  65. K. Bhattacharyya, Chem. Commun., 2008, 2848 RSC.
  66. R. S. Fee and M. Maroncelli, Chem. Phys., 1994, 183, 235 CrossRef CAS.

Footnote

Electronic supplementary information (ESI) available: 1H NMR data of synthesized gemini surfactant (12-4-12) and plot of ET(30) versus fluorescence maxima of C-490 in dioxane–water mixtures. See DOI: 10.1039/c4ra02708f

This journal is © The Royal Society of Chemistry 2014
Click here to see how this site uses Cookies. View our privacy policy here.