Competitive adsorption of Li, Na, K, Rb and Cs ions onto calcium alginate–potassium tetraphenylborate composite adsorbent
Tan Guoab,
Yaoqiang Huab,
Xiaolei Gaoab,
Xiushen Yea,
Haining Liu*a and
Zhijian Wu*a
aKey Laboratory of Salt Lake Resources and Chemistry, Qinghai Institute of Salt Lakes, Chinese Academy of Sciences, Xining 810008, China. E-mail: liuhn@isl.ac.cn
bUniversity of Chinese Academy of Sciences, Beijing 100049, China. E-mail: zjw6512@hotmail.com
First published on 23rd May 2014
Abstract
In this study, the calcium alginate–potassium tetraphenylborate (Ca(ALG)2–KB(C6H5)4) composite adsorbent was synthesized using potassium tetraphenylborate (KB(C6H5)4) as the adsorption-active component and calcium alginate (Ca(ALG)2) as the matrix material. Different techniques were used for characterization of the adsorbent such as SEM, EDS, XRD, laser particle size analysis and moisture analysis. Competitive adsorption of Li, Na, K, Rb, Cs ions onto the adsorbent was investigated through kinetic curves, adsorption isotherms and column techniques at 25 °C. The equilibrium adsorption capacities were compared in the single-element and multi-element systems. The equilibrium adsorption amount was in the sequence Cs+ > Rb+ ≫ Na+ ∼ Li+, and Li and Na ions were hardly adsorbed. The separation factor was found to follow the order βCs/Li > βRb/Li > βNa/Li under both the noncompetitive and competitive adsorption conditions. In the kinetic experiments for competitive adsorption, the adsorption reached equilibrium in about 24 h. The equilibrium sorption data were described by the Langmuir and Freundlich isotherm models and the results showed that the Langmuir model with determination coefficients of 0.997 and 0.981 for Cs+ and Rb+ respectively could describe the competitive system at room temperature more correctly. Lower breakthrough ratio and higher adsorption amount were observed for Cs+ in the column experiments for competitive adsorption. Ion-exchange was deduced as the mechanism for selective adsorption of Rb+ and Cs+ ions onto the composite on the basis of EDS and XRD analysis of the adsorbent before and after adsorption. The tetraphenylborate anion (B(C6H5)4−) had different affinity to different alkali metal ions following the order Cs+ > Rb+ > K+ due to the order of the solubility product Ksp (CsBph4) < Ksp (RbBph4) < Ksp (KBph4).
Introduction
Rubidium and cesium as highly dispersed and precious metal elements are extraordinarily significant resources. They have played an important role in many fields. In health care, rubidium and cesium can be used to treat nerve atrophy, tumors and cancer.1,2 They are also used for manufacturing photocells, spectrographs and scintillation detectors because of their excellent optical and electronic properties.3–5 The metals or compounds of rubidium and cesium which have a good catalytic effect on hydrogenation and cracking reactions are widely used in biological and chemical areas.6 In addition, they are extensively studied as a thruster in aviation sciences, as a atomic clock in navigation systems,7 as a magnetic fluid in power generation technologies, etc.Radioactive cesium is also of great concern in the environment, public health, and safety aspects. 137Cs with a half life of 30.5 years is a fission product typically present in the nuclear spent fuel. The well-known examples are radiological accidents in 1986 in Chernobyl8,9 and in 2011 in Fukushima10,11 where many people were injured and the environment became contaminated. So it is crucial to dispose 137Cs by means of separation materials possessing strong adsorption ability.
Under natural conditions, rubidium and cesium exist in the salt lake, geothermal water and oil field brine besides ore minerals. Rubidium and cesium as the accompanying elements usually coexist with other alkali metals such as lithium, sodium and potassium in the widespreadly distributed liquid resources. Separation and extraction of these coexisting elements have been one of the most difficult problems due to their close similarity in physical and chemical characteristics. Adsorption is one of the effective methods to separate or extract rubidium and cesium from aqueous solutions. Current studies on the adsorption of alkali metal ions are mainly focused on the adsorption of one kind of alkali metal ion, especially lithium or cesium ion.12,13 However, the adsorption of rubidium and cesium ions would be affected by the presence of other alkali metal ions. Therefore, it is necessary to investigate the competitive adsorption behavior of the alkali metal ions in multi-element aqueous solutions.
In order to find a specific material for the effective separation of alkali metal ions, we describe a simple method to produce Ca(ALG)2–KB(C6H5)4 composite adsorbent by the sol–gel process. In this paper, the adsorbent was characterized by different methods such as SEM, EDS, XRD, laser particle size analyzer and moisture analyzer. Investigation was performed on the adsorption behavior of the typical coexistent ions Li+, Na+, K+, Rb+ and Cs+ onto the adsorbent.
Experimental
Materials
Lithium chloride, sodium chloride, potassium chloride, rubidium chloride, cesium chloride and calcium chloride purchased from Tianjin Baishi Chemical Industry Co. Ltd., China. Sodium tetraphenylborate and sodium alginate were supplied from Shanghai Chemical Reagent Co. Ltd. and Sinopharm Chemical Reagent Co. Ltd., respectively. All reagents were analytical grade except for sodium alginate (Chemical Grade) without further purification. All aqueous solutions were prepared with water that had been purified.Preparation of the composite adsorbent
The powder of potassium tetraphenylborate (KB(C6H5)4) as the adsorption-active component was freshly prepared by the following procedures. Firstly, the KB(C6H5)4 suspension was prepared through precipitation by mixing 30 mL 1.0 mol L−1 KCl solution and 100 mL 10% NaB(C6H5)4 solution under stirring. Then this suspension was dried for 48 h at 40 °C to remove water and ground into powder.During the preparation of calcium alginate–potassium tetraphenylborate (Ca(ALG)2–KB(C6H5)4) composite adsorbent, 10 g KB(C6H5)4 powder was dispersed into 100 mL 2% sodium alginate (NaALG) solution under stirring to get uniform suspensions. These suspensions were pumped dropwise into 200 mL 4% CaCl2 solution by a syringe to obtain composite gel beads. The gel beads were filtered from the solutions after aging 48 h. Successively, they were washed several times with distilled water till no Cl− and then stored in distilled water. The wet composite gel beads defined as Ca(ALG)2–KB(C6H5)4 were used for the adsorption experiments. Before use, the beads were collected and the water in excess of the adsorbent surface was adsorbed by filter papers.
Characterization of the composite adsorbent
The SEM image of the powder of KB(C6H5)4 was taken on a JSM-5610LV SEM instrument (JEOL Ltd., Japan). Before taking the SEM image the adsorbents were coated with a thin gold film. The powder particle size of the prepared KB(C6H5)4 was determined by laser particle size analyzer (BT-9300S, Dandong Baite Instruments Co., Ltd., China). The water content of the wet composite adsorbent was determined by a MB45 moisture analyzer (Ohaus Corporation, Switzerland). The composite adsorbent before and after adsorption was dried at 40 °C and grinded into powder, used to obtain the EDS spectra and XRD patterns. The EDS spectra of the adsorbents were obtained with an Oxford INCA instrument (Oxford Instrument Co., Ltd., UK). The XRD patterns were collected on an X'Pert PRO (PANalytical) diffractometer using Cu Kα radiation (λ = 0.15419 nm) over a 2θ range from 5° to 80°.Adsorption experiments
The batch adsorption experiments were performed by mixing 2 g wet Ca(ALG)2–KB(C6H5)4 adsorbent with 50 mL alkali metal ions solutions at 25 °C in a water bath (SHA-C; Changzhou Guohua Co., Ltd., China) with a shaking speed of 155 rpm. In the single-element systems for the noncompetitive adsorption experiments, the metal ion concentration was 0.01 mol L−1. In the multi-element systems for the competitive adsorption experiments, each of Li, Na, K, Rb, and Cs metal ion concentration was 0.01 mol L−1 (i.e., total metal concentration was 0.05 mol L−1). While in adsorption isotherms experiments, each of alkali metal ion concentration was 0.002 mol L−1, 0.004 mol L−1, 0.008 mol L−1, 0.01 mol L−1, 0.02 mol L−1, 0.04 mol L−1, respectively. The dynamic adsorption behaviors were studied in the ion exchange column, which was packed with 10 g wet Ca(ALG)2–KB(C6H5)4 beads passing by the multi-element solution from top to bottom. The flow rate of feed solution was adjusted by a peristaltic pump at 0.16 mL min−1. During loading run, the column effluent samples were collected periodically and analyzed. The loading run was continued till saturation breakthrough was reached.The concentration of alkali metal ions was determined using an ICS-1100 ionic chromatograph (Dionex Corporation). The adsorption amount of the alkali metal ions onto the composite adsorbent was calculated by the eqn (1),
 | (1) |
Results and discussion
Characterization of the adsorbents
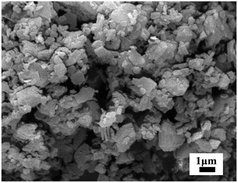
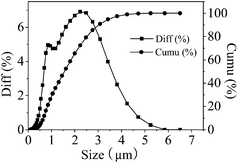
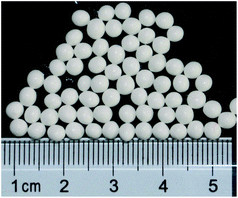
The SEM image was focused on KB(C6H5)4 powder, which the particles' size and surface morphology were uniform as shown in Fig. 1. The median diameter of prepared KB(C6H5)4 powder was 1.7–2.5 μm determined by laser particle size analyzer as shown in Fig. 2.The diameter of the wet Ca(ALG)2–KB(C6H5)4 beads ranged from 2 mm to 4 mm as shown in Fig. 3. KB(C6H5)4 was insufficient for handing column operation and solid–liquid separation because of its fine powder form. So the powder was granulated by alginate gel polymers for the practical separation process. The water content of the wet composite adsorbent was determined to be 85.66%, which was less than that of pure Ca(ALG)2 gel beads prepared in the same way (96.22%), due to the effective entrapment of potassium tetraphenylborate.
Comparison of the adsorption capacities in noncompetitive and competitive systems
The results for the noncompetitive and competitive adsorption of Ca(ALG)2–KB(C6H5)4 were shown in Fig. 4. As shown in Fig. 4, the equilibrium adsorption amount was found to follow the order of Cs+ > Rb+ ≫ Na+ ∼ Li+ under both the noncompetitive and competitive adsorption conditions. And noncompetitive adsorption amount of different alkali metal ions is higher than the competitive adsorption owing to stronger ion strength in competitive system.14,15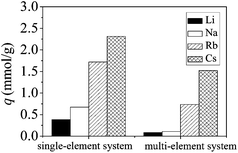 | ||
| Fig. 4 Equilibrium adsorption amount comparison of Ca(ALG)2–KB(C6H5)4 for the noncompetitive and competitive adsorption. | ||
In order to have a total comparison for the adsorption, separation factors were calculated according to the eqn (2) based on adsorption equilibrium data,
 | (2) |
| Conditions | βNa/Li | βRb/Li | βCs/Li |
|---|---|---|---|
| Single-element system | 1.22 | 4.64 | 5.41 |
| Multi-element system | 1.82 | 9.83 | 21.1 |
As shown in Table 1, competitive adsorption of different alkali metal ions present larger separation factor compared to the noncompetitive adsorption. The separation factor was found to follow the order of βCs/Li > βRb/Li > βNa/Li under both conditions. The order of preference for the adsorption is Cs+ > Rb+ ≫ Na+ ∼ Li+. It was demonstrated that the composite adsorbent exhibited favorable selectivity for Cs+ and Rb+ especially in multi-element systems compared to the single-element systems.16,17
Adsorption kinetic curves under competitive conditions
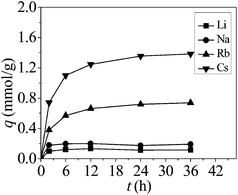
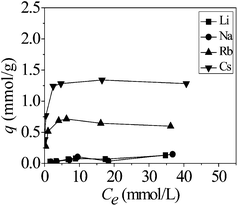
As shown in Fig. 5, the competitive adsorption was also found to reach equilibrium in about 24 h. At the beginning (t < 6 h), the adsorption amount increased rapidly, followed by a slow increase until the equilibrium was reached. The rapid increase was probably owing to the abundant availability of active sites on the adsorbent.18 As time passed, theses sites were gradually occupied by Rb+ or Cs+, so the sorption became slower and quantitatively insignificant.Adsorption isotherms results under competitive conditions
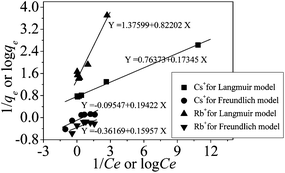
The isotherms for the competitive adsorption at 25 °C were shown in Fig. 6.The correlation of the concentration between alkali metal ions adsorbed on the adsorbent and remained in solution is described by isotherms models. The experimental data about Cs+, Rb+ were fitted with Langmuir isotherm model based on monolayer adsorption19,20 and Freundlich isotherm model based on multilayer adsorption.21,22
The Langmuir isotherm model is expressed as the eqn (3),
 | (3) |
The Freundlich isotherm model is given by the eqn (4),
 | (4) |
![[thin space (1/6-em)]](https://www.rsc.org/images/entities/char_2009.gif) Ce line plot as shown in Fig. 7.
Ce line plot as shown in Fig. 7.
As shown in Table 2, the R2 values of Langmuir isotherm model were very close to unity, but the R2 values of Freundlich isotherm model deviated from unity seriously, proving the nice fitting of Langmuir isotherm model to these adsorption experimental data. The maximum sorption capacities qm corresponding to complete monolayer coverage were 1.32 mmol g−1 and 0.73 mmol g−1 for Cs+, Rb+ on Ca(ALG)2–KB(C6H5)4 beads, respectively.
| Ion | Langmuir model | Freundlich model | ||||
|---|---|---|---|---|---|---|
| qm (mmol g−1) | b (L mmol−1) | R2 | k (mmol g−1) | n | R2 | |
| Cs+ | 1.32 | 4.46 | 0.997 | 0.80 | 5.26 | 0.791 |
| Rb+ | 0.73 | 1.67 | 0.981 | 0.43 | 6.25 | 0.559 |
Dynamic adsorption behaviors under competitive conditions
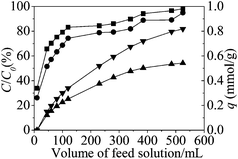
Fig. 8 represents the results of column experiments in the form of breakthrough curves for Li, Na, Rb and Cs ions. The breakthrough ratio of ions is C/C0, where C is alkali metal ion concentration of the effluent solution and C0 is concentration of the feed solution.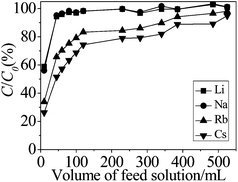 | ||
| Fig. 8 Breakthrough curves for the competitive adsorption. The inner diameter was 1.2 cm and the height was 24 cm of the column. | ||
In the case of 0.01 mol L−1 Li+, Na+, K+, Rb+, Cs+ (total metal concentration was 0.05 mol L−1) bearing feed, the breakthrough of alkali metal ions occurred at 10 mL volume. Thereafter, increasing amounts of ions were found in the effluent and the column reached saturation after passing 45 mL feed solution for Li+, Na+ and 530 mL for Rb+, Cs+. Li and Na ions were hardly adsorbed in the column experiments. The order of C/C0 was Li+ ∼ Na+ < Rb+ < Cs+, so the lower breakthrough ratio was obtained for Cs+ adsorption.
Fig. 9 represents the relation between the adsorption amount and breakthrough ratio of Rb+, Cs+ for column experiments. The adsorption amount of column experiments was calculated by the eqn (5). The adsorption amount curves were obtained by means of integral from breakthrough data.
 | (5) |
When the feed solution passed 530 mL, the breakthrough ratios were 98% for Rb+ and 94% for Cs+, the adsorption amounts were 0.54 mmol g−1 for Rb+ and 0.82 mmol g−1 for Cs+, respectively. So the higher adsorption amount was obtained for Cs+ adsorption.
Adsorption mechanisms
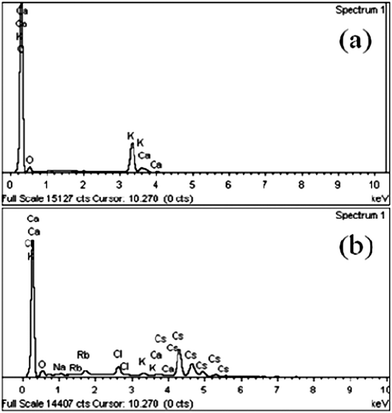
Fig. 10 showed the Energy Dispersive Spectroscopy (EDS) of the dried composite adsorbent before and after adsorption. The main metal elements were potassium and calcium before adsorption, while the composition changed to potassium, calcium rubidium and cesium after adsorption, indicating the successful adsorption. After adsorption, the peaks of strong Rb+ and stronger Cs+ appeared, while a small amount of K+ still existed, demonstrating that tetraphenylborate anion (B(C6H5)4−) had higher affinity to Cs+ and KB(C6H5)4 was uncompletely converted into CsB(C6H5)4 and RbB(C6H5)4.23The XRD patterns of KB(C6H5)4, RbB(C6H5)4, CsB(C6H5)4 from the ref. 24–26 and the adsorbent before and after adsorption were compared as shown in Fig. 11. Fig. 11(b) showed that diffraction peaks of the adsorbent had changed between 10° and 20° besides 20° and 30° before and after adsorption. According to Fig. 11(a), the adsorbent before adsorption was the KB(C6H5)4, and became to almost CsB(C6H5)4 after adsorption.
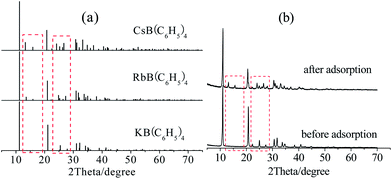 | ||
| Fig. 11 The XRD patterns of standards (a) of KB(C6H5)4, RbB(C6H5)4, CsB(C6H5)4 and the adsorbent before and after adsorption (b). | ||
It was caused by the ion exchange reaction between Cs+, Rb+ and K+ in the adsorption processes.27,28 The corresponding reaction could be expressed as the eqn (6) and (7).
| Ca(ALG)2–K+B(C6H5)4− + Cs+ = Ca(ALG)2–Cs+B(C6H5)4− + K+ | (6) |
| Ca(ALG)2–K+B(C6H5)4− + Rb+ = Ca(ALG)2–Rb+B(C6H5)4− + K+ | (7) |
For the above content, The order of preference of alkali metal ions for B(C6H5)4− is Cs+ > Rb+ > K+, which is interpreted by the order of solubility product constants for tetraphenylborate salts, Ksp (CsB(C6H5)4) (1.58 × 10⁻⁹) < Ksp (RbB(C6H5)4) (2.89 × 10⁻⁹) < Ksp (KB(C6H5)4) (3.06 × 10⁻⁸) in detail.29,30
Conclusions
The composite adsorbent, Ca(ALG)2–KB(C6H5)4 was prepared and characterized. Competitive and noncompetitive adsorption of Li, Na, K, Rb, Cs ions onto the Ca(ALG)2–KB(C6H5)4 beads was investigated in batch experiments. The main results of our study could be summarized as follows:(1) The prepared composite adsorbent was white beads. The size and surface morphology were uniform of the KB(C6H5)4 powder and Ca(ALG)2–KB(C6H5)4 beads.
(2) Compared to the noncompetitive adsorption, competitive adsorption of different alkali metal ions presented differences in adsorption capacities. The equilibrium adsorption amount was found to follow the order of Cs+ > Rb+ ≫ Na+ ∼ Li+, and Li and Na ions hardly were adsorbed. The separation factor was found to follow the order of βCs/Li > βRb/Li > βNa/Li under both the noncompetitive and competitive adsorption conditions.
(3) In the kinetic experiments for competitive adsorption, the adsorption reached equilibrium in about 24 h.
(4) The adsorption was fitted Langmuir isotherm model preferably for Cs+ and Rb+ in the competitive system.
(5) In the column experiments, the lower breakthrough ratio and higher adsorption amount were obtained for Cs+.
(6) Ion exchange reaction was the mechanism for Rb+ and Cs+ onto Ca(ALG)2–KB(C6H5)4 beads. Compared to Rb+ and K+, B(C6H5)4− had higher affinity to Cs+ due to differences of the solubility product, that is Ksp (CsBph4) < Ksp (RbBph4) < Ksp (KBph4).
Acknowledgements
This work was financially supported by the Foundation of Knowledge Innovation Program of Chinese Academy of Sciences (KZCX2-EW-QN309), the Western Action Program, Chinese Academy of Sciences (KZCX2-XB3-06), National Natural Science Foundation of China (51002164), the Foundation of Basic Research for Application of Qinghai Province (2013-Z-706) and “Western Light” Talents Training Program of Chinese Academy of Sciences (2011(2)).References
- H. E. Sartori, Pharmacol., Biochem. Behav., 1984, 21, 11 CrossRef.
- J. Zhong, W. Yao and W. Lee, Int. J. Dev. Neurosci., 2007, 25, 359 CrossRef CAS PubMed.
- V. S. Khazanov and S. G. Iurov, Sov Phys Tech Phys, 1956, 1, 1141 Search PubMed.
- E. I. Burmakin, G. Sh. Shekhtmang and E. I. Volegova, RU2415496 C1, 2011.
- K. K. Toshiba, JP2001284662-A, 2002.
- Y. Kano, M. Ohshima, H. Kurokawa and H. Miura, React. Kinet., Mech. Catal., 2013, 109, 29 CrossRef CAS PubMed.
- Th. Udem, R. Holzwarth and Th. Hänsch, Eur. Phys. J.: Spec. Top., 2009, 172, 69 CrossRef.
- E. M. Korobova and S. L. Romanov, Chemom. Intell. Lab. Syst., 2009, 99, 1 CrossRef CAS PubMed.
- M. I. Balonov, L. R. Anspaugh, A. Bouville and I. A. Likhtarev, Radiat. Prot. Dosim., 2007, 127, 491 CrossRef CAS PubMed.
- P. Thakur, S. Ballard and R. Nelson, Sci. Total Environ., 2013, 458–460, 577 CrossRef CAS PubMed.
- J. A. Caffrey, K. A. Higley, A. T. Farsoni, S. Smith and S. Menn, J. Environ. Radioact., 2012, 111, 120 CrossRef CAS PubMed.
- X. F. Fan, W. T. Zheng, J. L. Kuo and D. J. Singh, ACS Appl. Mater. Interfaces, 2013, 5, 7793 CAS.
- C. K. Kim, J. Y. Kong, B. S. Chun and J. W. Park, Environ. Earth Sci., 2013, 68, 2393 CrossRef CAS PubMed.
- S. C. Tsai, T. H. Wang, M. H. Li, Y. Y. Wei and S. P. Teng, J. Hazard. Mater., 2009, 161, 854 CrossRef CAS PubMed.
- C. X. Liu, J. M. Zachara, S. C. Smith, J. P. Mckinley and C. C. Ainsworth, Geochim. Cosmochim. Acta, 2003, 67, 2893 CrossRef CAS.
- L. J. Li, F. Q. Liu, X. S. Jing, P. P. Ling and A. M. Li, Water Res., 2011, 45, 1177 CrossRef CAS PubMed.
- P. Srivastava, B. Singh and M. Angove, J. Colloid Interface Sci., 2005, 290, 28 CrossRef CAS PubMed.
- R. R. Sheha and E. Metwally, J. Hazard. Mater., 2007, 143, 354 CrossRef CAS PubMed.
- M. M. Abd El-Latif and M. F. Elkady, Desalination, 2010, 255, 21 CrossRef CAS PubMed.
- M. Y. Miah, K. Volchek, W. Kuang and F. H. Tezel, J. Hazard. Mater., 2010, 183, 712 CrossRef CAS PubMed.
- C. Dwivedi, A. Kumar, K. K. Singh, A. K. Juby, M. Kumar, P. K. Wattal and P. N. Bajaj, J. Appl. Polym. Sci., 2013, 129, 152–160 CrossRef CAS.
- D. H. Ding, Y. X. Zhao, S. J. Yang, W. S. Shi, Z. Y. Zhang, Z. F. Lei and Y. N. Yang, Water Res., 2013, 47, 2563 CrossRef CAS PubMed.
- R. Q. Li, R. E. K. Winter, J. Kramer and G. W. Gokel, Supramol. Chem., 2010, 22, 73 CrossRef CAS.
- A. L. Rheingold and J. A. Golen, Calculated from CSD using POWD-12++, private communication, 2005.
- B. Wilde and F. Olbrich, Calculated from CSD using POWD-12++, private communication, 2005.
- J. C. Bryan, Calculated from CSD using POWD-12++, Z. Kristallogr. - New Cryst. Struct., 2000, 215, 621 CAS.
- C. Y. Chang, L. K. Chau, W. P. Hu, C. Y. Wang and J. H. Liao, Microporous Mesoporous Mater., 2008, 109, 505 CrossRef CAS PubMed.
- C. L. Neskovic, S. Ayrault, V. Badillo, B. Jimenez, E. Garnier, M. Fedoroff, D. J. Jones and B. Merinov, J. Solid State Chem., 2004, 177, 1817 CrossRef PubMed.
- A. Berne, B. Wajsbrot, P. D. Klahr and O. Popovych, J. Chem. Eng. Data, 1983, 28, 316 CrossRef CAS.
- X. L. Wang, L. Z. Zou, P. J. Zhang, F. G. Wang, Q. J. Yu and B. X. Zhou, J. Chem. Thermodyn., 1999, 31, 1609 CrossRef.
| This journal is © The Royal Society of Chemistry 2014 |

