Ultimate H2 and CH4 adsorption in slit-like carbon nanopores at 298 K: a molecular dynamics study

Eric Poirier *
MEDA Engineering & Technical Services LLC, 17515 W. Nine Mile Road, Suite 1075, Southfield, MI 48075, USA

Received 24th March 2014 , Accepted 7th May 2014

First published on 15th May 2014


Abstract

Hydrogen and methane adsorption is studied on a range of nanoscale carbon slit pores up to 1000 bar at 298 K using molecular dynamics. Past about 200 bar, the calculated adsorbed hydrogen density increases as a function of pressure at the same rate as the highly compressed bulk liquid and thus no saturation plateau is predicted under these conditions. This behaviour implies a continuous increase of the adsorbed hydrogen density past the normal boiling point value and explains high pressure experimental hydrogen adsorption data at 298 K on porous carbons, such as AX-21 activated carbon. This result is put into perspective by comparing with the adsorbed hydrogen phase measured at 50 K on AX-21, which exhibits an ideal incompressible liquid behaviour and a maximum density of only 0.06 g mL−1. These findings therefore suggest the existence of two distinct temperature dependent saturation regimes, most likely of quantum origin. The volumetric capacities show that the adsorbents provide no gains over compression past 600 bar at about 0.04 g mL−1. Conversely, gravimetric capacities inferior to 0.03 g g−1 found below 200 bar indicate large mass penalties when significant gains over compression are achieved. The calculated adsorbed methane density reaches at about 50 bar a true saturation plateau comparable to the pressurized bulk liquid at lower temperatures. Large volumetric and gravimetric capacities of about 365 v v−1 and 0.21 g g−1, respectively, are found in these conditions. These results therefore indicate an interesting 10 fold improvement over compression and a small mass penalty for methane adsorbed on well compacted engineered materials.

1. Introduction

Hydrogen Fuel Cell Vehicles (HFCVs) provide the benefits of electric propulsion, with no on-vehicle harmful emissions. In addition, they have driving ranges and refuelling times comparable to gasoline vehicles. Hence, there is a continuous interest in developing these vehicles and their concurrent refilling infrastructure. The efficiency and competiveness of HFCVs could be improved by low pressure and high energy density fuel storage systems. Materials-based storage systems may be the best hydrogen storage approach in the long term. Nanoporous carbon adsorbents are being investigated as gas storage materials because of their high surface areas and pore volumes, as well as their low mass favouring adsorption capacity.1–4 Typical carbon adsorbents consist of pores that can be represented by a slit model,5–7 and have a good affinity for guest species.8,9 Jorda-Beneyto et al. reported results on a range of materials, including activated carbons (AC) and nanofibers, indicating that up to 6.8 wt% of hydrogen could be stored at room temperature and 500 bar.10 In a theoretical study, hydrogen uptakes reaching 1.4 wt%, at 303 K and about 100 bar, and visibly still linearly increasing beyond that point, were reported.7 Nishihara et al. measured up to about 2.2 wt% at 340 bar and room temperature in zeolite-templated carbons (ZTC) with pores of small dimensions (12 Å).11 As noted elsewhere, this relatively high value cannot be explained on the basis of a large surface area alone.1 Although ZTCs may not be represented exactly by slit pores, the latter constitute a good approximation of their structure.12 As pointed out in these reports, as pore size distribution and pore volume play a key role in adsorption properties, optimization at the nanoscale is required to get efficient adsorbents. Importantly, no saturation plateau or excess adsorption maximum at room temperature can be seen at the highest pressures in many reports.1,10,11,13 This feature requires clarifications to better understand adsorptive storage limits of carbon slit pores at very high pressures.

The essential goal in the design of an on-board gas storage material is to obtain a high volumetric capacity (g mL−1) while keeping minimal the mass penalty from the solid, i.e. via a high gravimetric capacity (g g−1). The volumetric capacity should improve over compression over a practical pressure and temperature (P, T) range. This is increasingly challenging as the gas density increases and simple compression becomes better in comparison. It is sometimes suggested that a low crystal density may be detrimental to the adsorbent's volumetric capacity. In fact, the material's crystal density has to be minimized under the condition that pore size stays within a range allowing for an extended and high density adsorbed phase, where the importance of understanding the physical limits of the latter. In that respect, the adsorbed hydrogen phase density and volume were measured in the decreasing regions of excess isotherms down to 50 K range on several microporous adsorbents.14,15 These measurements revealed saturation conditions for supercritical adsorption.16–18 However, the ultimate densification of supercritical gases adsorbed in nanopores at room temperature and very high pressures still raises questions due, as mentioned above, to the apparent absence of saturation plateaus or excess adsorption maximum. Moreover, the possibility of a adsorbed hydrogen density reaching, at room temperature, values higher than the bulk liquid at the boiling point is interesting.19 Adsorption of hydrogen on grapheme sheets represents is somewhat an ambiguous topic with some reports of hydrogen uptakes possibly reaching beyond anticipated limits. For instance, results varying over a certain range, depending on structural factors, and reaching up to 18.53 wt% of hydrogen were reported.20 It was also reported that the maximum adsorption limit on activated carbon is 23.764 wt% and independent of temperature.21 Variations in pore size could lead to differences in gas uptakes, yet pore size effects at very high pressure are unclear.2,22 In a context where the realization and interpretation of very high pressure adsorption measurements is challenging, this work aims at providing theoretical insights on the limits of high pressure gas adsorption in many advanced carbon nanomaterials. The results are compared with relevant experimental data on AX-21, as well as compression over the same (P, T). Because of its technological importance as the main constituent of natural gas, which is of significant interest for transportation,23–27 methane is also studied as an adsorbate using a similar approach. In this case, of particular interest is the theoretical maximum volumetric capacity as rapid progress are made in that respect, with measured uptakes of the order of 236–241 v v−1 recently reported.28,29 Results for both adsorbates are compared to better understand the impact of particular solid–gas energetics.

2. Calculations details

The classical molecular dynamics calculations were performed using the Forcite module in the Material Studio software.30 The classical approach is valid at room temperature as quantum effects are relatively small.31,32 The slit pore structures used for the calculations consist of six (6) superposed grapheme planes built within a simulation cell. The cells have dimensions (in Å) of a = 22.03, b = 25.38, and c = 6·δz as c is gradually increased with interplanar spacing up to 168 Å. The interplanar spacing or pore size (δz) is varied from 5 to 20 Å generating structures ranging in crystal densities, pore volumes and sizes, as well as energetics. This stack structure provides for averaged adsorption isotherms from the 6 individual pores. The unbalanced bonds on the edges of the carbon planes were chemically quenched with hydrogen atoms (these atoms were not subsequently accounted as part of the adsorbed phase). The Connolly surface method33,34 was used to establish the effective boundary between solid and free space volumes, hence allowing for pore volume, solid and crystal density determination based on repulsive forces (Section 3). A Connolly surface is defined at the boundary between a rolling probe molecule and the atoms of studied structure. An example of the slit pore stack structure and its corresponding Connolly isosurface constructed in Material Studio are shown in Fig. 1.
image file: c4ra02553a-f1.tif
Fig. 1 The slit pore carbon structure, shown here for δz = 7 Å: carbon atoms (in grey), chemically bonded hydrogen (in white) and the Connolly isosurface (in blue).

The universal force field (UFF)35 and the NVT Canonical Ensemble were used. The UFF treats van der Waals interactions using a “12-6” Lennard-Jones potential of the form:

 
image file: c4ra02553a-t1.tif(1)
where D0 is the depth of the potential, R0 the distance at which the potential energy is minimum, and R the distance between particles.36 Eqn (1) is parameterized for each interacting species. The calculations were performed using a 15 Å cut-off distance and an atom-based summation method. The temperature was maintained at 298 K using a Nose thermostat. The crystal structures were assumed rigid and thus constrained in their position. Preliminary calculations with the Compass and Dreiding force fields yielded unrealistic adsorbed hydrogen phase densities in the present conditions. Therefore the UFF was retained, in agreement with other reports.37 The pore width modulates the overlap of V(R) from opposite walls, and thereby the adsorption energetics. The adsorption potentials ΔEb (in kJ mol−1) for H2 and CH4 were first calculated after 32 and 24 molecules, respectively, were equilibrated in a slit for a time t = 110 ps as:
 
ΔEb = Egas+solidEgasEsolid (2)

In this case, a single slit was isolated using a vacuum space of at least 15 Å to avoid long distance interactions and capture the net effect of δz. Similarly, as eqn (2) indicates, ΔEb is corrected for adsorbate–adsorbate interactions in the pore. The adsorbed amounts were calculated by allowing different amounts of adsorbate gas to expand in the structures over 360–460 ps. The equilibrium gas density was derived from the average amount of molecules in the volume outside the pores over the last 20 (10 ps) frames. The adsorbed phase density ρa was established from the balance of molecules, present in the pore volume vp delimited by the cell parameters and the Connolly surface. The absolute gravimetric amount adsorbed na is:

 
na = ρavp (3)

The corresponding pressures were approximated from gas densities outside the pores and the temperature using the NIST fluid properties database, which accounts for compressibility.38 This approach constitutes a first approximation limited by the use of different approaches for the adsorbed phase density and pressure calculations. The volumetric amount adsorbed was calculated as nadc, where dc is the crystal density derived from the solid mass contained in the structure, e.g. Fig. 1. The present approach involves the absolute amount adsorbed na (eqn (3)), which corresponds to the molecules present in the region of vp where interaction with the surface is significant. As vp (and δz) increases and some adsorbate get farther away from the surface, a total amount accounting for a mix of adsorbed and gas-like phases may be considered. For δz ∼ 15 Å, i.e. the potential's cut-off value, the two amounts virtually coincide. As a result, the conjunction of absolute adsorbed amounts in micropores and ideal crystal densities provides for total adsorption capacity projections on perfectly compacted engineered materials.

3. Results

3.1 Surface area, pore volume and material density

The Connolly isosurface, and the mass and dimension of the simulation cells were used to determine specific surface area, pore volumes and densities. The Connolly isosurface (Fig. 1) corresponds to a specific surface area of about 2390 m2 g−1. It lies at about 1.5 Å above the centre of the carbon planes, thus defining an impenetrable solid volume (vs). The skeletal density based on the mass within vs is 2.4 g mL−1. The specific pore volume is the difference between the volume of the crystal (vc) as determined by the cell parameters and that of the solid, reported on a mass basis, i.e. as vp = (vcvs)/ms, where ms is the solid mass in the cell. The quantity vp (mL g−1) increases with δz (Å) as vp ≅ 0.114δz − 0.356; it does not pass through zero due to the repulsive region near the carbon atoms. The crystal density dc is calculated as dc = ms/vc and is independent of the specific surface area and skeletal density.

3.2 Potential energy

Energy calculations results (eqn (2)) are presented in Fig. 2 for δz = 5 to 20 Å. The δz = 6 Å system is found to be the most energetically favourable for hydrogen, with ΔEb = −11.7 kJ mol−1. This result is consistent with other reports.39,40 For δz < 6 Å, the energy increases rapidly to reach a non-bonding state (ΔEb = +4.5 kJ mol−1) at δz = 5 Å. Conversely, for larger δz, ΔEb tends to a value similar to that of a single grapheme plane (∼−4 kJ mol−1), as expected. For methane, the lowest energy is ΔEb = −33 kJ mol−1 for δz = 7 Å, a result comparable with another report.41
image file: c4ra02553a-f2.tif
Fig. 2 Potential energy of the guest molecules in different pore sizes.

3.3 High pressure adsorbed phase density

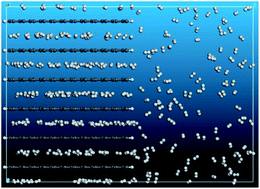
3.3.1 Adsorbed hydrogen phase. The adsorbed hydrogen density is plotted for different δz values in Fig. 3.§ For the 6 Å pores, it rises rapidly over 0–200 bar, and subsequently increases at a slower rate to reach about 0.095 g mL−1 at 1000 bar. This elevated density exceeds that of liquid hydrogen at the normal boiling point (0.071 g mL−1) and may suggest a priori a performing adsorbent. This result is put in perspective by comparing with bulk liquid densities over the same pressure range but at T = 30 K (Fig. 3).38 Visibly, past about 200 bar the adsorbed phase behaves increasingly like the highly compressed bulk liquid, differing approximately from the latter by a constant. That is, the slow increase in adsorbed phase density past about 200 bar can most simply be explained by the sole compaction of hydrogen under applied pressure, with no concurrent influence from the adsorbent. The adsorbed phase density increases at an average rate of (0.029 ± 0.005) × 10−3 g mL−1 bar−1 over the 425–900 bar range in the 6 Å pore and (0.027 ± 0.005) × 10−3 g mL−1 bar−1 over the 325–850 bar range in the 7 Å pore. Comparable trends are visible for the other δz values (Fig. 3). These values are similar to the 0.030 × 10⁻³ g mL−1 bar−1 average rate for the bulk (30 K) liquid over the same pressures. Changes in δz tend to offset the adsorbed phase density to various extents. For the 6 Å pore, the density reaches ultimately about 95% of the liquid hydrogen state values. However, it remains well below bulk liquid density values at moderate pressures e.g. at 30 bar, it is about 1/3 of the liquid density at the normal boiling point. Densification for δz = 12 Å is further limited with an adsorbed phase density ranging from about 1/4 to 2/3 of those found for δz = 6 Å over the current pressures. The criticality of pore size is apparent from minute changes in δz: increasing δz from 6 to 7 Å reduces the adsorbed phase density by nearly 25% at 30 bar. A reduction of δz to 5 Å leads to virtually no adsorption, in accordance with another report.20
image file: c4ra02553a-f3.tif
Fig. 3 Calculated adsorbed H2 phase densities at 298 K. The 30 K bulk liquid density (dash curve), shown for comparison, is from ref. 38.

These results suggest that the saturated adsorbed hydrogen phase behaves, at 298 K, differently than at T = 50–60 K where it is effectively found incompressible and less dense in a range of microporous materials.16,17 Fig. 4 shows the adsorbed phase density measured on the AX-21 AC, a typical slit pore adsorbent,7,42 plotted as a function of pressure at 50 K. The adsorbed phase density is here estimated as ρa = nex/va + ρg using the adsorbed phase volume va derived past the maximum of the measured excess adsorption isotherm, as va = −dnex/dρg.16,17 Hence, the linear decrease (inset) indicates an ideal incompressible volume of 1.58 mL g−1. The system reaches a true saturation plateau at 0.06 g mL−1 near 30 bar, reflecting this incompressible behaviour. This contrasts with the current 298 K projections indicating densification well beyond the normal boiling point density. These two regimes would most likely be of quantum origin.17 That is, as the de Broglie wavelength increases as the temperature diminishes, the effective molecular diameter increases compared to the classical picture and thus reduces adsorption.43,44 This effect may be more significant under nanoscale confinement than in the bulk as large potential gradients within nanoscale objects may restrict molecular motion in some directions.44 These considerations may thus explain the lower adsorbed hydrogen density at 50 K compared to the classical treatment of the solid–fluid interactions at 298 K.


image file: c4ra02553a-f4.tif
Fig. 4 Adsorbed H2 phase density as a function of pressure on AX-21 at 50 K. The adsorbed phase volume νa is derived from the measured decreasing region of nex vs. ρg, which is linear (inset).
3.3.2 Adsorbed methane phase. The adsorbed methane density is plotted for different δz values in Fig. 5. For all pores, it reaches at 298 K values similar to that of the bulk liquid phases found in the 100–200 K range. In particular, for δz = 7 Å it reaches at 50 bar a value close to the 100 K bulk liquid phase. Hence, in contrast with hydrogen, the room temperature adsorbed phase densities and the low temperature bulk liquid densities coincide. The apparent adsorbed phase density is lowest for δz = 20 Å as a significant fraction of methane is being solely compressed in the pore. It was verified that the adsorbed methane density does not vary much with temperature: for δz = 7 Å it reaches a maximum value at 250 K of 0.460 g mL−1, only 2% higher than at 298 K. This could be explained by strong attractive potentials hindering volumetric thermal expansion of adsorbed methane molecules. For δz < 7 Å, adsorption diminishes, and then vanishes for δz = 6 Å (not shown), indicating a range of small δz values detrimental to methane adsorption.
image file: c4ra02553a-f5.tif
Fig. 5 Calculated adsorbed CH4 density at 298 K. The bulk liquid densities, shown for comparison, are from ref. 38.

3.4 Storage capacities

3.4.1 Hydrogen storage capacity. The absolute gravimetric hydrogen adsorption isotherms for different δz values are presented in Fig. 6. Nanoscale differences in slit size visibly lead to an increasing spread of the isotherms with pressure, with capacities ranging from about 0.02 to 0.06 g g−1 at 600 bar. For δz = 12 Å a gravimetric capacity of 0.05 g g−1 (4.7 wt%) is found at 450 bar. However, this relatively high uptake results from reporting on a mass basis a larger amount of adsorbate whose density is not much influenced by the surface, as will be illustrated later. The corresponding volumetric capacities are presented in Fig. 7 where bulk compression data are also shown for comparison.38 The δz = 6–7 Å slits have the highest volumetric capacities and offer a five-fold gain over compression at 30 bar. Nevertheless, the gravimetric uptake remains below 1 wt%, revealing a large mass penalty at this pressure. The 12 Å slits show a reduced volumetric uptake due to a smaller adsorbed phase density. Gains over compression virtually vanish near 600 bar where all structures lose their raison d'être at about the same volumetric capacity (0.04 g mL−1). The improved effectiveness of the 6 Å pores over the 12 Å pores can be seen in Fig. 8 and 9, respectively, showing 300 bar simulation snapshots. The 6 Å slits are densely packed with hydrogen, while the 12 Å slits are populated at their centres at densities close to the gas phase, i.e. under little influence from the surface. This shows an inefficient use of pore volume in the 12 Å slits compared to the 6 Å slits. This effectiveness of δz = 6–7 Å slits is consistent with literature.6 The 5.5 Å slits adsorb much less than the larger δz's on both a gravimetric and volumetric basis, despite an adsorbed phase density comparable to that found on other slit sizes. This is apparently a result of the smaller specific pore volume of the 5.5 Å structure. No adsorption is found for δz = 5 Å at 950 bar (Fig. 10), as expected from the repulsive energy in these pores.
image file: c4ra02553a-f6.tif
Fig. 6 Absolute gravimetric H2 isotherms at 298 K. The AX-21 experimental data (diamonds) are from ref. 46.

image file: c4ra02553a-f7.tif
Fig. 7 Absolute volumetric H2 isotherms calculated at 298 K. The compressed H2 density (dash curve) is shown for comparison.

image file: c4ra02553a-f8.tif
Fig. 8 Snapshot of the δz = 6 Å hydrogen populated system at 298 K and ∼300 bar (330 H2 molecules).

image file: c4ra02553a-f9.tif
Fig. 9 Snapshot of the δz = 12 Å hydrogen populated system at 298 K and 300 bar (600 H2 molecules). The central region of the slit apparently adsorbs under relatively low density reducing the slit's effectiveness.

image file: c4ra02553a-f10.tif
Fig. 10 Snapshot of the δz = 5 Å system at 298 K and about 940 bar (240 H2 molecules). Virtually no hydrogen enter the pores.

The AX-21 has a pore distribution centred near 12 Å and a microporous volume of about 1.1 mL g−1.45 It is thus compared to the 12 Å structure (vp = 1.08 mL g−1) as a first approximation. Measured isotherms on AX-21 from Voskylen and Pourpoint46 converted on an absolute basis, are plotted in Fig. 6. The experimental and calculated values agree well despite the coarse analogy. The calculations also compare well at 100 bar with measurements by Burress et al. who found ∼0.015 g g−1 (absolute) in these conditions.8 Hence, according to the present picture, it can be assumed that the adsorbed hydrogen phase on AX-21 will increase at high pressure following the same trend as the bulk pressurized liquid. Consequently, no true adsorption saturation plateau is predicted for this and similar adsorbents at 298 K up to 1000 bar, and visibly to some extent beyond that pressure. Hydrogen uptakes of 0.03 g g−1 (or 2.9 wt%) at 450 bar in 6 Å pore, as reported elsewhere, are not inconsistent with the present results.11 However, any gravimetric uptake at these high pressures may not indicate practicality as the volumetric uptake comes across as the actual limiting property. Even on the present ideally compacted systems, a marginal (∼15%) improvement over compression is found at 450 bar (Fig. 7). Gains on real materials can naturally be expected to reach comparatively smaller values.

3.4.2 Methane storage capacity. The absolute gravimetric methane adsorption isotherms for different δz values are shown in Fig. 11. The smallest pores on this graph offer interesting gravimetric uptakes reaching about 0.20 g g−1 (∼17 wt%) at only 30 bar. This value compares well with reported data on AX-21.45 Higher capacities, in excess of 0.50 g g−1, are obtained at higher pressures for the larger pores (δz = 14–20 Å), indicating reduced mass penalties with increasing pressure. The volumetric capacity, which is typically more relevant in this case, ranges between 0.20–0.22 g mL−1 for δz = 7–9 Å at 30 bar (Fig. 12). Ten-fold improvements over compression are obtained at this pressure. A 0.22 g mL−1 capacity corresponds to about 365 v v−1 (using 24[thin space (1/6-em)]400 mL mol−1 at 298 K and 1 atm), a value about twice the DOE target of 180 v v−1.47 For δz = 14 Å, interesting volumetric and gravimetric capacities of 0.27 g mL−1 and 0.49 g g−1, respectively, are found at 80 bar. Despite this higher pressure, the 14 Å slits still offer a 5 fold gain over compression, but with a reduced mass penalty compared to 30 bar. At pressures above 400 bar, no system offers significant advantages over compression. Snapshots of the methane molecules in the 7 and 14 Å slits (Fig. 13 and 14) show it is densely adsorbed in both systems below 80 bar. This illustrates a more favourable adsorption energetics compared to hydrogen. The current temperature corresponds to ∼1.5 Tc for methane (Tc = 190.56 K) and ∼10 Tc for hydrogen (Tc = 33.15 K). The stronger gas–solid interactions may favour a condensation-like mechanism for methane adsorption at a temperature close to the critical temperature Tc. This mechanism is not unlike hydrogen adsorption at 50 K.
image file: c4ra02553a-f11.tif
Fig. 11 Absolute gravimetric CH4 isotherms calculated at 298 K.

image file: c4ra02553a-f12.tif
Fig. 12 Absolute volumetric CH4 isotherms calculated at 298 K. The compressed CH4 density (dash curve) is shown for comparison.

image file: c4ra02553a-f13.tif
Fig. 13 Illustration of the δz = 7 Å methane-containing system at T = 298 K and P ∼ 78 bar (360 CH4 molecules).

image file: c4ra02553a-f14.tif
Fig. 14 Illustration of the δz = 14 Å methane-containing system at T = 298 K and P ∼ 68 bar (660 CH4 molecules).

4. Conclusions

The present analysis predicts two temperature dependent saturation regimes for hydrogen adsorbed in carbon slit pores. At 298 K, adsorbed phase densities continuously increasing at an average rate converging with that of highly compressed bulk liquid hydrogen are found. No saturation plateau is therefore predicted for this type of system in the present (P, T) conditions. The adsorbed hydrogen density may reach values as high as 0.095 g mL−1 at 1000 bar for 6 Å pores. In contrast, at cryogenics temperatures (50 K) the adsorbed hydrogen phase behaves rapidly like an ideal incompressible liquid reaching a plateau at a lower density, e.g. 0.060 g mL−1 for AX-21. These two regimes may originate from quantum effects, which are exacerbated under nanoscale confinement at low temperatures and repulsive in essence. This change in compressibility may be a key for modeling supercritical adsorption isotherms over a wide temperature range. The absence of hydrogen saturation plateau implies that large adsorbed densities are possible, yet improvements over compression may be small at high pressure, and vanish around 600 bar. It should be emphasized that past this pressure the gravimetric capacity becomes an immaterial indicator of performance. Small gravimetric uptakes under conditions where a gain over compression is achieved shed doubt on the practicality of these systems. The properties of the adsorbed hydrogen phase at saturation appear independent of particular chemistry or functionality.6,14,16,17 Increasing hydrogen packing densities beyond the current liquid state limits may thus be challenging. However, as small gains over compression are found at low pressures (e.g. relatively to methane) optimization opportunities may exist for such conditions. Enhancing the adsorption potential via carbon substitution, surface modifications or novel structures are among possible pathways for low pressure adsorption improvement.3,48

The room temperature saturation behaviour of methane is found – not unlike hydrogen – to converge with that of its pressurized liquid counterpart. In this case a maximum adsorbed phase density of about 0.460 g mL−1 is calculated. However, in contrast with hydrogen, methane adsorption reaches true saturation plateaus. Moreover, elevated volumetric (365 v v−1) and gravimetric (0.20 g g−1) capacities are found at only 30 bar for 7 Å pores. These results indicate the practical potential of nanocarbons engineered with no large voids as candidates to exceed the current volumetric storage targets. Increasing further methane densification via surface modifications49 may however be challenging due to saturation plateaus associated with incompressible methane phases found at relatively low pressures.

Acknowledgements

The author would like to thank Dr Yue Qi at General Motors Research and Development and Dr George Fitzgerald at Accelrys Inc. for technical support and helpful discussions.

References

  1. N. P. Stadie, J. J. Vajo, R. W. Cumberland, A. A. Wilson, C. C. Ahn and B. Fultz, Langmuir, 2012, 28(26), 10057 CrossRef CAS PubMed.
  2. E. Masika and R. Mokaya, J. Phys. Chem. C, 2012, 116(49), 25734 CAS.
  3. B. Kuchta, L. Firlej, A. Mohammadhosseini, P. Boulet, M. Beckner, J. Romanos and P. Pfeiffer, J. Am. Chem. Soc., 2012, 134(36), 15130 CrossRef CAS PubMed.
  4. N. P. Stadie, M. Murialdo, C. C. Ahn and B. Fultz, J. Am. Chem. Soc., 2013, 135(3), 990 CrossRef CAS PubMed.
  5. D. P. Broom, Hydrogen Storage Materials: The Characterization of Their Storage Properties, Springer, London, 2011, pp. 19–59 Search PubMed.
  6. Y. Gogotsi, C. Portet, S. Osswald, J. M. Simmons, T. Yildirim, G. Laudisio and J. E. Fischer, Int. J. Hydrogen Energy, 2009, 34(15), 6314 CrossRef CAS PubMed.
  7. P. Kowalczyk, H. Tanaka, R. Hołyst, K. Kaneko, T. Ohmori and J. Miyamoto, J. Phys. Chem. B, 2005, 109(36), 17174 CrossRef CAS PubMed.
  8. J. Burress, M. Kraus, M. Beckner, R. Cepel, G. Suppes, C. Wexler and P. Pfeifffer, Nanotechnology, 2009, 20, 204026 CrossRef PubMed.
  9. J. J. Purewal, H. Kabbour, J. J. Vajo, C. C. Ahn and B. Fultz, Nanotechnology, 2009, 20, 204012 CrossRef CAS PubMed.
  10. M. Jorda-Beneyto, F. Suarez-Garcia, D. Lozano-Castello, D. Cazorla-Amoros and A. Linares-Solano, Carbon, 2007, 45(2), 293 CrossRef CAS PubMed.
  11. H. Nishihara, P.-X. Hou, L.-X. Li, M. Ito, M. Uchiyama, T. Kaburagi, A. Ikura, J. Katamura, T. Kawarada, K. Mizuuchi and T. Kyotani, J. Phys. Chem. C, 2009, 113(8), 3189 CAS.
  12. H. Nishihara, Q.-H. Yang, P.-X. Hou, M. Unno, S. Yamauchi, R. Saito, J. I. Parades, A. Martinez-Alonzo, J. M. D. Tascon, Y. Sato, M. Terauchi and T. Kyotani, Carbon, 2009, 47(5), 1220 CrossRef CAS PubMed.
  13. P. Malbrunot, D. Vidal and J. Vermesse, Appl. Therm. Eng., 1996, 16(5), 375 CrossRef CAS.
  14. E. Poirier and A. Dailly, Energy Environ. Sci., 2009, 2, 420 CAS.
  15. E. Poirier and A. Dailly, Nanotechnology, 2009, 20, 204006 CrossRef PubMed.
  16. E. Poirier and A. Dailly, Phys. Chem. Chem. Phys., 2012, 14, 16544 RSC.
  17. E. Poirier and A. Dailly, Langmuir, 2009, 25(20), 12169 CrossRef CAS PubMed.
  18. J. Moellmer, A. Moeller, F. Dreisbach, R. Glaeser and R. Staudt, Microporous Mesoporous Mater., 2011, 138(1–3), 140 CrossRef CAS PubMed.
  19. R. Gadiou, S.-E. Saadallah, T. Piquero, P. David, J. Parmentier and C. Vix-Guterl, Microporous Mesoporous Mater., 2005, 79(1–3), 121 CrossRef CAS PubMed.
  20. M. Georgakis, G. Stavropoulos and G. P. Sakellaropoulos, Int. J. Hydrogen Energy, 2007, 32, 3465 CrossRef CAS PubMed.
  21. L. Zhan, K. Li, X. Zhu, C. Lv and L. Ling, Letters to the editor, Carbon, 2002, 40, 455 CrossRef CAS.
  22. W. Zhao, V. Fierro, C. Zlotea, E. Aylon, M. T. Izquierdo, M. Latroche and A. Celzar, Int. J. Hydrogen Energy, 2011, 36, 5431 CrossRef CAS PubMed.
  23. P. Benard and R. Chahine, Langmuir, 1997, 13(4), 808 CrossRef CAS.
  24. D. Lozano-Castelló, J. Alcañiz-Monge, M. A. de la Casa-Lillo, D. Cazorla-Amorós and A. Linares-Solano, Fuel, 2002, 81, 1777 CrossRef.
  25. P. P. Pfeifer, J. W. Burress, M. B. Wood, C. M. Lapilli, S. A. Barker, J. S. Pobst, R. J. Cepel, C. Wexler, P. S. Shah, M. J. Gordon, G. J. Suppes, S. P. Buckley, D. J. Radke, J. Ilavsky, A. C. Dillon, P. A. Parilla, M. Benham and M. W. Roth, Mater. Res. Soc. Symp. Proc., 2008, 1041 Search PubMed 1041–R02-02.
  26. T. A. Makal, J.-R. Li, W. Lu and H.-C. Zhou, Chem. Soc. Rev., 2012, 41, 7761 RSC.
  27. J. A. Mason, M. Veenstra and J. R. Long, Chem. Sci., 2014, 5, 32 RSC.
  28. G. Ning, C. Xu, L. Mu, G. Chen, G. Wang, J. Gao, Z. Fan, W. Qian and F. Wei, Chem. Commun., 2012, 48, 6815 RSC.
  29. M. J. D. Mahboub, A. Ahmadpour, H. Rashidi and N. Jahanshahi, Adsorption, 2012, 18(3–4), 297 Search PubMed.
  30. http://accelrys.com.
  31. D. Levesque, A. Gicquel, F. Lamari Darkrim and S. Beyaz Kayiran, J. Phys.: Condens. Matter, 2002, 14(40), 9285 CrossRef CAS.
  32. L. Peng and J. R. Morris, J. Phys. Chem. C, 2010, 114, 15522 CAS.
  33. H. K. Chae, D. Y. Siberio-Pérez, J. Kim, Y.-B. Go, M. Eddaoudi, A. J. Matzger, M. O'Keeffe and O. M. Yaghi, Nature, 2004, 427, 523 CrossRef CAS PubMed.
  34. M. L. Connolly, Science, 1983, 221, 709 CAS.
  35. A. K. Rappé, C. J. Casewit, K. S. Colwell, W. A. Goddard III and W. M. Skiff, J. Am. Chem. Soc., 1992, 114(25), 10024 CrossRef.
  36. G. M. Barrow, Physical Chemistry, McGraw-Hill, New York, 6th edn, 1996 Search PubMed.
  37. T. B. Lee, D. H. Jung, D. Kim, J. Kim, K. Choi and S.-H. Choi, Catal. Today, 2009, 146(1–2), 216 CrossRef CAS PubMed.
  38. E. W. Lemmon, M. L. Huber and M. O. McLinden. NIST Standard Reference Database 23: Reference Fluid Thermodynamic and Transport Properties-REFPROP. Version 9.0, National Institute of Standards and Technology, Standard Reference Data Program, Gaithersburg, 2010 Search PubMed.
  39. M. de la Casa-Lillo, F. Lamari-Darkrim, D. Cazorla-Amoros and A. Linares-Solano, J. Phys. Chem. B, 2002, 106(42), 10930 CrossRef CAS.
  40. N. C. Gallego, L. He, D. Saha, C. I. Contescu and Y. B. Melnichenko, J. Am. Chem. Soc., 2011, 133(35), 13794 CrossRef CAS PubMed.
  41. L. Ortiz, Master's Thesis, University of Missouri-Columbia, 2012 Search PubMed.
  42. S. K. Bathia and A. L. Myers, Langmuir, 2006, 22(4), 1688 CrossRef PubMed.
  43. P. Kowalczyk, R. Hołyst, A. P. Terzyk and P. A. Gauden, Langmuir, 2006, 22(5), 1970 CrossRef CAS PubMed.
  44. P. Kowalczyk, P. A. Gauden, A. P. Terzyk and S. K. Bhatia, Langmuir, 2007, 23, 3666 CrossRef CAS PubMed.
  45. D. F. Quinn, Carbon, 2002, 40(15), 2767 CrossRef CAS.
  46. T. G. Voskuilen and T. L. Pourpoint, MRS Proceedings, 2011, 1334 CrossRef CAS , mrss11-1334-n04-05.
  47. T. Burchell and M. Rogers, SAE Tech. Pap. Ser., 2000 Search PubMed , 2000-01-2205, pp. 1.
  48. M. Georgakis, G. Stavropoulos and G. P. Sakellaropoulos, Microporous Mesoporous Mater., 2014, 191, 67 CrossRef CAS PubMed.
  49. R. A. Greinke, L. Bretz, T. Mullhaupt, US Pat., 5, 372, 619, 1994.

Footnotes

New address: Ford Motor Company, Product Development, 1201 Village Rd. Dearborn, MI 48121, USA. Tel.: +313-316-7985; E-mail: E-mail: epoirie1@ford.com; , poirierem@gmail.com.
http://www.fueleconomy.gov/feg/fcv_benefits.shtml.
§ Note that unless indicated otherwise, continuous lines in the figures are there to guide the eyes.
The excess maximum indicates the point where the adsorbed phase reaches a density high enough to displace gas. The maximum becomes further defined when va ceases to be negligible compared to the gas free volume (e.g. the helium dead space volume).

This journal is © The Royal Society of Chemistry 2014
Click here to see how this site uses Cookies. View our privacy policy here.