Hollow zinc oxide microspheres functionalized by Au nanoparticles for gas sensors

Xiaowei Lia, Wei Fenga, Yan Xiaoa, Peng Sun*a, Xiaolong Hua, Kengo Shimanoeb, Geyu Lu*a and Noboru Yamazoeb
aState Key Laboratory on Integrated Optoelectronics, College of Electronic Science and Engineering, Jilin University, Changchun, 130012, People's Republic of China. E-mail: spmaster2008@163.com; lugy@jlu.edu.cn; Fax: +86-431-85167808; Tel: +86-431-8516780
bDepartment of Energy and Material Sciences Faculty of Engineering Sciences, Kyushu University, Kasuga-shi, Fukuoka 816-8580, Japan

Received 23rd March 2014 , Accepted 16th June 2014

First published on 16th June 2014


Abstract

We present a facile one-step template-free route for the synthesis of homogeneous Au-loaded ZnO hollow spheres composed of nanoparticles. The synthesis was performed at a relatively low temperature (90 °C) with short reaction duration (40 min). Field emission scanning electron microscopy (FESEM), transmission electron microscopy (TEM) and energy dispersive X-ray spectrometry (EDX) analysis revealed that Au nanoparticles were homogeneously embedded into ZnO spherical shell, which was composed of nano-sized primary particles. Furthermore, to investigate the influence of Au nanoparticles on the sensor performance, the gas sensing properties of Au-loaded ZnO were studied. A comparative gas sensing investigation between the Au-loaded ZnO and pure ZnO hollow spheres was performed to display the superior sensing properties of the loaded samples. As expected, the sensor using 1.0 mol% Au-loaded ZnO exhibited a high response and fast response and recovery properties to ethanol, which could be attributed to the catalytic effect of Au.

1. Introduction

With the increasing concern over safety in residential areas and environmental protection, gas sensors have attracted considerable attention because of their potential applications in monitoring poisonous and hazardous gases. The advances in nanotechnology as well as synthetic methods have promoted the fabrication of various gas sensors based on different kinds of sensing materials, including metal oxide semiconductors, polymers, carbon nanotubes, and moisture absorbing materials.1 Among them, the recognition of semiconducting metal oxide as sensing materials can date back to the 1960s when it is discovered that the electrical conductivity of metal oxides will change quickly as soon as the reducing gas is adsorbed and desorbed on their surfaces.2 To date, metal oxide semiconductors are known for decades as the most common sensing materials, mainly because of their advantages such as low cost, controllable preparation and high sensitivity.3,4

Zinc oxide (ZnO), as a versatile metal oxide semiconductor ( Eg = 3.37 eV at 300 K), has been extensively investigated as sensing materials towards various different oxidizing and reducing gases, such as NO2, H2, CO, NH3, and CH3OH.5–9 It is well known that the sensing performances of nanomaterials are closely related to their morphology and crystalline size.10,11 For this reason, significant efforts have been devoted to enhance the sensing properties or device performance by preparing various distinct nanostructures of ZnO, including nanowires,12 nanotubes,13 porous nanoplates,14 nanopyramids,15 and hierarchical architectures,16,17 etc. In particular, the porous or hollow ZnO structure, due to its low density, high surface area, and good gas permeability, has become a perfect candidate for sensing materials. Besides the control over the morphologies of sensing materials, the surface modification with noble metals, including Pt, Pd, Ag, and Au, has been demonstrated to be very simple and efficient alternative strategy for improving the gas-sensing performance of ZnO.18–21 However, conventional process used for surface modification with noble metals was usually carried out via two-step route.20–25 First, ZnO micro- and nanostructures were synthesized by diverse approaches, such as thermal evaporation, chemical vapor deposition, hydrothermal reaction and water bath, and then coated and loaded with noble metal nanoparticles through vigorous stirring or continuous heating, which undoubtedly increases the complexity of the experiment and makes the synthesis process quite tedious and inefficient. Thus, the design and synthesis of noble metal modified ZnO via a one-step and economical route is still a challenge and have importantly scientific significance.

In this paper, one-step microwave-assisted reduction method was performed to prepare monodisperse Au-loaded ZnO hollow microspheres under atmospheric pressure. Microwave-assisted heating, owing to its unique features, such as homogeneous volumetric heating, high reaction rate, selectivity heating, and energy saving,26,27 make the synthesis become facile and effective. Meanwhile, various techniques were employed for the characterization of the structure and morphology of as-synthesized ZnO microspheres. The results displayed that Au nanoparticles were homogeneously embedded into ZnO spherical shell. In order to evaluate the sensing performance, the gas sensing properties of Au-loaded and pure ZnO hollow microspheres were studied. It was found that the sensor based on Au-loaded ZnO hollow microspheres exhibited superior sensing performance for ethanol in terms of sensitivity, response speed and recover time than pure ZnO.

2. Experimental

2.1 Synthesis and characterization of the sensing materials

All the reagents in the experiment were analytical-grade purity (Beijing Chemicals Co. Ltd.) and used as received without any further purification. In a typical experiment, 4 mmol of zinc acetate dihydrate (Zn(CH3COO)2·2H2O) and 1 mmol of trisodium citrate dihydrate (Na3C6H5O7·2H2O) were dissolved in 50 mL deionized water under constant stirring. Then, 5 mL aqueous ammonia (30 wt% NH3 in water) was dropwise introduced into the above solution. The resultant mixture was vigorously stirred for 5 min, followed by addition of an appropriate volume of previously prepared HAuCl4 solution (10 mmol L−1). Subsequently, the volume of the mixed solution was adjusted to 100 mL by adding a certain amount of deionized water. After several minutes of ultrasonic dispersing, the mixture was transferred into a three-necked flask and maintained at 90 °C for 40 min under microwave irradiation with the power set at 300 W. The Au-loaded ZnO were collected by centrifugation, washed with ethanol and deionized water several times, and dried in vacuum at 60 °C. Finally, the precipitate was calcined at 450 °C for 2 h. A series of 0.0, 0.5, 1.0, and 1.5 mol% (the molar percentage was defined as the ratio of the number of moles of HAuCl4 to that of Zn(CH3COO)2·2H2O) Au-loaded ZnO hollow architectures were synthesized and named as sample 1, sample 2, sample 3, and sample 4.

The as-prepared products were characterized by X-ray powder diffraction (XRD) using a Rigaku D/max-2550 diffractometer (operated at 40 kV/200 mA) with Cu Kα radiation (λ = 1.5406 Å) in the range of 20–80° (2θ) at a scanning rate of 12° per minute, field emission scanning electron microscopy (FESEM, JEOL JSM-7500F, operated at 15 kV), transmission electron microscopy (TEM), and high resolution transmission electron microscopy (HRTEM, JEM 2100F, with an accelerating voltage of 200 kV), respectively. The energy dispersive X-ray spectrometry (EDX) result was measured by the FESEM attachment.

2.2 Fabrication and measurement of gas sensors

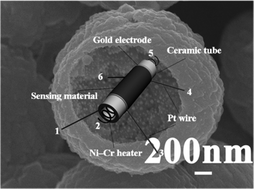
The gas sensors based on the as-prepared products were fabricated as follows: the products were mixed with deionized water to form a slurry, and then coated onto an alumina tube, at each end of which a pair of gold electrodes had been installed. In order to facilitate the signal collection, each gold electrode was connected with two platinum wires. The operating temperature of the sensor was controlled by adjusting the current passing through the Ni–Cr alloy coil, which was placed through the alumina tube. Finally, the sensor was constructed by connecting the corresponding junctions on the components of sensor, whose structures are shown in Fig. 1(a and b). The gas-sensing properties of the sensors were measured by using a RQ-2 intelligent analysis system. The measurement was processed by a static process: the sensor was placed in a test chamber full of fresh air at the beginning, and then a given amount of test gas was injected into the chamber by a microsyringe. After the response reaching a steady value, the sensor was transferred into another chamber also full of fresh air and began to recover. The gas response S was defined as the ratio (S = Ra/Rg) of the resistance of the sensor in fresh air (Ra) to that in tested gases (Rg). The time taken by the sensor to achieve 90% of the total resistance change in the case of adsorption and desorption was defined as the response time and recovery time, respectively.
image file: c4ra02541e-f1.tif
Fig. 1 Schematic structures of sensor's components (a) ceramic tube; (b) tube base.

3. Results and discussion

3.1 Structural and morphological characteristics

Fig. 2 shows the XRD pattern of the as-synthesized powder with different Au contents. For the pure ZnO (sample 1), it is found that no peaks of impurities and other crystalline phase were existed. All of the diffraction peaks could be readily indexed to a wurtzite structure of ZnO, which was in good agreement with those from the standard JCPDS card no. 36-1451, with lattice parameters a = 3.249 Å and c = 5.206 Å. For the as-prepared Au-loaded ZnO (sample 2–4), it can be seen that the peaks of Au started to emerge in the patterns, and the intensities of Au peaks gradually increased with the Au loading amount, which indicated the increasing number of Au particles were loaded on ZnO structures.
image file: c4ra02541e-f2.tif
Fig. 2 X-ray diffraction patterns of as-prepared samples with different Au content.

The morphology of the obtained samples was characterized using a field emission scanning electron microscopy (FESEM), as shown in Fig. 3a–d. When there was no Au source added in the precursor solution, numerous monodisperse hollow spheres with uniform size could be obtained (see Fig. 3a and the inset). No other morphologies were detected, which indicated a high yield of these hollow microstructures. The details about the formation mechanism of the hollow spheres has already been proposed in our previous research.28 Fig. 3b–d and corresponding insets display the SEM images of a series of Au-loaded ZnO hollow microspheres. By comparing the images before and after loading, it was clearly found that the overall morphology of the microspheres was maintained, but a drastic change in the diameter was observed at the loading concentration of 1.5 mol%.


image file: c4ra02541e-f3.tif
Fig. 3 SEM images of ZnO hollow microspheres obtained by doping different amounts of Au: (a) 0.0 mol%; (b) 0.5 mol%; (c) 1.0 mol%; (d) 1.5 mol%.

Further detailed structural analysis of the Au-loaded ZnO hollow structures was carried out using TEM and HRTEM. Fig. 4a depicts a typical TEM image of an Au-loaded ZnO structure (sample 3), from which the obvious contrast between the dark solid edges and the pale hollow space confirmed the existence of a hollow structure in the resulting spheres. Fig. 4b presents a fragment of Au-loaded ZnO microsphere. It can be noted that many dark spots (partly marked by the black arrows) were dotted over the surface of microsphere. HRTEM result certified that the dark spots were Au nanoparticles with a lattice spacing of about 0.235 nm (indicated by d2), corresponding to the (111) plane of Au, while the spacing between adjacent lattice planes marked by d1 was 0.26 nm, which can be indexed to the (002) plane of the wurtzite ZnO (Fig. 4c). The SEM image as well as the elemental maps of an individual Au-loaded ZnO microsphere (sample 3) was investigated by EDX. The results indicated that the hollow spheres were composed of only Zn, O, and Au (the inset of Fig. 5a). The SEM elemental mapping was conducted to clearly identify the spatial distributions of Zn, O, and Au in the hollow sphere (as shown in Fig. 5b–d). It can be seen that Au were distributed homogeneously within the entire ZnO hollow structure, which coincided with the observation of the TEM (Fig. 4b).


image file: c4ra02541e-f4.tif
Fig. 4 Typical TEM images of the Au-loaded ZnO (1.0 mmol%): (a) representative image of an individual ZnO hollow microsphere; (b) enlarged TEM image of a single cracked sample; (c) HRTEM image of the sample.

image file: c4ra02541e-f5.tif
Fig. 5 (a) Typical SEM image of Au-loaded ZnO; (b) elemental mapping of Zn; (c) elemental mapping of O; (d) elemental mapping of Au.

3.2 Gas sensing properties

For comparison, the sensors based on as-synthesized pure and Au-loaded ZnO were fabricated simultaneously. Fig. 6a shows their response to 200 ppm ethanol at operating temperatures ranging from 200 to 375 °C. From the pattern we can see that the response of these sensors varied with operating temperature. For the unloaded sensor, the response first increased with the operating temperature, up to 350 °C, and then gradually decreased on further increasing the operating temperature. The highest response to 200 ppm ethanol was 6.2 at 350 °C. For the loaded sensors, the optimal operating temperature had a slight shift towards to a lower temperature, and the maximum response was obtained at 325 °C with the value of 9, 14.5 and 9.8 for sample 2, sample 3 and sample 4, respectively. Among all the sensors, the sensor based on the 1.0 mol% Au-loaded ZnO presented double enhancement in response compared to pure ZnO. The above results suggest that the performances of the ZnO-based sensors have been greatly improved by the loading of Au.
image file: c4ra02541e-f6.tif
Fig. 6 (a) Response of the samples synthesized by doping different amounts of Au nanoparticles to 200 ppm ethanol as a function of operating temperature; (b) variation and comparison of the sensors to different ethanol concentrations at their respective optimal operating temperature.

Fig. 6b gives the response of the sensors with respect to the varying ethanol concentration. It can be seen that the response of all the sensors showed an approximately linear increase from 10 to 200 ppm, and then increased with a slightly lower slope after 200 ppm as the sensor began to saturate, which indicated that the sensor has a broad detection range to ethanol. Besides, the enhanced ethanol sensing performance of Au-loaded ZnO also confirmed the promotional effect of Au loading.

Another important criterion of gas sensors is the response and recover properties, and rapid response and recovery to a target gas are demanded for practical application. Fig. 7a illustrates the response transients of the sensors to 200 ppm ethanol under optimal operating temperature. It can be seen that all of the sensors maintained their initial response amplitude without a clear attenuation upon five periods test, which indicated the good repeatability and stability of the sensors. For the unloaded sensor, the response and recover time were 4 and 35 s (Fig. 7b), whereas the value of that decreased to 1 and 30 s (Fig. 7c) for the 1.0 mol% Au–ZnO (sample 3).


image file: c4ra02541e-f7.tif
Fig. 7 (a) Reproducibility and transient response of the sensors based on the unloaded and Au-loaded ZnO to 200 ppm ethanol; (b and c) enlarged response curves of the sensors based on sample 1 and sample 3, respectively.

Fig. 8 shows a bar graph of the response of sensor using 1.0 mol% Au-loaded ZnO hollow spheres to various organic compound (VOC) testing gases, including formaldehyde, acetone, methylbenzene, dimethylbenzene, methanol and ethanol. All of the gases were tested at an operating temperature of 325 °C with a concentration of 200 ppm. It can be seen that the sensor exhibited an obvious response to ethanol, and less effective response to any other test gases. The highest response of the sensor was about 14.5 to ethanol, while the responses to other gases were no greater than 3.5. Therefore, it is concluded that the selectivity of the sensor based on hollow Au-loaded ZnO spheres to ethanol against other VOC gases is exceeding almost by 4 times.


image file: c4ra02541e-f8.tif
Fig. 8 Response characteristics of the sensor based on 1.0 mmol% Au-loaded ZnO to various volatile organic compound (VOC) gases.

It is well known that sensing mechanism of metal oxides is closely related to the change in resistance caused by the adsorption of oxygen and reaction of test gas molecules on the surface.29,30 When the sensor based on pure ZnO sample is exposed to air, the high coverage of adsorbed oxygen species (O2, O or O2−) can obtain free electron from the conduction band of ZnO, which will result in the formation of depletion layers on the surface of ZnO and an increase in resistance of the sensor. When the sensor is exposed to a reducing gas such as ethanol, these gas molecules will react with adsorbed oxygen species on the surface and release the trapped electrons back to the conduction band and eventually lead to a decrease of the resistance.31,32 In this work, it was obvious that the Au functionalization could improve the ethanol-sensing characteristics of ZnO hollow microspheres in term of response. This promoting effects may be explained by the following fact that the Au nanoparticle can act as a specific site to adsorb and dissolve oxygen molecules.33,34 Compared with pure ZnO, more adsorbed oxygen can diffuse faster to the surface of ZnO hollow spheres and capture more electrons from the conduction band, thus leading to the broadening of surface space charge layer. Therefore, the resistance value of Au-loaded ZnO is larger as compared with pure ZnO. For instance, the electrical resistance in air for Au-loaded sensor (sample 3) is about 4 times compared with that based on the unloaded ZnO. During the subsequent contact with reducing gases, more trapped electrons are transferred backwards to the conduction band of ZnO, and the significant change of resistance eventually leads to a higher sensitivity. Furthermore, there is a well-established mechanism known as the “chemical sensitization”, which proposes that the noble metal catalyst can break the reducing gases into more active radicals and allow them to diffuse to the surface of the sensing material to react with adsorbed oxygen species.35–37 The noble metal additive (Au nanoparticles) thus can accelerate the chemical reaction between test gas and adsorbed oxygen, which results in a faster response and recover speed than the pure ZnO sensor. As is well known, the response depends on the change of resistance in sensing body, which is derived from the reactivity and diffusion of gas molecules inside sensing body. If the surface catalytic activity of the sensing body is enhanced excessively, leading to less amount of target gas diffusion into the interior region of sensing body. Consequently, the response of the sensor after loading more Au will be reduced, due to a low utilization ratio of sensing body.

4. Conclusions

In conclusion, the hollow unloaded and Au-loaded ZnO microstructures have been prepared by a simple one-step microwave-assisted route, which is expected to be a potential candidate for developing other more functional materials in a very short time. Compared with their unloaded counterpart, the Au-loaded ZnO showed better properties to ethanol in the following aspects, namely, sensitivity, response and recover speed. This enhanced gas sensing properties could be ascribed to the catalytic effect of Au. The obtained results demonstrate that appropriate Au doping contribute a lot for the improvement of gas sensing.

Acknowledgements

This work is supported by the National Nature Science Foundation of China (no. 61074172, 61134010, and 61327804) and Program for Chang Jiang Scholars and Innovative Research Team in University (no. IRT1017). National High-Tech Research and Development Program of China (863 Program, no. 2013AA030902).

Notes and references

  1. X. Liu, S. Cheng, H. Liu, S. Hu, D. Zhang and H. Ning, Sensors, 2012, 12, 9635–9665 CrossRef PubMed.
  2. T. Seiyama, A. Kato, K. Fujiishi and M. Nagatani, Anal. Chem., 1962, 34, 1502–1503 CrossRef CAS.
  3. Y. F. Sun, S. B. Liu, F. L. Meng, J. Y. Liu, Z. Jin, L. T. Kong and J. H. Liu, Sensors, 2012, 12, 2610–2631 CrossRef CAS PubMed.
  4. G. F. Fine, L. M. Cavanagh, A. Afonja and R. Binions, Sensors, 2010, 10, 5469–5502 CrossRef CAS PubMed.
  5. V. Kruefu, C. Liewhiran, A. Wisitsoraat and S. Phanichphant, Sens. Actuators, B, 2011, 156, 360–367 CrossRef CAS PubMed.
  6. A. Qurashi, N. Tabet, M. Faiz and T. Yamzaki, Nanoscale Res. Lett., 2009, 4, 948–954 CrossRef CAS PubMed.
  7. T. Krishnakumar, R. Jayaprakash, N. Pinna, N. Donato, A. Bonavita, G. Micali and G. Neri, Sens. Actuators, B, 2009, 143, 198–204 CrossRef PubMed.
  8. J. B. Law and J. T. Thong, Nanotechnology, 2008, 19, 205502 CrossRef CAS PubMed.
  9. J. Zhang, S. Wang, M. Xu, Y. Wang, B. Zhu, S. Zhang, W. Huang and S. Wu, Cryst. Growth Des., 2009, 9, 3532–3537 CAS.
  10. L. Liao, H. B. Lu, J. C. Li, H. He, D. F. Wang, D. J. Fu, C. Liu and W. F. Zhang, J. Phys. Chem. C, 2007, 111, 1900–1903 CAS.
  11. Z. Li, W. Pan, D. Zhang and J. Zhan, Chem. – Asian J., 2010, 5, 1854–1859 CrossRef CAS PubMed.
  12. W. Y. Wu, J. M. Ting and P. J. Huang, Nanoscale Res. Lett., 2009, 4, 513–517 CrossRef CAS PubMed.
  13. Y. J. Chen, C. L. Zhu and G. Xiao, Sens. Actuators, B, 2008, 129, 639–642 CrossRef CAS PubMed.
  14. Z. Jing and J. Zhan, Adv. Mater., 2008, 20, 4547–4551 CrossRef CAS.
  15. M. Z. Ahmad, J. Chang, M. S. Ahmad, E. R. Waclawik and W. Wlodarski, Sens. Actuators, B, 2013, 177, 286–294 CrossRef CAS PubMed.
  16. M. R. Alenezi, S. J. Henley, N. G. Emerson and S. R. P. Silva, Nanoscale, 2014, 6, 235–247 RSC.
  17. S. H. Ko, D. Lee, H. W. Kang, K. H. Nam, J. Y. Yeo, S. J. Hong, C. P. Grigoropoulos and H. J. Sung, Nano Lett., 2011, 11, 666–671 CrossRef CAS PubMed.
  18. X. H. Liu, J. Zhang, X. Z. Guo, S. H. Wu and S. R. Wang, Nanoscale, 2010, 2, 1178–1184 RSC.
  19. D. Zhang, J. Li, Y. Chen, Q. S. Wu and Y. P. Ding, CrystEngComm, 2012, 14, 6738–6743 RSC.
  20. M. Ahmad, Y. Y. Shi, A. Nisar, H. Y. Sun, W. C. Shen, M. Wei and J. Zhu, J. Mater. Chem., 2011, 21, 7723–7729 RSC.
  21. Y. Zhang, Q. Xiang, J. Xu, P. Xu, Q. Pan and F. Li, J. Mater. Chem., 2009, 19, 4701 RSC.
  22. X. Liu, J. Zhang, L. Wang, T. Yang, X. Guo, S. Wu and S. Wang, J. Mater. Chem., 2011, 21, 349 RSC.
  23. T. Tan, Y. Li, Y. Liu, B. Wang, X. Song, E. Li, H. Wang and H. Yan, Mater. Chem. Phys., 2008, 111, 305–308 CrossRef CAS PubMed.
  24. J. J. Wu and C.-H. Tseng, Appl. Catal., B, 2006, 66, 51–57 CrossRef CAS PubMed.
  25. X. Han, W. J. Qin, J. Sun, J. Yang, K. Y. Niu, H. L. Wang and X. W. Du, J. Alloys Compd., 2009, 477, 661–664 CrossRef CAS PubMed.
  26. I. Bilecka and M. Niederberger, Nanoscale, 2010, 2, 1358–1374 RSC.
  27. M. Baghbanzadeh, L. Carbone, P. D. Cozzoli and C. O. Kappe, Angew. Chem., Int. Ed., 2011, 50, 11312–11359 CrossRef CAS PubMed.
  28. X. W. Li, P. Sun, T. L. Yang, J. Zhao, Z. Y. Wang, W. N. Wang, Y. P. Liu, G. Y. Lu and Y. Du, CrystEngComm, 2013, 15, 2949–2955 RSC.
  29. S. S. Badadhe and I. S. Mulla, Sens. Actuators, B, 2009, 143, 164–170 CrossRef PubMed.
  30. P. Sun, S. Du, T. Yang, X. Li, F. Liu, X. Liang, Y. Gao, Y. Sun and G. Lu, RSC Adv., 2013, 3, 7112 RSC.
  31. Y. Shimizu, T. Maekawa, Y. Nakamura and M. Egashira, Sens. Actuators, B, 1998, 46, 163–168 CrossRef CAS.
  32. T. Hyodo, S. Abe, Y. Shimizu and M. Egashira, Sens. Actuators, B, 2003, 93, 590–600 CrossRef CAS.
  33. L. L. Wang, H. M. Dou, Z. Lou and T. Zhang, Nanoscale, 2013, 5, 2686–2691 RSC.
  34. B. K. Min and C. M. Friend, Chem. Rev., 2007, 107, 2709–2724 CrossRef CAS PubMed.
  35. S. Cui, H. Pu, E. C. Mattson, G. Lu, S. Mao, M. Weinert, C. J. Hirschmugl, M. Gajdardziska-Josifovska and J. Chen, Nanoscale, 2012, 4, 5887–5894 RSC.
  36. N. Yamazoe, G. Sakai and K. Shimanoe, Catal. Surv. Asia, 2003, 7, 63–75 CrossRef CAS.
  37. S. J. Teichner, Appl. Catal., 1990, 62, 1–10 CrossRef CAS.

This journal is © The Royal Society of Chemistry 2014