Triazole-acetate functionalized gold nanoparticles for colorimetric Pb(II) sensing

I-Lin Lee, Yi-Ming Sung and Shu-Pao Wu*
Department of Applied Chemistry, National Chiao Tung University, Hsinchu, Taiwan 300, Republic of China. E-mail: spwu@mail.nctu.edu.tw; Fax: +886-3-5723764; Tel: +886-3-5712121 ext. 56506

Received 20th March 2014 , Accepted 30th May 2014

First published on 30th May 2014


Abstract

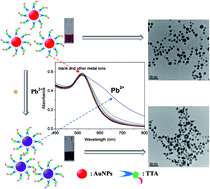
New triazole-acetate functionalized gold nanoparticles (TTA–AuNPs) for sensitive and selective colorimetric detection of Pb2+ were developed. Aggregation of TTA–AuNPs was induced immediately in the presence of Pb2+, yielding a color change from wine-red to purple. This Pb2+-induced aggregation of TTA–AuNPs was monitored by the bare eye and UV-vis spectroscopy with a detection limit of 16.7 nM. TTA–AuNPs showed excellent selectivity toward Pb2+compared to other metal ions through the interaction between the carboxyl group and triazole structure of TTA and Pb2+. The best detection of Pb2+ was achieved in a pH range from 5 to 10. Furthermore, TTA–AuNPs were applied to detect Pb2+ in lake water with low interference.

1. Introduction

Lead is one of the most toxic heavy metal elements. Because lead is widely used, such as in gasoline, pipes, paint pigments, and batteries, lead contamination has become a serious environmental problem.1 Lead can cause damage to the nervous, immune, and cardiovascular systems and induce various health problems, including memory loss, anemia, gout, and hypertension.2 Owing to the extreme toxicity of lead, the US Environmental Protection Agency (EPA) established the standard maximum concentration level of lead in drinking water to be 15 ppb (15 ng mL−1; 72.4 nM). Therefore, the development of ultrasensitive and quantitative detection of lead is an important issue for environmental protection and disease treatment.

Several analytical methods for the detection of lead ions have been proposed, including atomic absorption spectrometry (AAS),3 inductively coupled plasma mass spectroscopy (ICP-MS),4 and electrochemistry.5,6 However, since these methods require sophisticated instruments, they cannot be easily employed in on-site assays. Colorimetric assays based on functionalized gold nanoparticles (AuNPs) have provided a simple way to overcome these limitations.

AuNPs are highly studied nanomaterials and widely used in a range of applications including: sensing, electronics, and surface enhanced Raman spectroscopy. The surface plasma resonance (SPR) absorption of AuNPs is extremely sensitive to their size, shape, surrounding media, and inter-particle distances.7,8 Many AuNPs-based colorimetric sensors use the inter-particle plasmon coupling caused by the analyte-induced aggregation of AuNPs to detect analyte.9 In these assays, analyte-triggered aggregation of AuNPs causes a red shift in the SPR absorption band, resulting in a red-to-blue color change. The distance-dependent SPR absorption of AuNPs has become a useful tool for the development of colorimetric sensing of various analytes, such as metal ions10–18 and anions.19–21

In this report, triazole-acetate functionalized gold nanoparticles (TTA–AuNPs) were synthesized for detecting Pb2+. The gold nanoparticles were prepared through the borohydride-mediated reduction of HAuCl4. 5-(1,2-Dithiolan-3-yl)-N-(prop-2-yn-1-yl)pentanamide (TP) was attached to the surface of AuNPs through the dithiol group. Finally, the azide part of azidoacetic acid and the acetylene part of TP were combined to form a triazole structure on the surface of AuNPs through a click reaction. The synthesized 2-(4-((5-(1,2-dithiolan-3-yl)pentanamido)methyl)-1H-1,2,3-triazol-1-yl)acetic acid–AuNPs (TTA–AuNPs) can be used for metal ion detection (Scheme 1). Metal ions such as Ag+, Al3+, Ca2+, Cd2+, Co2+, Cu2+, Cr3+, Fe2+, Fe3+, Hg2+, Mg2+, Mn2+, Ni2+, Pb2+, and Zn2+ were tested for metal ion selectivity but Pb2+ was the only metal ion that caused the aggregation of TTA–AuNPs. This caused the SPR absorption band of the TTA–AuNPs to shift to a longer wavelength, and consequently a color change from wine-red to purple. This color change can be used to detect the presence of Pb2+ ions. The SPR absorption at 700 nm directly indicates the degree of TTA–AuNPs aggregation caused by the addition of Pb2+ ions.


image file: c4ra02448f-s1.tif
Scheme 1 Synthesis of TTA–AuNPs.

2. Materials and methods

2.1 Chemicals

Hydrogen tetrachloroaurate(III) tetrahydrate was purchased from Showa. Lipoic acid, N,N-diisopropylethylamine, AgClO4·χH2O and Pb(ClO4)2·3H2O were purchased from Acros. Propargylamine, O-(benzotriazol-1-yl)-N,N,N′,N′-tetramethyluronium hexafluorophosphate (HBTU), bromoacetic acid, sodium ascorbate, Al(ClO4)3·9H2O, and Cr(ClO4)3·6H2O were purchased from Alfa Aesar. Sodium borohydride, sodium azide, copper sulfate, Ca(ClO4)2·4H2O, Cd(ClO4)2·χH2O, CoCl2·6H2O, Cu(BF4)2·χH2O, Fe(BF4)2·6H2O, FeCl3·6H2O, Hg(ClO4)2·χH2O, Mg(ClO4)2·6H2O, Ni(CH3CO2)·4H2O, Zn(BF4)2·χH2O and KBr were purchased from Sigma-Aldrich. K2Cr2O7 and MnSO4·H2O were purchased from Riedel-de Haen. For all aqueous solutions, deionized water (resistivity, 18.0 MΩ cm at 25 °C) purified by Millipore Direct-Q water purification unit was used.

2.2 Instruments

Absorption spectra were measured on an Agilent 8453 UV-vis spectrometer (Santa Clara, CA, USA) using a 1.0 cm quartz cell. IR spectra were recorded with KBr pellets on Bomem DA8.3 FTIR spectrometer (Quebec, Canada). HR-TEM images were obtained from JEOL JEM-3000F high-resolution transmission electron microscope (Tokyo, Japan). The average size of nanoparticles was statistically determined by measuring the diameter of 150 particles from the HR-TEM image using ImageJ software. ICP-MS data were acquired on ICP-MS Perkin Elmer, SCIEX ELAN 5000 (Waltham, MA, USA).

2.3 Synthesis of TTA–AuNPs

5-(1,2-Dithiolan-3-yl)-N-(prop-2-yn-1-yl)pentanamide (TP) and azidoacetic acid were synthesized according to the ref. 22 and 23. Gold nanoparticles were prepared by reducing HAuCl4 with sodium borohydride. All glassware was thoroughly cleaned with aqua regia (3[thin space (1/6-em)]:[thin space (1/6-em)]1, HCl/HNO3) and rinsed with deionized water prior to use. Briefly, to 100 mL deionized water, HAuCl4 (80 mM, 270 μL) and TP (10 mM, 50 μL) were added and stirred for 15 min. Freshly prepared sodium borohydride (0.1 M, 1 mL) was added dropwise to the mixture and stirred for 2 h. The color of the aqueous solution became wine-red, indicating that TP-capped gold nanoparticles formed. Then azidoacetic acid (10 mM, 50 μL) was added to the TP–AuNPs solution. The mixture was stirred for 15 min, and heated to 60 °C. To this mixture, a solution of sodium ascorbate (20 mM, 100 μL) mixed with copper sulfate (2 mM, 100 μL) was added slowly and stirred for a further 2 h. After cooled to room temperature, TTA–AuNPs were purified by dialysis membrane (Spectra/Pro7 Membrane, MWCO 3500) for 3 h, with three changes of the deionized water (at 1 h interval), to remove impurities.

2.4 Colorimetric detection of Pb2+ ions

To a 1.0 mL of solution containing TTA–AuNPs, different metal ions (5 μM) were added separately. The mixture were maintained at room temperature for 10 min and then transferred separately into a 1.0 cm quartz cell. The absorption spectra were recorded by UV-vis spectrometer.

2.5 Analysis of lake water samples

A water sample from the lake located in NCTU, Hsinchu, Taiwan, was collected and filtered through a 0.2 μm membrane. To the 500 μL of lake water, different volumes (25, 45, and 75 μL) of Pb2+ standard solution (100 μM) were spiked separately. The spiked samples were then added to the 500 μL of TTA–AuNPs solutions and maintained at room temperature for 10 min. The final concentrations of Pb2+ were 2.5, 4.5, and 7.5 μM, respectively. The analytical results were obtained by ICP-MS and the developed sensing method.

3. Results and discussion

3.1 Synthesis and characterization of TTA–AuNPs

Gold nanoparticles were prepared through the borohydride-mediated reduction of HAuCl4. 5-(1,2-Dithiolan-3-yl)-N-(prop-2-yn-1-yl)pentanamide (TP) was added into the as-prepared AuNPs solution as the capping agent. The azide part of azidoacetic acid and the acetylene part of TP were combined to form a triazole structure under the click reaction. The synthesized TTA–AuNPs can be used for further studies (Scheme 1). HR-TEM images revealed that the size of TTA–AuNPs ranged from 1 nm to 9 nm, with an average size of 4.9 nm (Fig. 1). The cycloaddition products from the click reaction were verified by infrared spectroscopy (Fig. 2). For TP–AuNPs (Fig. 2a), the peaks at 2934 cm−1 and 3227 cm−1 represents CH2–S and N–H stretches, respectively, while the peak at 2116 cm−1 represents C[triple bond, length as m-dash]C stretches, indicating that TP was modified onto the surface of AuNPs. In Fig. 2b, the peak that was originally at 2116 cm−1 (–C[triple bond, length as m-dash]CH) disappeared, while a broad band between 2800 cm−1 to 3500 cm−1 (O–H) appeared, indicating that the click reaction proceeded on the surface of AuNPs.
image file: c4ra02448f-f1.tif
Fig. 1 (a) TEM image of TTA–AuNPs. The scale bar is 20 nm. (b) The size distribution of TTA–AuNPs.

image file: c4ra02448f-f2.tif
Fig. 2 FT-IR spectra of (a) TP–AuNPs and (b) TTA–AuNPs.

3.2 Metal ion binding study

To evaluate the selectivity of TTA–AuNPs toward various metal ions, the absorption spectra of TTA–AuNPs were measured in the presence of 16 metal ions: Ag+, Al3+, Ca2+, Cd2+, Co2+, Cr3+, Cr6+, Cu2+, Fe2+, Fe3+, Hg2+, Mg2+, Mn2+, Ni2+, Pb2+, and Zn2+. In Fig. 3, only Pb2+ induced an obvious absorption change and color change from wine-red to purple, both indicating the aggregation of AuNPs. As a result of this aggregation, the absorbance at 519 nm decreased while the absorbance at 700 nm increased. Therefore, TTA–AuNPs shows excellent selectivity on Pb2+ over other metal ions. Pb2+ induced aggregation of TTA–AuNPs is evident in the HR-TEM images (Fig. 4). Pb2+ has effectively functioned as a bridge between particles, triggering the aggregation of TTA–AuNPs (Scheme 2). This bridging interaction between Pb2+ and TTA was conducted through the carboxyl group and triazole structure (present in TTA on the surface of TTA–AuNPs).
image file: c4ra02448f-f3.tif
Fig. 3 Photographic images (top) and UV-vis spectra (bottom) of TTA–AuNPs in the presence of various metal ions (5 μM).

image file: c4ra02448f-f4.tif
Fig. 4 TEM image of TTA–AuNPs in the presence of Pb2+ (5 μM).

image file: c4ra02448f-s2.tif
Scheme 2 Schematic depiction of Pb2+-induced aggregation of TTA–AuNPs.

3.3 The influence of pH on Pb2+-induced aggregation of TTA–AuNPs

To investigate the pH range in which TTA–AuNPs could effectively detect Pb2+, a pH titration was carried out. Fig. 5 shows that the absorbance ratio (A700/A519) of TTA–AuNPs increased when pH values were less than 5. Protonation of carboxylate anions resulted in the aggregation of AuNPs via hydrogen binding under acidic conditions (pH < 5). In the pH range of 5 to 12, the absorbance ratio (A700/A519) was constant, indicating that TTA–AuNPs were stable in this pH range. After addition of Pb2+, the absorbance ratio (A700/A519) increased significantly in the pH range of 5 to 10. At pH > 10, the absorbance ratio (A700/A519) decreased due to the formation of colloidal Pb(OH)2. Thus, conditions at pH 5 to 10 are suitable for monitoring Pb2+ by means of absorption change.
image file: c4ra02448f-f5.tif
Fig. 5 Influence of pH on the absorbance ratio (A700/A519) of TTA–AuNPs in the absence (image file: c4ra02448f-u1.tif) and presence (image file: c4ra02448f-u2.tif) of Pb2+ (5 μM).

The degree of aggregation of TTA–AuNPs depends on the concentration of Pb2+ ions. The absorption spectra changed with the addition of different concentrations of Pb2+ (Fig. 6). The absorbance at 519 nm decreased while at 700 nm it increased with increasing Pb2+ concentration. A linear relationship was found in the plot of the absorbance at 700 nm (A700) versus Pb2+ concentration over the range of 0.5 μM to 8 μM (inset plot of Fig. 6). The limit of detection for Pb2+ was found to be 16.7 nM.


image file: c4ra02448f-f6.tif
Fig. 6 Absorption spectral changes of TTA–AuNPs in the presence of different concentrations of Pb2+. The inset shows the corresponding plot of the absorbance (A700) versus Pb2+ concentration over the range of 0.5 μM to 8 μM.

Aggregated TTA–AuNPs can be redispersed by removing Pb2+ ions with EDTA; this was confirmed by the consequent SPR absorption shift from 700 nm to 519 nm (Fig. 7). After removing the solution using a centrifuge and suspending it with an aqueous media, the dispersed TTA–AuNPs can be reused to detect Pb2+. Through this technique, the TTA–AuNPs system can be used repeatedly for the detection of Pb2+.


image file: c4ra02448f-f7.tif
Fig. 7 Reversible binding of TTA–AuNPs with Pb2+ (5 μM) in the presence of EDTA (1 mM).

3.4 Interference study

In order to study the influence of other metal ions on Pb2+ binding to TTA–AuNPs, competitive experiments were carried out in the presence of Pb2+ with Ag+, Al3+, Ca2+, Cd2+, Co2+, Cr3+, Cr6+, Cu2+, Fe2+, Fe3+, Hg2+, Mg2+, Mn2+, Ni2+, and Zn2+ (Fig. 8).
image file: c4ra02448f-f8.tif
Fig. 8 Absorbance ratio (A700/A519) of TTA–AuNPs in the presence of metal ions. Red bars represent the addition of a single metal ion (5 μM); blue bars represent the mixture of Pb2+ (5 μM) with another metal ion (5 μM).

The absorbance changes caused by the mixture of Pb2+ with the other metal ions were similar to that caused by Pb2+ alone. This indicated that none of the other metal ions interfere in the binding of TTA–AuNPs with Pb2+. This finding is consistent with the previous study suggesting that Pb2+ was the only metal ion that could bind to the TTA–AuNPs.

3.5 Analytical application in lake water

To confirm the practical application of TTA–AuNPs, a water sample from the lake located in NCTU, Hsinchu, Taiwan, was collected and spiked with different amounts of Pb2+ standard solution. A calibration curve of TTA–AuNPs absorbance ratio (A700/A519) in the presence of different concentrations of Pb2+ was prepared (Fig. S2). The analytical results are shown in Table 1. The recovery ranged from 97.6% to 102%, and RSD from about 1.2% to 1.6%. The results obtained with TTA–AuNPs are in good agreement with those obtained by ICP-MS. These results demonstrate that the designed probe is applicable for Pb2+ detection in lake water samples.
Table 1 Results of Pb2+ detection in lake water samples
Sample Added (μM) Founda (μM) Recovery (%) RSD (%) ICP-MS (μM)
a n = 3.
Lake water 2.5 2.47 98.8 1.6 2.34
4.5 4.39 97.6 1.2 4.27
7.5 7.65 102 1.5 7.48


4. Conclusion

In summary, new triazole-acetate functionalized gold nanoparticles have been developed for colorimetric sensing of Pb2+ ions. The functionalized sensor for colorimetric sensing of Pb2+ exhibited high selectivity in the presence of other interfering metal ions. This sensor offers a fast method for monitoring Pb2+ at a low cost and allows detection of concentrations as low as 16.7 nM. The optimal pH range for Pb2+ detection using TTA–AuNPs was determined to be 5 to 10. The sensor was applied to the analysis of Pb2+ in lake water with recovery ranging from 97.6% to 102%.

Acknowledgements

We gratefully acknowledge the financial support of Ministry of Science and Technology (Taiwan) and National Chiao Tung University.

References

  1. B. P. Lanphear, Science, 1998, 281, 1617–1618 CrossRef CAS.
  2. H. Needleman, Annu. Rev. Med., 2004, 55, 209–222 CrossRef CAS PubMed.
  3. C. R. T. Tarley, F. N. Andrade, F. M. de Oliveira, M. Z. Corazza, L. F. Mendes de Azevedo and M. G. Segatelli, Anal. Chim. Acta, 2011, 703, 145–151 CrossRef CAS PubMed.
  4. A. Michalska, M. Wojciechowski, B. Wagner, E. Bulska and K. Maksymiuk, Anal. Chem., 2006, 78, 5584–5589 CrossRef CAS PubMed.
  5. S. Tang, P. Tong, H. Li, J. Tang and L. Zhang, Biosens. Bioelectron., 2013, 42, 608–611 CrossRef CAS PubMed.
  6. F. Li, L. Yang, M. Chen, P. Li and B. Tang, Analyst, 2013, 138, 461–466 RSC.
  7. M.-C. Daniel and D. Astruc, Chem. Rev., 2004, 104, 293–346 CrossRef CAS PubMed.
  8. C. Burda, X. Chen, R. Narayanan and M. A. El-Sayed, Chem. Rev., 2005, 105, 1025–1102 CrossRef CAS PubMed.
  9. D. Liu, Z. Wang and X. Jiang, Nanoscale, 2011, 3, 1421–1433 RSC.
  10. J. W. Liu and Y. Lu, J. Am. Chem. Soc., 2003, 125, 6642–6643 CrossRef CAS PubMed.
  11. K. Yoosaf, B. I. Ipe, C. H. Suresh and K. G. Thomas, J. Phys. Chem. C, 2007, 111, 12839–12847 CAS.
  12. F. Chai, C. Wang, T. Wang, L. Li and Z. Su, ACS Appl. Mater. Interfaces, 2010, 2, 1466–1470 CAS.
  13. C. Wang, C. Huang, Y. Lin, W. Chen and H. Chang, Anal. Chim. Acta, 2012, 745, 124–130 CrossRef CAS PubMed.
  14. C. H. Chung, J. H. Kim, J. Jung and B. H. Chung, Biosens. Bioelectron., 2013, 41, 827–832 CrossRef CAS PubMed.
  15. Y. Zhang, Y. Leng, L. Miao, J. Xin and A. Wu, Dalton Trans., 2013, 42, 5485–5490 RSC.
  16. D. Su, X. Yang, Q. Xia, F. Chai, C. Wang and F. Qu, RSC Adv., 2013, 3, 24618–24624 RSC.
  17. Y. Chen, I. Lee, Y. Sung and S. Wu, Talanta, 2013, 117, 70–74 CrossRef CAS PubMed.
  18. P. Rajakumar, R. Anandhan, D. Manoj and J. Santhanalakshmi, RSC Adv., 2014, 4, 4413–4419 RSC.
  19. S. Wei, P. Hsu, Y. Lee, Y. Lin and C. Huang, ACS Appl. Mater. Interfaces, 2012, 4, 2652–2658 CAS.
  20. J. Gu, Y. Lin, Y. Chia, H. Lin and S. Huang, Microchim. Acta, 2013, 180, 801–806 CrossRef CAS.
  21. R. Rajendra and N. Ballav, RSC Adv., 2013, 3, 15622–15625 RSC.
  22. D. Garin, F. Oukhatar, A. B. Mahon, A. C. Try, M. Dubois-Dauphin, F. M. Laferia, M. Demeunynck, M. M. Sallanon and S. Chierici, Bioorg. Med. Chem. Lett., 2011, 21, 2203–2206 CrossRef CAS PubMed.
  23. N. Brabez, R. M. Lynch, L. Xu, R. J. Gillies, G. Chassaing, S. Lavielle and V. J. Hruby, J. Med. Chem., 2011, 54, 7375–7384 CrossRef CAS PubMed.

Footnote

Electronic supplementary information (ESI) available: Synthesis of 5-(1,2-dithiolan-3-yl)-N-(prop-2-yn-1-yl)pentanamide and azidoacetic acid, the calibration curve of TTA–AuNPs in water and the calibration curve for the detection of Pb2+ by TTA–AuNPs. See DOI: 10.1039/c4ra02448f

This journal is © The Royal Society of Chemistry 2014
Click here to see how this site uses Cookies. View our privacy policy here.