LiV3O8 nanorods as cathode materials for high-power and long-life rechargeable lithium-ion batteries

Peng Meiab, Xing-Long Wu*ab, Haiming Xieab, Liqun Sunab, Yanping Zengab, Jingping Zhang*a, Linghua Taiab, Xin Guoab, Lina Congab, Shunchao Maab, Cen Yaoab and Rongshun Wang*ab
aInstitute of Functional Materials, Department of Chemistry, Northeast Normal University, Changchun, Jilin 130024, P. R. China. E-mail: xinglong@nenu.edu.cn; jpzhang@nenu.edu.cn; wangrs@nenu.edu.cn
bNational & Local United Engineering Lab for Power Battery, Northeast Normal University, Changchun, Jilin 130024, P. R. China

Received 15th March 2014 , Accepted 13th May 2014

First published on 15th May 2014


Abstract

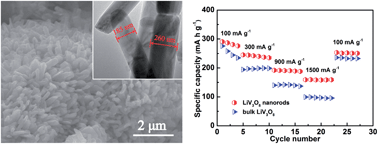
Nowadays one of the principal challenges for the development of lithium-ion batteries (LIBs) is fulfilling the burgeoning demands for high energy and power density with long cycle life. Herein, we demonstrate a two-step route for synthesizing LiV3O8 nanorods with a confined preferential orientation by using VO2(B) nanosheets made in the laboratory as the precursor. The special structures of nanorods endow the LiV3O8 materials with markedly enhanced reversible capacities, high-rate capability and long-term cycling stability as cathodes for lithium storage. The results show that very desirable initial capacities of 161 and 158 mA h g−1 can be achieved for the LiV3O8 nanorods at extremely high rates of 2000 and 3000 mA g−1, with minimal capacity loss of 0.037% and 0.031% per cycle throughout 300 and 500 cycles, respectively. The energetically optimized electron conduction and lithium diffusion kinetics in the electrode process may shed light on the superior electrochemical properties of the LiV3O8 nanorods, primarily benefitting from the small particle size, large surface area and restricted preferential ordering along the (100) plane.

Introduction

In response to the critical needs of modern society and rising ecological concerns, it is urgent to explore alternative, sustainable and eco-friendly sources of energy and power.1,2 As efficient, light-weight, and rechargeable power sources, lithium-ion batteries (LIBs) are considered to be one of the most promising candidates for future energy storage and conversion. Rechargeable LIBs have revolutionized diverse portable electronic devices over the past two decades.3,4 However, it will be much tougher for current state-of-the-art LIBs to play a major role in emerging market opportunities, as applications such as hybrid electric vehicles (HEVs) and electrical vehicles (EV) mostly require high energy and high power density (i.e., the ability to quickly charge and to discharge with high current density). Therefore, electrode materials possessing high reversible Li storage capacity and rapid solid-state lithium-ion and electron transport are indispensable to achieve the increase in energy and power density to meet the increasing needs of energy storage.5–8

Monoclinic lithium trivanadate (LiV3O8) has been widely studied as a cathode material for LIBs due to its advantageous features, such as high specific capacity, good structural stability, low cost and desirable safety.9–18 Theoretically, a LiV3O8 crystalline electrode can accommodate an additional three lithium ions per formula unit without any structural damage, equivalent to a capacity of ca. 280 mA h g−1, which is much higher than that of currently available cathode materials (such as LiCoO2 and LiFePO4). It has been demonstrated that the electrochemical properties of LiV3O8 are strongly dependent on how it is prepared, as well as on its particle size, morphology and crystalline texture.19 In this regard, several methods have been developed to improve the electrochemical performance of LiV3O8 cathode materials, including microwave synthesis,20 sol–gel methods,19 spray drying,21 low-temperature synthesis,22 hydrothermal method,23 ultrasonic preparation,24 etc. Enhanced Li storage capacity and rate performance have been realized by control of the morphology of nanostructured LiV3O8,11,25,26 while the capacity retention and high-rate capability with long cycle life still need to be further improved in practice to satisfy high-power applications.

The exploitation of nanostructures for electrode materials is regarded as one of the most favorable approaches for achieving these goals. Nanomaterials could play a significant role in improving the Li storage capacity and electrode kinetics as well as cyclic stability in a lithium-ion battery system, owing to the short distances for transport of both lithium ions and electrons, and the large surface area, which reduces the overpotential and permits faster reaction kinetics at the electrode surface.6,27–29 Herein, we report a nanorod-structured LiV3O8 with a restricted preferential orientation synthesized through a two-step route using VO2(B) nanosheets made in the laboratory as the precursor. Benefitting from nanometer-size effects, LiV3O8 nanorods have seen greatly enhanced Li storage capacity, enormously improved high-rate performance and impressive long-cycle stability.

Experimental section

Preparation of nanostructured VO2(B) precursor

Nanostructured VO2(B) precursor was first fabricated via a hydrothermal method. Analytically pure V2O5 and C2H2O4·2H2O were used as starting materials. V2O5 powder (2.7282 g) was dissolved in a 100 mL oxalic acid aqueous solution (0.3 mol L−1) under the vigorous stirring (800 rpm) at gentle temperature of 50 °C until a blue solution formed. Subsequently, the resulting solution was transferred to a Teflon-sealed stainless steel autoclave and stored at 180 °C for 24 h in an oven. The precipitate was separated through a high-velocity centrifuge, washed several times with de-ionized water and anhydrous ethanol, and then dried at 70 °C overnight.

Synthesis of LiV3O8 samples

In a typical synthesis, an appropriate amount of the as-obtained VO2(B) precursor was added to a solution of ethanol and lithium hydroxide (the molar ratio of V/Li was 3/1.05) with vigorous stirring for 2 h to obtain a homogeneous mixture. The solvent was then distilled off using a rotary evaporator. The collected powder was then annealed in air at 500 °C for 8 h, and the LiV3O8 nanorods obtained are denoted as n-LVO hereafter. For comparison, bulk LiV3O8 materials (designated as b-LVO) were prepared using a similar procedure, but with commercial VO2 as the precursor.

Characterization

The chemical compositions and crystallographic data of the as-synthesized samples were collected by X-ray powder diffraction (XRD) with a Bruker D8 ADVANCE diffractometer using Cu Kα (λ = 1.5406 Å) radiation. The morphology and microstructure of the as-prepared materials were characterized using a scanning electron microscope (Philips XL 30 and JEOL JSM-6700F Field Emission, 10 kV), a transmission electron microscopy (TEM), and a high-resolution TEM (JEOL-2100 F, 200 kV). The Brunauer–Emmett–Teller (BET) specific surface area of the products was determined by utilizing an ASAP 2020 using the standard N2 adsorption and desorption isotherm measurements at 77 K, after degassing the powder samples at 150 °C for 8 h in vacuum. The electrochemical properties were investigated with CR2025 coin cells assembled in a glove box (Mbraun, Inc.) filled with pure argon gas. The working electrode was fabricated by casting the slurry (70 wt% of active materials, 20 wt% of acetylene black, and 10 wt% of polyvinylidene fluoride (PVDF) binder in N-methyl-2-pyrrolidinone (NMP)) onto an Al foil, and then dried in a vacuum oven at 120 °C for 12 h to remove the solvent. Lithium foil was employed as the counter electrode and 1 M LiPF6 in ethylene carbonate–dimethyl carbonate (EC–DMC) (1/1 by volume) was used as the electrolyte. The charge/discharge performances of the electrodes were evaluated at room temperature using a multichannel battery testing system (LAND CT2001A). The cyclic voltammetry (CV) tests were carried out on a CHI660E electrochemical workstation (Shanghai CHI Instrument Company, China) with lithium foil as both the counter and reference electrode over the potential range of 1.5–4.0 V (vs. Li+/Li) at a scanning rate of 0.5 mV s−1. The electrochemical impedance spectroscopy (EIS) investigation was implemented by a Princeton Applied Research PARSTAT 2273 advanced electrochemical system in the frequency range from 200 kHz to 0.01 Hz with an applied perturbation signal of 5 mV.

Results and discussion

Structural characterization

The chemical composition and phase structure of the as-synthesized VO2(B) precursor were identified via XRD, with the result shown in Fig. 1a. The XRD pattern can be readily assigned to the monoclinic crystal system (space group: C2/m, JCPDS 31-1438). No obvious diffraction peaks of any other impurities were detected in the spectrum, indicative of high phase purity of the precursor. Fig. 1b presents a representative SEM image of as-prepared VO2(B) materials. The SEM observation distinctly shows that the VO2(B) precursor consists of uniformly sheet-like nanoparticles with an average thickness of about 25 nm and several hundreds of nanometers in length. The TEM image shown in Fig. 1c further validates that the VO2(B) nanosheets are typically 50–80 nm wide and 400–600 nm long. Further inspection using high-resolution TEM (HRTEM) (Fig. 1d) reveals the well-resolved lattice fringes with an interplanar distance of 0.578 nm, in accordance with the spacing of the (200) planes of VO2(B). The corresponding Fast Fourier Transform (FFT) pattern (the inset of Fig. 1d) displays a regular diffraction pattern, further affirming the single-crystal nature of these nanosheets.
image file: c4ra02269f-f1.tif
Fig. 1 Characterizations of VO2(B) nanosheets precursor, (a) XRD pattern; (b) SEM image; (c) TEM image; (d) HRTEM image and the corresponding FFT pattern (lower-left inset).

The XRD pattern of the LiV3O8 (n-LVO) fabricated by the VO2(B) precursor is shown in Fig. 2. The main distinct diffraction peaks can be easily ascribed to the known monoclinic LiV3O8 lattice (space group: P21/m, JCPDS 72-1193). The peak located at around 14° belongs to diffraction from the (100) plane, implying the layered-type structure of crystallized LiV3O8. As illustrated in Fig. 3, the crystalline structure of LiV3O8 is comprised of [V3O8] layers formed in the bc plane, and stacked along the a axis. It should be pointed out that the diffraction intensity of crystal plane (100) is obviously lower than that of ([1 with combining macron]11) in the present n-LVO system, which is opposite to that in the standard XRD pattern and common results reported in the literatures.11,15,17,30,31 That further demonstrates the oriented structure of the n-LVO, in accordance with the SEM and TEM observations. It can be rationally inferred that the oriented growth of n-LVO may originate from the one-dimensional character of the VO2(B) precursor, which would restrict the growth from occurring in the 〈100〉 direction in the transition from VO2(B) to LiV3O8 and finally result in the formation of LiV3O8 nanorods. For the LiV3O8 used as cathode materials for LIBs, it has been demonstrated that the reduced dimension of the 〈100〉 direction can effectively shorten the diffusion distance and the time it takes lithium ions to insert into and be extracted out the LiV3O8 crystallites.14,19,32,33 In the XRD pattern of n-LVO, the reduced diffraction intensity from the (100) crystal plane indicates that the dimension of the crystallites along the 〈100〉 direction has been reduced.34 Therefore, it can be deduced that superior electrochemical properties would be achieved for the obtained n-LVO.


image file: c4ra02269f-f2.tif
Fig. 2 XRD pattern of LiV3O8 nanorods.

image file: c4ra02269f-f3.tif
Fig. 3 Projection of the crystalline structure of LiV3O8 along the a axis.

The morphologies of the LiV3O8 samples prepared from different precursors are further compared by SEM images as shown in Fig. 4. The LiV3O8 sample fabricated by using commercial VO2 as the raw material (thereafter abbreviated as b-LVO) is mainly composed of irregular and inhomogeneous spheroids with diameters of about 20–35 μm, as shown in a typical SEM image in Fig. 4c. In addition, these micrometer-sized LiV3O8 particles are highly aggregated, which is unfavorable for the fabrication of a high-performance electrode and the charge/discharge processes. Excitingly, the n-LVO developed presently by using in house-produced VO2(B) nanosheets as the precursor exhibits uniform and evenly rod-like structures 150–300 nm in width and 0.8–1.5 μm in length (Fig. 4a). A proposed mechanism for the formation of n-LVO is presented in Fig. 5. Under hydrothermal conditions, V2O5 powders were reduced by oxalic acid and formed VO2+, which consequently self-assembled into VO2(B) nanosheets. Then the VO2(B) was converted into LiV3O8 after lithiation. Presumably the one-dimensional nature of VO2(B) nanosheets had restricted the growth from occurring in the 〈100〉 direction in the transition process and finally resulted in the formation of a LiV3O8 crystalline structure with a confined preferential orientation. Furthermore, TEM and HRTEM observations are also employed to provide deeper insight into the microstructure of n-LVO. A closer look at the n-LVO in Fig. 4b indicates that the dimensions of the nanorods agree well with that indicated by SEM. The n-LVO partially preserves the shape of self-made VO2(B) precursor, while the dimensions grew larger after lithiation. It could be rationally deduced that the nanorod-like structure of n-LVO was derived from the heat-temperature process (500 °C, 8 h), in which VO2(B) nanosheets would tend to aggregate and pack on each other, as well as the chemical reaction process between VO2 and LiOH, leading to the transition of crystallographic texture. The HRTEM image (inset of Fig. 4b) exhibits relatively defined crystalline lattices with a spacing of 0.180 nm, which is in good agreement with the (020) interplanar distance of monoclinic LiV3O8 (JCPDS 72-1193). A dramatically shortened transport distance for both electrons and lithium ions is anticipated to be attained for n-LVO due to the significantly reduced grain size relative to b-LVO, which would allow full lithium diffusion within a very short period of time, i.e., at high charge/discharge rates.4,7,35,36 Moreover, the drastic decrease in dimensions tends to give rise to a significant increase in specific surface area of n-LVO. Calculated from the N2 adsorption and desorption isotherm (Fig. S2), the Brunauer–Emmett–Teller (BET) specific surface area of n-LVO is 26.593 m2 g−1, while b-LVO shows a dramatically smaller BET specific surface area of 0.1256 m2 g−1. The substantially enlarged specific surface area should not only provide efficient contact of active material with electrolyte and more active sites for lithium diffusion and accommodation, but also considerably reduce overpotential and specific current density of the electrode material, which would promote fast transport of both ions and electrons throughout the electrode matrix.6,27–29 Taking all benefits of nanometer size effects into account, it is reasonable to expect the n-LVO to exhibit superior electrochemical properties over the bulk counterpart, especially high-rate performance when they are applied as cathode materials for rechargeable LIBs.


image file: c4ra02269f-f4.tif
Fig. 4 (a) SEM images of n-LVO; (b) TEM image of n-LVO and its HRTEM image (lower-left inset); (c) SEM image of b-LVO.

image file: c4ra02269f-f5.tif
Fig. 5 Schematic illustration of the preparation of LiV3O8 nanorods.

Electrochemical characterization

To obtain an estimation of the electrochemical behavior of the LiV3O8 samples, cyclic voltammetric experiments were conducted at a scan rate of 0.5 mV s−1 within a voltage interval of 1.5–4.0 V. The CV curves of the tenth cycle are shown in Fig. 6 for n-LVO and b-LVO electrodes. Both CV curves have similar shapes, but differ from each other in the peak location and intensity, i.e., the peak current density. The oxidation and reduction peaks of n-LVO have greater heights and larger areas than those of b-LVO, suggesting that the former will deliver higher Li storage capacities and faster kinetics for insertion and extraction of lithium ions in the electrode.37–40 Furthermore, the voltage separation of n-LVO between the predominant oxidation and reduction peaks (located at around 2.5 V) is found to be eliminated to a large degree compared to that of b-LVO, indicating the deeply optimized electrode kinetics and reversibility of the n-LVO.33,41,42
image file: c4ra02269f-f6.tif
Fig. 6 The tenth cycle CV curves for n-LVO and b-LVO electrodes.

The initial discharge curves of n-LVO and b-LVO electrodes measured at 100 mA g−1 in the range of 1.5–4.0 V (vs. Li+/Li) are illustrated in Fig. 7. As expected, the n-LVO electrode delivers a desirable initial reversible specific capacity of 290.6 mA h g−1, much higher than that of b-LVO (204.6 mA h g−1). In addition, the characteristic multiple discharge plateaus of the former are found to be more easily recognizable than of the latter. The three evident discharge plateaus located at 2.82 V, 2.53 V and 2.27 V, which coincide well with typical lithium-ion intercalation voltages of LiV3O8 crystallites as reported in the literature, can be identified as originating from the single-phase insertion process, the two-phase transformation between Li1+xV3O8 (1 ≤ x ≤ 2) and Li4V3O8, and the slower kinetic insertion process, respectively.13,43,44


image file: c4ra02269f-f7.tif
Fig. 7 First-cycle discharge curves of n-LVO and b-LVO electrodes at 100 mA g−1.

The cycling performances of these LiV3O8 electrodes are further compared at a moderately high current density of 600 mA g−1 (corresponding to the 2C rate, theoretically), with the results shown in Fig. 8. It shows that both the reversible specific capacity (Fig. 8a) and capacity retention (Fig. 8b) of the n-LVO are far superior to those of the b-LVO, which should be attributed to the unique nanorod structure of the former. The n-LVO electrode delivers a desirable initial reversible capacity of 200 mA h g−1 and its capacity stabilizes at around 190 mA h g−1 after 100 cycles, corresponding to as high as 95% of the initial value. In stark contrast, the b-LVO electrode presents a lower initial reversible capacity of 155.4 mA h g−1, and then decays rapidly to 81.2 mA h g−1 after 100 cycles, with a low capacity retention of merely 52%. Most of the LiV3O8 crystalline electrodes reported to date can deliver reversible capacities in the range of 125–180 mA h g−1 at the same rate of 600 mA g−1.17,21,22,26,45–48 Apparently, the as-prepared LiV3O8 nanorods have shown enhanced reversible capacity as well as desirable capacity retention at the moderately high current density of 600 mA g−1.


image file: c4ra02269f-f8.tif
Fig. 8 (a) Cycling performance of n-LVO and b-LVO electrodes at 600 mA g−1, and (b) the corresponding capacity retention plots.

To corroborate the anticipated superior rate performance of our LiV3O8 nanorods, all batteries were galvanostatically charged and discharged at various current densities that increase stepwise from 100 mA g−1 to 1500 mA g−1. The comparative plots of rate performance for the n-LVO and b-LVO electrodes are shown in Fig. 9a. With increasing current density, the reversible capacities of n-LVO decrease slowly from 291 mA h g−1 at 100 mA g−1 to 245 and 200 mA h g−1 at current densities of 300 and 900 mA g−1, respectively. Notably, up to the high rate of 1500 mA g−1, an appreciable reversible capacity of 159 mA h g−1 can still be sustained. However, the reversible capacities of most reported LiV3O8 crystalline electrodes tested at such a high rate are usually fall below about 150 mA h g−1.14,16–18,45,48 Furthermore, the reversible capacity of n-LVO is fairly stable at each rate, manifesting its prominent cycle reversibility and stability. By comparison, the b-LVO presents much lower reversible capacities of 275.8, 194, 140 and 99 mA h g−1 at current densities of 100, 300, 900 and 1500 mA g−1, respectively. It is noticeable that the reversible capacities of b-LVO decrease by a large margin as the rate increases, especially at the high rates of 900 and 1500 mA g−1. Additionally, the charge/discharge curves of n-LVO at different rates are shown in Fig. 9b. The well-defined extraction/insertion plateaus at about 2.5 V become shorter with increasing rate but persist throughout cycling, suggesting that no serious polarization has occurred. The aforementioned results have well substantiated the superior rate capability of the LiV3O8 nanorods over the bulk counterpart.


image file: c4ra02269f-f9.tif
Fig. 9 (a) Rate-performance of n-LVO and b-LVO electrodes at various current densities from 100 to 1500 mA g−1, and (b) discharge/charge curves of n-LVO obtained at each rate.

To the best of our knowledge, in spite of the remarkable capacity of the known LiV3O8 crystalline cathode, long-term cycling performance at high current densities, i.e., those equal or greater than 2000 mA g−1, has rarely been studied. More surprising and dramatic results (as shown in Fig. 10) come from further studies of high-rate capability of the n-LVO over prolonged cycling. It can be observed that the capacity versus cycle number curves obtained at 2000 and 3000 mA g−1 almost superimpose over each other. In other words, the n-LVO shows rather similar electrochemical behaviors at both high rates, and the reversible capacities over the long-term cycling merely decay slightly as the current density increases from 2000 to 3000 mA g−1. The n-LVO can deliver appreciable initial reversible capacities of 161 and 158 mA h g−1 at the high rates of 2000 and 3000 mA g−1, respectively. Furthermore, the reversible capacity cycled at 2000 mA g−1 is still 143 mA h g−1 after 300 cycles, corresponding to a minimal decay rate of 0.037% per cycle. Even after 500 cycles, the reversible capacity at 3000 mA g−1 can still sustain 133 mA h g−1, representing an extremely low capacity fading of 0.031% per cycle. In the meantime, both of the coulombic efficiencies always approach 100% throughout the battery test, demonstrating the superb cycle reversibility of the n-LVO. Minimal capacity loss after so many cycles indicated the very long lifespan of the batteries. The reported Al2O3-coated LiV3O8 can deliver relatively high initial reversible specific capacities at current densities of 2000 and 3000 mA g−1, while its capacity retention falls to 71.3 and 74% after 100 cycles, respectively.17 The hierarchical plate-arrayed LiV3O8 and nanosheet composite both exhibit exceptional capacity retention at 3000 mA g−1, while they deliver initial reversible capacities of less than 110 mA h g−1.46,48 Therefore, such prominent durable high-rate performances reported in our work reveal the potential of the LiV3O8 nanorods as cathodes in high-power and long-life rechargeable LIBs.


image file: c4ra02269f-f10.tif
Fig. 10 High-rate performance of the n-LVO electrode at high current densities of 2000 and 3000 mA g−1 upon long-term cycling.

To better understand the underlying reasons for the superior high-rate capability of our LiV3O8 nanorods, electrochemical impedance spectroscopy (EIS) measurements were carried out for the n-LVO and b-LVO, as illustrated in Fig. 11. The Nyquist plots both display a compressed semicircle in the high to medium frequency range of each spectrum, which describes the charge transfer resistance, and a low frequency tail related to the diffusion of lithium ions in the solid matrix. The impedance spectra can be well elucidated on the basis of the equivalent circuit shown in the insert of Fig. 11a, where the symbols, Re, Rct, CPEdl and Zw, stand for the solution resistance, charge transfer resistance, double layer capacitance and Warburg impedance, respectively. The fitted impedance parameters are listed in Table S1. Excellent correlation can be observed between the simulated curves and experimental data, indicating the accuracy of the circuit model within the experimental error limits. Note that the Re values of both the n-LVO and b-LVO electrodes are nearly identical due to the same electrolyte and fabrication processes. According to the investigations into EIS of LIBs reported by Chen et al.,49 the battery impedance primarily depends upon on cathode impedance, especially charge transfer resistance. In the present work, the simulated Rct value of n-LVO is remarkably less than that of b-LVO, signifying the substantially enhanced electron conduction for n-LVO, which permits a faster charge-transfer reaction for lithium-ion insertion and extraction in the electrode matrix.


image file: c4ra02269f-f11.tif
Fig. 11 (a) Nyquist plots of the n-LVO and b-LVO electrodes. The inset represents the equivalent circuit. (b) Dependence of Zre on the reciprocal square root of the frequency in the low-frequency region.

It is generally accepted that the slanted lines in the low-frequency range of EIS are attributed to the Warburg behavior, which should be associated with the diffusion of lithium ions within the electrode matrix. And the solid-state diffusion of lithium ions in active materials is considered to be the slowest process in lithium ion battery systems.50 The apparent lithium-ion diffusion coefficient (Dapparent) can be estimated by using the following equation:51

 
Dapparent = (R2T2)/(2A2n4F4C2σ2) (1)
where R is the gas constant, T is the absolute temperature, A is the surface area of the electrode, n is the number of electrons per molecule during oxidization, F is the Faraday constant, C is the concentration of lithium ions in the solid, and σ is the Warburg factor relative to Zre or Zim.
 
Zre(or − Zim) ∝ σω−1/2 (2)

On the basis of eqn (2), the Warburg factor σ can be obtained from the linear fit of the data points in the plot between Zre and the reciprocal square root of the angular frequency ω at the Warburg region (as shown in Fig. 11b). The apparent lithium-ion diffusion coefficient of the n-LVO electrode is calculated to be approximately 5.5 fold greater than that of the b-LVO electrode (as listed in Table S2), indicating the faster diffusion of lithium ions in the former. In the case of solid-state diffusion of lithium ions in the electrode matrix, another important parameter is the diffusion time (τeq), which is proportional to the square of the average diffusion length. As previously mentioned, the diffusion length of lithium ions within the n-LVO is dramatically reduced owing to the nanometer size of electrode materials and the restricted preferential orientation of LiV3O8 nanocrystals. It is reasonable to infer that the mean diffusion time of n-LVO should be substantially shortened. Therefore, our LiV3O8 nanorod cathode can promptly absorb and store a vast number of lithium ions within a very short period, which should be energetically favorable for rapid charge and discharge.

Conclusion

In summary, LiV3O8 nanorods with confined preferential orientation have been successfully fabricated via a two-step route employing in house-produced VO2(B) nanosheets as the precursor. Compared to the bulk LiV3O8 material made from commercial VO2, our LiV3O8 nanorods display a much higher Li storage capacity, enhanced capacity retention abilities, significantly improved high-rate performance and greater stability after many cycles. A desirable initial reversible capacity of 200 mA h g−1 can be achieved at a moderately high rate of 600 mA g−1 with high capacity retention of 95% after 100 cycles. Moreover, the LiV3O8 nanorods amazingly present appreciable initial reversible capacities of 161 and 158 mA h g−1 at extremely high current densities of 2000 and 3000 mA g−1, with minimal capacity loss of 0.037% and 0.031% per cycle throughout 300 and 500 cycles, respectively. The superior electrochemical properties of the LiV3O8 nanorods can be mainly ascribed to the energetically optimized electron conduction and lithium diffusion kinetics in the electrode process due to the nanoscale grain size, large specific surface area and restricted preferential ordering along the (100) plane. The results obtained in our work reveal the potential of our LiV3O8 nanorods as cathode materials for high-power and long-lifespan LIBs.

Acknowledgements

This work was supported by National High Technology Research and Development Program of China (SS2012AA110301, 2013AA110103), and the Fundamental Research Funds for the Central Universities (No. 14QNJJ014).

Notes and references

  1. J. Maier, Nat. Mater., 2005, 4, 805–815 CrossRef.
  2. M. Winter and R. J. Brodd, Chem. Rev., 2004, 104, 4245–4270 CrossRef.
  3. V. Etacheri, R. Marom, R. Elazari, G. Salitra and D. Aurbach, Energy Environ. Sci., 2011, 4, 3243 Search PubMed.
  4. P. G. Bruce, B. Scrosati and J. M. Tarascon, Angew. Chem., Int. Ed., 2008, 47, 2930–2946 CrossRef PubMed.
  5. K. Kang, Y. S. Meng, J. Bréger, C. P. Grey and G. Ceder, Science, 2006, 311, 977–980 CrossRef PubMed.
  6. Y.-G. Guo, J.-S. Hu and L.-J. Wan, Adv. Mater., 2008, 20, 2878–2887 CrossRef.
  7. X.-L. Wu, L.-Y. Jiang, F.-F. Cao, Y.-G. Guo and L.-J. Wan, Adv. Mater., 2009, 21, 2710–2714 CrossRef.
  8. Y. G. Guo, Y. S. Hu, W. Sigle and J. Maier, Adv. Mater., 2007, 19, 2087–2091 CrossRef.
  9. M. Winter, J. O. Besenhard, M. E. Spahr and P. Novák, Adv. Mater., 1998, 10, 725–763 CrossRef.
  10. L. Jiao, L. Liu, J. Sun, L. Yang, Y. Zhang, H. Yuan, Y. Wang and X. Zhou, J. Phys. Chem. C, 2008, 112, 18249–18254 Search PubMed.
  11. H. Liu, Y. Wang, K. Wang, Y. Wang and H. Zhou, J. Power Sources, 2009, 192, 668–673 CrossRef PubMed.
  12. A. Pan, J. Liu, J.-G. Zhang, G. Cao, W. Xu, Z. Nie, X. Jie, D. Choi, B. W. Arey, C. Wang and S. Liang, J. Mater. Chem., 2011, 21, 1153 RSC.
  13. H. Liu, Y. Wang, W. Yang and H. Zhou, Electrochim. Acta, 2011, 56, 1392–1398 CrossRef PubMed.
  14. H. Wang, Y. Ren, Y. Wang, W. Wang and S. Liu, CrystEngComm, 2012, 14, 2831 RSC.
  15. X. Xu, Y.-Z. Luo, L.-Q. Mai, Y.-L. Zhao, Q.-Y. An, L. Xu, F. Hu, L. Zhang and Q.-J. Zhang, NPG Asia Mater., 2012, 4, e20 CrossRef.
  16. R. Mo, Y. Du, N. Zhang, D. Rooney and K. Sun, Chem. Commun., 2013, 49, 9143–9145 RSC.
  17. S. Huang, J. P. Tu, X. M. Jian, Y. Lu, S. J. Shi, X. Y. Zhao, T. Q. Wang, X. L. Wang and C. D. Gu, J. Power Sources, 2014, 245, 698–705 CrossRef PubMed.
  18. Y. Liu, X. Zhou and Y. Guo, Electrochim. Acta, 2009, 54, 3184–3190 CrossRef PubMed.
  19. S. Sarkar, H. Banda and S. Mitra, Electrochim. Acta, 2013, 99, 242–252 CrossRef PubMed.
  20. G. Yang, G. Wang and W. Hou, J. Phys. Chem. B, 2005, 109, 11186–11196 CrossRef PubMed.
  21. N. Tran, K. G. Bramnik, H. Hibst, J. Prölß, N. Mronga, M. Holzapfel, W. Scheifele and P. Novák, J. Electrochem. Soc., 2008, 155, A384–A389 CrossRef CAS PubMed.
  22. Y. Feng, F. Hou and Y. Li, J. Power Sources, 2009, 192, 708–713 CrossRef CAS PubMed.
  23. H. Y. Xu, H. Wang, Z. Q. Song, Y. W. Wang, H. Yan and M. Yoshimura, Electrochim. Acta, 2004, 49, 349–353 CrossRef CAS PubMed.
  24. Y. Liu, X. Zhou and Y. Guo, J. Power Sources, 2008, 184, 303–307 CrossRef CAS PubMed.
  25. A. Pan, J.-G. Zhang, G. Cao, S. Liang, C. Wang, Z. Nie, B. W. Arey, W. Xu, D. Liu, J. Xiao, G. Li and J. Liu, J. Mater. Chem., 2011, 21, 10077 RSC.
  26. J. Liu, W. Liu, Y. Wan, S. Ji, J. Wang and Y. Zhou, RSC Adv., 2012, 2, 10470 RSC.
  27. A. S. Arico, P. Bruce, B. Scrosati, J.-M. Tarascon and W. van Schalkwijk, Nat. Mater., 2005, 4, 366–377 CrossRef CAS PubMed.
  28. Y. Wang and G. Cao, Adv. Mater., 2008, 20, 2251–2269 CrossRef CAS.
  29. M. G. Kim and J. Cho, Adv. Funct. Mater., 2009, 19, 1497–1514 CrossRef CAS.
  30. L. A. de Picciotto, K. T. Adendorff, D. C. Liles and M. M. Thackeray, Solid State Ionics, 1993, 62, 297–307 CrossRef CAS.
  31. Y. Gu, D. Chen, X. Jiao and F. Liu, J. Mater. Chem., 2006, 16, 4361–4366 RSC.
  32. L. Jiao, H. Li, H. Yuan and Y. Wang, Mater. Lett., 2008, 62, 3937–3939 CrossRef CAS PubMed.
  33. J. Sun, L. Jiao, H. Yuan, L. Liu, X. Wei, Y. Miao, L. Yang and Y. Wang, J. Alloys Compd., 2009, 472, 363–366 CrossRef CAS PubMed.
  34. K. West, B. Zachau-Christiansen, S. Skaarup, Y. Saidi, J. Barker, I. I. Olsen, R. Pynenburg and R. Koksbang, J. Electrochem. Soc., 1996, 143, 820–825 CrossRef CAS PubMed.
  35. M. Okubo, E. Hosono, J. Kim, M. Enomoto, N. Kojima, T. Kudo, H. Zhou and I. Honma, J. Am. Chem. Soc., 2007, 129, 7444–7452 CrossRef CAS PubMed.
  36. J. Chen and F. Cheng, Acc. Chem. Res., 2009, 42, 713–723 CrossRef CAS PubMed.
  37. C. Q. Feng, L. F. Huang, Z. P. Guo, J. Z. Wang and H. K. Liu, J. Power Sources, 2007, 174, 548–551 CrossRef CAS PubMed.
  38. Y. Liu, X. Zhou and Y. Guo, Mater. Chem. Phys., 2009, 114, 915–919 CrossRef CAS PubMed.
  39. G. Pistoia, M. Pasquali, G. Wang and L. Li, J. Electrochem. Soc., 1990, 137, 2365–2370 CrossRef CAS PubMed.
  40. M. Zhao, L. Jiao, H. Yuan, Y. Feng and M. Zhang, Solid State Ionics, 2007, 178, 387–391 CrossRef CAS PubMed.
  41. L. Liu, L. Jiao, J. Sun, M. Zhao, Y. Zhang, H. Yuan and Y. Wang, Solid State Ionics, 2008, 178, 1756–1761 CrossRef CAS PubMed.
  42. X.-L. Wu, Y.-G. Guo, J. Su, J.-W. Xiong, Y.-L. Zhang and L.-J. Wan, Adv. Energy Mater., 2013, 3, 1155–1160 CrossRef CAS.
  43. H. Guo, L. Liu, Q. Wei, H. Shu, X. Yang, Z. Yang, M. Zhou, J. Tan, Z. Yan and X. Wang, Electrochim. Acta, 2013, 94, 113–123 CrossRef CAS PubMed.
  44. L. Liu, F. Tian, X. Wang, Z. Yang and X. Wang, Ionics, 2012, 19, 9–15 CrossRef.
  45. S. Huang, X. L. Wang, Y. Lu, X. M. Jian, X. Y. Zhao, H. Tang, J. B. Cai, C. D. Gu and J. P. Tu, J. Alloys Compd., 2014, 584, 41–46 CrossRef CAS PubMed.
  46. S. Huang, Y. Lu, T. Q. Wang, C. D. Gu, X. L. Wang and J. P. Tu, J. Power Sources, 2013, 235, 256–264 CrossRef CAS PubMed.
  47. H.-L. Zhang, J. R. Neilson and D. E. Morse, J. Phys. Chem. C, 2010, 114, 19550–19555 CAS.
  48. N. H. Idris, M. M. Rahman, J.-Z. Wang, Z.-X. Chen and H.-K. Liu, Compos. Sci. Technol., 2011, 71, 343–349 CrossRef CAS PubMed.
  49. C. H. Chen, J. Liu and K. Amine, J. Power Sources, 2001, 96, 321–328 CrossRef CAS.
  50. S. Lee, Y. Cho, H. K. Song, K. T. Lee and J. Cho, Angew. Chem., Int. Ed., 2012, 51, 8748–8752 CrossRef CAS PubMed.
  51. C. J. Wen, C. Ho, B. A. Boukamp, I. D. Raistrick, W. Weppner and R. A. Huggins, Int. Mater. Rev., 1981, 26, 253–268 CrossRef CAS PubMed.

Footnote

Electronic supplementary information (ESI) available: The additional figures and tables. See DOI: 10.1039/c4ra02269f

This journal is © The Royal Society of Chemistry 2014
Click here to see how this site uses Cookies. View our privacy policy here.