The tribological behaviour and tribochemical study of B–N type borate esters in rapeseed oil—compound versus salt

J. C. Yanabc, X. Q. Zengc, E. van der Heidec, T. H. Ren*ab and Y. D. Zhaod
aSchool of Chemistry and Chemical Engineering, Key Laboratory for Thin Film and Microfabrication, Shanghai Jiao Tong University, China. E-mail: thren@sjtu.edu.cn; Tel: +86 21 5474 7118
bState Key Laboratory of Solid Lubrication, Lanzhou Institute of Chemical Physics, Chinese Academy of Science, China
cLaboratory for Surface Technology and Tribology, University of Twente, The Netherlands
dBeijing Synchrotron Radiation Facility, Institute of High Energy Physics, Chinese Academy of Sciences, Beijing, China

Received 15th March 2014 , Accepted 29th April 2014

First published on 30th April 2014


Abstract

Two novel borate ester additives, (2-(2-(bis(2-hydroxyethyl)amino)ethoxy)-1,3,2-dioxaborolan-4-yl)methyl oleate and a tris(2-hydroxyethyl)amine salt of (2-hydroxy-1,3,2-dioxaborolan-4-yl)methyl oleate were prepared and used as anti-wear and extreme pressure agents in rapeseed oil. The tribological performance was evaluated using a four-ball machine. The results show that the additives possess high anti-wear and extreme pressure properties. XANES, XPS and AFM were used to analyse the composition and structure of boundary films at the worn surfaces. The results for the compound and salt of borate esters are compared, and it is shown that the boundary films formed by compound or salt are similar and mainly composed of B2O3.

1. Introduction

Lubricant additives containing phosphorus, sulphur and chloride are used to enhance the anti-wear (AW) and extreme pressure (EP) properties of base oil in industrial applications.1 In consideration of environment protection, the lubricant industry has increasingly focused on the selection of eco-friendly additives in recent years. Lubricants of ashless, no chlorines, no smell, no corrosion and low phosphorus have attracted more and more attention because of the environmental legislation and health care.2,3

Boron-containing esters are recognized as “green” additives and have received extensive attention because of the good AW performance, low toxicity, and pleasant odour.4 But the application of borate esters are limited because they are susceptible to hydrolysis which can result in insolubility or precipitate in oil.5,6 Several studies focused on the introduction of nitrogen to the additive molecules mainly because the lone pair electrons in nitrogen can stabilize the electron-deficient boron element. Moreover, B–N synergistic effect on tribological performance was found in some cases, but the mechanism has not been well understood.7–10 In our previous work, the tribological performances of two borate esters with and without N were investigated and the results also show the B–N synergistic effect on the tirbological performance in rapeseed oil.11 In this work, the influence of the bonding type between the N-containing component and borate ester on the tribological performance is to be studied, in which one is covalently bonded together (compound), and the other is in the form of salt. Biodegradable additives are attractive due to the potential application in biomedical related lubrication. Fatty acid esters are known to be the main composition of vegetable oil and proved to be biodegradable. Therefore, glycerol monooleate (GMO) has already widely used as lubricant and surfactant in biomedical applications and cosmetics.12,13 The additives used in this work are designed by combining the borate ester with GMO. Together with the base oil, i.e. rapeseed oil in this work, which is a kind of vegetable oil, the designed lubricant is expected to be biodegradable.

Surface analysis after rubbing is typically selected and regarded as an effective method to explore the friction process because the tribochemical reactions cannot be easily detected in situ. Atomic force microscope (AFM) can be used to evaluate the morphology of the worn surface.14 X-ray photoelectron spectroscopy (XPS) has been used to analyse the chemical composition of the worn surface.15 Recently, X-ray absorption near edge structure spectroscopy (XANES) is recognized as a non-destructive method for the surface and can be used to investigate the chemical composition of boundary films generated in tribological contacts.16,17 Studies on XANES analysis of boundary films generated in tribo-contacts lubricated with borate esters indicate the presence of B2O3, BPO4 and BN in boundary films.18

In this work, two novel borate esters were designed, prepared and used as anti-wear agents in rapeseed oil. The tribological performance of the additives was evaluated using a four-ball machine. XANES, XPS and AFM were used to analyse the composition and structure of boundary films at the worn surfaces.

2. Experimental

2.1 Preparation of the additives

The chemicals and solvents were purchased from Shanghai Chemical Reagents, Shanghai, China and were used without purification. A commercial rapeseed oil (referred to rapeseed oil), provided by Grease Factory of China, Lanzhou, China was used as the lubricating oil without any further treatment. The main chemical constituents of the rapeseed oil are as follows: 7.46 wt% of saturated fatty acids, 64.06 wt% of monounsaturated fatty acid and 28.48 wt% of total polyunsaturated fatty acid.

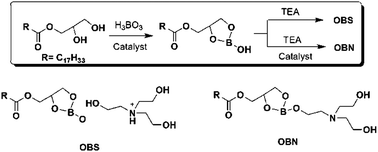
For the design of the additives, vicinal diol group in GMO and nitrogen were introduced to the borate esters, see Fig. 1, with the aim to improve the oil-solubility and hydrolytic stability of borate esters in rapeseed oil. The oxygen and nitrogen elements can be helpful for stabilizing the molecules and the long chain which is symbolised by R group in the image was designed to increase the oil-solubility.


image file: c4ra02267j-f1.tif
Fig. 1 The design of the novel borate ester.

Specifically, tris(2-hydroxyethyl)amine (TEA) salt of (2-hydroxy-1,3,2-dioxaborolan-4-yl)methyl oleate (OBS) and (2-(2-(bis(2-hydroxyethyl)amino)ethoxy)-1,3,2-dioxaborolan-4-yl)methyl oleate (OBN) were prepared according to ref. 11. The preparation as well as the codes of the borate esters is schematically depicted in Fig. 2 and the procedure was described as follow. The commercial GMO is a mixture of 60 wt% 2,3-dihydroxypropyl oleate, 20 wt% 3-hydroxypropane-1,2-diyl dioleate and 20 wt% propane-1,2,3-triyl trioleate, therefore GMO used in the preparation is calculated based on the hydroxyl groups. In a 500 mL of round bottomed flask, 54.2 g (0.1 mol) of GMO, 6.2 g (0.1 mol) of boric acid and some catalyst were added to a solvent then the solution was heated to 110 °C. As the reaction proceeded, water were generated and removed. The solution reflux for 2 h till the reaction terminated and then 10.1 g (0.1 mol) of tris(2-hydroxyethyl)amine was added. The solution was washed with water and the solvent was evaporated, and at last produced 61.2 g of OBS. When the solution was treated with similar dehydration procedure as described before 59.8 g of OBN was obtained. All of the compounds were characterized by infra-red spectroscopy, NMR and elemental analysis. Then boron content of OBS and OBN is 1.97 wt% and 1.52 wt%, respectively. The nitrogen content of OBS and OBN is 2.62 wt% and 2.07 wt%, respectively. The additives are both mixture, therefore OBS and OBN are only schematically shown as the main content.


image file: c4ra02267j-f2.tif
Fig. 2 The preparation, structure and scheme of the additives.

2.2 Evaluation of oil-solubility and hydrolytic stability

The oil solubility and hydrolytic stability of the borate esters were evaluated by the standard method presented in ref. 7 and was tested as follows. Oil-solubility: the additives were mixed with rapeseed oil at a fixed concentration and the solution was stirred at 50 °C until the additives were completely dissolved. Then the solution was sealed and allowed to stand for several days. If there is not any solid precipitating in the solution, it is regarded as soluble in the base stock. Hydrolytic stability (accelerated hydrolysis method by wet heating treatment): 150 g oil sample (0.5 wt% additive in base stock) was added into a 200 mL beaker and then placed in a hot and humid oven (temperature at 50 ± 2 °C, relative humidity more than 95%). The sample was monitored every hour; the time was recorded. If precipitation was observed in the sample or the sample was no longer transparent, it means that the additives have been hydrolysed.

2.3 Tribological test

The friction-reducing and anti-wear capacities of the additives were evaluated on a MRS-1J four ball machine. An optical microscope was used to measure the wear scar diameters (WSD) and the friction coefficients were automatically calculated from the friction signal and recorded. The experimental deviation was obtained by three times of the tests. Chinese national standard GB3142-82 similar to ASTM D-2783 is adopted for the tests. As such, a velocity of 1450 rpm was applied for 30 min at room temperature. The balls used for the experiments have a diameter of 12.7 mm which are made of AISI 52100 bearing steel. The balls are hardened to 59–61 HRC.

2.4 XANES and XPS analysis of the worn surfaces

The samples used for XANES and XPS analysis were washed ultrasonically with petroleum ether and dried before the detection. XANES analysis was performed at the Beijing Synchrotron Radiation Facility (BSRF), situated at the 2.2 GeV storage ring, Beijing Electron Positron Collider (BEPC), Beijing, China. Boron K-edge spectra were collected separately on the double-crystal monochromator (DCM) covering an energy of 185–200 eV. The photo-adsorption spectra were collected with total electron yield (TEY) modes of detection, to provide chemical information on the bulk of the reaction film. XPS analysis was conducted with a PHI-5702 multifunctional X-ray electron spectrometer at the Lanzhou Institute of Chemical Physics, Lanzhou, China. The Mg Kα radiation was used as the excitation source with pass energy of 29.4 eV with a resolution of ±0.3 eV. The binding energy of C1s (284.6 eV) was used as the reference. The morphology of the wear scar was characterized by the SII Nanonavi E-Sweep scanning probe microscope.

3. Experimental results and discussions

3.1 Oil-solubility and hydrolytic stability

The results of oil-solubility and hydrolytic stability of the lubricants (0.5 wt% additives in rapeseed oil) are listed in Table 1. It can be seen from the results that the additives can be dissolved very well in rapeseed oil. The oil-solubility of the additives is much better than that of the commercial trimethyl borate (TB). 6.0 wt% OBN can be dissolved in rapeseed oil, and for OBS, 4.0 wt% of it can be dissolved. As described in Section 2.1, the main constituents of rapeseed oil are fatty acids, which are polar compounds. Meanwhile, from Fig. 2, it can be seen that there are polar groups like ester groups and hydroxyl groups in OBN and OBS, resulting in good solubility in rapeseed oil. Comparing the molecular structure of OBS and OBN, it is found that there are ionic bonds in OBS while OBN only contains covalent bonds, leading to the higher polarity of OBS than OBN. The similarity principal indicates that a solute will dissolve best in a solvent that has a similar polarity to itself. Therefore, the higher solubility of OBN indicates it is more similar in polarity to rapeseed oil than that of OBS.
Table 1 Oil solubility and hydrolytic stability of the additives
Additives Oil-solubility Hydrolytic stability (hour)
TB 0.5 wt% 0.5
OBN 6.0 wt% 71
OBS 4.0 wt% 65


For the hydrolytic stability, OBN and OBS both show good results. This is mainly because the oxygen and nitrogen can be helpful for stabilizing the deficient B element in the molecules. The fact that hydrolytic stability of OBN is slightly better than that of OBS may be because on the one hand the covalent bonds in OBN (intra molecular) are shorter than the ionic bonds in OBS (inter molecular). The shorter the bonds are, the stronger the forces are. Therefore, the forces in OBN are stronger than those in OBS, and then the higher hydrolytic stability of OBN was obtained. On the other hand, in OBN the nitrogen can form five or six member ring intra-molecularly which is proved to be stable.7

3.2 The EP properties

The EP properties of the additives in the rapeseed oil were evaluated by the maximum non-seizure load (PB value). The PB values of the base oil (rapeseed oil), 2.0 wt% OBN and 2.0 wt% OBS in base stock are shown in Fig. 3. The results show that the PB value of both OBN and OBS are higher than that of the base stock, indicating that they can serve as EP agent. Meanwhile, the PB value of OBS is higher than that of OBN, showing that OBS has high EP performance. As is discussed in Section 3.1, the polarity of OBS is stronger than that of OBN. Considering of the short duration (ten seconds) of EP test the additive with stronger polarity will be adsorbed faster and more easily. Therefore, OBS can form the adsorption films faster, and then the better EP performance is achieved.
image file: c4ra02267j-f3.tif
Fig. 3 PB values of the additives (2.0 wt% additive in rapeseed oil, four-ball machine, rotation velocity of 1760 rpm for 10 s).

3.3 AW properties of the borate additives

The variation of wear scar diameter (WSD) with the concentration of the additives in rapeseed oil at 294 N is shown in Fig. 4. It can be seen that OBN can improve the anti-wear property of base oil and OBS is better at the same concentration than that of OBN. Associating with the elemental analysis, 1.97 wt% of B and 2.62 wt% of N are in OBS, while the content of B and N in OBN are 1.52 wt% and 2.07 wt%. The higher content of active elements (B and N) may generate better tribochemical reaction film on the surface. Moreover, since the polarity of OBS is stronger than that of OBN, OBS can be adsorbed on the metal surface faster and the adsorption film can be easily formed. Therefore, the better anti-wear performance of OBS than OBN can be attributed to the formation of better adsorption film and tribochemical reaction film. In addition, from the curve it can be found that when 0.5 wt% of OBS was added in the base stock, the WSD is almost the same as that of the base oil. This may be due to the competitive adsorption of the additive molecule and the rapeseed oil. When the concentration of OBS is only 0.5 wt%, the main adsorption films on the metal surface are the oil molecules, therefore the AW property is almost the same as that of the base oil. When 1.0 wt% of OBS is added, the WSD decreased fast and this means the additive adsorbed on the surface to form the tribofilm during the rubbing process. When more additive is added, there is an optimum concentration for the additive. This may be due to the equilibrium or saturated concentration for the additive on the surface. The same phenomenon can also be seen in the case of OBN.
image file: c4ra02267j-f4.tif
Fig. 4 Effect of the concentration of additives on wear scar diameter (four-ball machine, 294 N, rotation velocity of 1450 rpm for 30 min).

The curves in Fig. 5 depict the AW properties of 2.0 wt% additives in rapeseed oil at different applied loads. Compared with the WSD of rapeseed oil, the WSD of OBN and OBS reduce significantly, which demonstrates that they can improve the AW performance of base oil for the 98–490 N load range. With the increasing of normal load, the WSD increases. This may be because that on the one hand, with the increasing of normal load, the film thickness formed between the contact area decreases, resulting in the increasing of direct contact of asperities, and then WSD increases. On the other hand, the increase of WSD may also be attributed to the increased surface roughening and wear debris.19 It is worth mentioning that the WSD of OBS is smaller than that of OBN at the applied load 196–392 N, this may be due to the relatively stronger polarity of OBS than that of OBN. While when the applied load is 490 N, the WSD of OBS is bigger than that of OBN. For OBS, the anion part of the molecule can be adsorbed onto the metal surface, while the whole molecule of OBN can be adsorbed on the surface by the hydroxyl groups. Therefore, the effective adsorption chain in OBN is longer than that of OBS, and then the adsorption film formed by OBN is thicker than that of OBS. It can be concluded that at low load, the AW performance is more dependent on the adsorption capacity, while at high load, it is more dependent on the film thickness.


image file: c4ra02267j-f5.tif
Fig. 5 Effect of the applied load on wear scar diameter (four-ball machine, additive concentration of 2.0 wt%, rotation velocity of 1450 rpm for 30 min).

3.4 Friction-reducing properties of the borate additives

The coefficient of friction (COF) of 2.0 wt% additives with different concentrations at the load of 294 N is shown in Fig. 6. The COF is higher than that of the base oil when 0.5 wt% of OBS is added and the COF is almost the same as that of the oil when the concentration is 1.0 wt%. For OBN, also no friction-reducing property can be found at low concentration. While above the concentration of 1.0 wt% both of the COF decreases due to the addition of the additives in the base oil. When the concentration is too low, the content of active elements on the surface is also low, and the additive and the oil form competitive adsorption film with less compactness. Therefore, the poor friction-reducing performance at low concentration can be ascribed to the competitive adsorption. Generally the decrease in coefficient of friction can be attributed to the formation of adsorption film and/or reaction film by the additive on the rubbing surface.20 Therefore, the lower COF at high concentration may be explained by the strong tribofilm in the system. The effective chain in the OBN molecule is longer than that of OBS. Therefore the COF of OBN is higher than that of OBS, and this may be attributed to that the film formed by OBN is thicker than that of OBS.
image file: c4ra02267j-f6.tif
Fig. 6 Effect of the concentration of additives on coefficient of friction (four-ball machine, 294 N, rotation velocity of 1450 rpm for 30 min).

The COF of 2.0 wt% additives in rapeseed oil with different applied load is shown in Fig. 7. The performance of the base oil was also evaluated at the same condition for comparison. It can be seen that the base fluid doped with OBN and OBS shows good and stable friction-reducing properties under applied load 98–490 N. Since the additives can form tribofilms on the rubbing surface, the COF reduces with the addition of the additives. OBN performs better than OBS can also be explained by the fact that the effective adsorption film of OBN is thicker than that of OBS. For OBN and OBS, the COF decreases with the increase of normal load. This may be due to the fact that as the normal load increases frictional heat generates at the contact surface and hence strength of materials decreases.21


image file: c4ra02267j-f7.tif
Fig. 7 Effect of the applied load on coefficient of friction (four-ball machine, additive concentration of 2.0 wt%, rotation velocity of 1450 rpm for 30 min).

3.5 Surface analysis by XPS

In this work, XPS spectra of the elements in the worn surface were recorded to determine the chemical state of the elements and examine possible film forming mechanisms based on the known composition of the additives in base oil. The binding energy of some standard compounds containing Fe, O, B and N are listed in Table 2 for comparison, which were obtained from NIST XPS Database.22
Table 2 Binding energy of some standard compounds containing Fe, O, B, and N
  Compounds Binding energy (eV)
Oxide of ferrum Fe2O3 Fe2p(713.1); O1s(529.8)
Fe3O4 Fe2p(709.4); O1s(529.7)
FeO Fe2p(709.6); O1s(530.1)
Boride FexBy Fe2p(707.0); B1s(188.0)
B2O3 B1s(192.0); O1s(532.6)
BN B1s(190.8); N1s(397.9)


The XPS spectra of 2.0 wt% OBN in rapeseed oil are shown in Fig. 8. The fitting is performed by the software XPS PEAK and origin 7.5. It is shown that the binding energy of Fe2p is located at 709.1 eV, 709.8 eV, 713.1 eV and 716.2 eV respectively. For the four values of binding energy, Fe2O3, and other ferrous oxides are identified after contrasted with the standard spectra of the elements. As for oxygen, the binding energy of O1s is founded to be at 529.4 eV, 531.4 eV, and 535.1 eV, which can be attributed to B2O3 and ferrous oxides. The binding energy of B1s which is located at 191.7 eV corresponds to B2O3, and this suggests that the borate ester was degraded and reacted with oxygen. In case of N element, the binding energy of N1s is 399.1 eV which is deduced as N-containing organics on the surface.11 For the binding energies of Fe2p and O1s, the XPS signals are intense, but the signals are very weak for the binding energies of B1s and N1s. This is mainly because the contents of Fe and O are much higher than those of B and N.


image file: c4ra02267j-f8.tif
Fig. 8 XPS spectra of 2.0 wt% OBN in rapeseed oil.

The detailed XPS spectra information of OBS is shown in Fig. 9. The binding energies of Fe2p are located at 707.4 eV, 709.1 eV, 711.3 eV, and 714.5 eV which suggests the existence of FexBy, Fe2O3, and other ferrous oxides according to the standard spectra of the elements. As for oxygen, the binding energies are founded to be at 529.9 eV, 532.3 eV, and 535.4 eV, which can be attributed to B2O3 and ferrous oxides. The binding energy of B1s and N1s located at 192.0 eV and 399.2 eV are attributed to B2O3 and N-containing organics respectively.


image file: c4ra02267j-f9.tif
Fig. 9 XPS spectra of 2.0 wt% OBS in rapeseed oil.

From the XPS spectrum of OBN and OBS, it can be seen that the boundary films formed by OBN and OBS are similar. Associating with the tribological test results, OBN reveals better performance in reducing friction, while OBS can be found to be more effective in reducing wear. This is can be concluded that OBN and OBS can both form some oxides films on the rubbing surface, i.e. both the compound and salt can work well in rapeseed oil.

3.6 Surface analysis by XANES

Boron K-edge XANES spectra can give detailed information about the chemical state of boron in the film or on the surface. The B K-edge XANES (TEY) of tribofilms generated from OBN in rapeseed oil are shown in Fig. 10 and the model compounds are also depicted in the bottom of the figure which can match well with the reported results.18,23 Fig. 11 shows the B K-edge XANES spectra of OBS. The peak positions of each spectrum and model compounds are listed in Table 3. It can be seen from the figures that the tribofilm generated by OBN is mainly composed of the model compound B2O3. When 2.0 wt% and 3.0 wt% OBN were added, a little h-BN can be found but the peaks are very weak. From the XANES spectra of OBS, it can be seen the films are composed of B2O3. The same situation can be found that the peaks increase with the addition of more additives. This may be because more molecules can react with oxygen on the surface. Associating these results with tribological data, the conclusion can be drawn that the tribofilms generated from OBN and OBS are similar and are mainly composed of B2O3. The good anti-wear and friction-reducing properties can be attributed to the formation of B2O3.24 The result can also match well with the XPS analyses.
image file: c4ra02267j-f10.tif
Fig. 10 B K-edge XANES spectra of the tribofilms of OBN.

image file: c4ra02267j-f11.tif
Fig. 11 B K-edge XANES spectra of the tribofilms of OBS.
Table 3 Peak positions of the B K-edge (TEY) spectra of tribofilms generated from additives
B K-edge (eV)
Peak a b c d e
Sample
0.5 wt% OBN   194.2      
1.0 wt% OBN   194.1      
2.0 wt% OBN 192.2 194.0 198.1 198.6  
3.0 wt% OBN 192.3 194.1     204.5
0.5 wt% OBS   194.1      
1.0 wt% OBS   194.1      
2.0 wt% OBS   194.2      
3.0 wt% OBS   194.3      
 
Compounds
h-BN 192.4   198.1 198.7 204.6
c-BN15   195.0   198.4 205.1
B2O3   194.0      
Na2B4O7   194.0   198.5  
NaBO3   194.0      


3.7 The morphology of the worn surface

Fig. 12 shows AFM images of the worn surfaces. It can be seen from the AFM images that the surfaces for 2.0 wt% OBN and OBS are smoother than that of base oil, i.e. the cracks and furrows on the surface of OBN and OBS are smoother than that of the rapeseed oil. This suggests that the boundary films of the OBN and OBS could effectively prevent the rubbing surface from direct contact, while the films of rapeseed oil might have poor strength and can be easily destroyed by pressure and mechanical force.
image file: c4ra02267j-f12.tif
Fig. 12 AFM morphology of the worn surfaces (four-ball tester, load 294 N, velocity 1450 rpm, duration 30 min). (a) Rapeseed oil, (b) 2.0 wt% OBN in rapeseed oil and (c) 2.0 wt% OBS in rapeseed oil.

4. Conclusions

(1) Two B–N type novel borate esters were readily prepared and served as anti-wear additives in rapeseed oil. Both additives show good oil-solubility and hydrolytic stability.

(2) The EP and AW properties of the additives are better than those of rapeseed oil. The performance of OBS is better than that of OBN may be due to the higher concentration of B and N and the higher polarity of OBS. The AW property can also be seen from AFM morphologies. The friction-reducing property of OBN is better than that of OBS. This may be due to the longer chain in OBN.

(3) From the results of XPS and XANES analyses, it can be concluded that the tribofilms formed by OBN and OBS are similar and mainly composed of B2O3 and other oxides. The good anti-wear and friction-reducing properties of the additives can be attributed to the formation of B2O3 and other boundary films.

Acknowledgements

The authors are grateful to the National Natural Science Foundation of China (Grant no. 21272157), Foundation of State Key Laboratory of Solid Lubrication, Lanzhou Institute of Chemical Physics (Grant no. 1205) and Marie Curie CIG (Grant no. PCIG10-GA-2011-303922) for the financial support. We gratefully thank Beijing Synchrotron Radiation Facility for the XANES analysis.

Notes and references

  1. C. Betton, in Chemistry and technology of lubricants, Springer, 2010, pp. 435–457 Search PubMed.
  2. L. O. Farng and L. Rudnick, Ashless Antiwear and extreme pressure additives, CRC Press, Boca Raton, FL, 2003 Search PubMed.
  3. A. Papay, Lubr. Sci., 1998, 10, 209–224 CrossRef CAS.
  4. J. Li, X. Xu, Y. Wang and T. Ren, Tribol. Int., 2010, 43, 1048–1053 CrossRef CAS PubMed.
  5. Y. Wang, J. Li and T. Ren, Proc. Inst. Mech. Eng., Part J, 2007, 221, 553–559 CrossRef CAS.
  6. Y. Wang, J. Li and T. Ren, Tribol. Trans., 2008, 51, 160–165 CrossRef CAS.
  7. Z. Zheng, G. Shen, Y. Wan, L. Cao, X. Xu, Q. Yue and T. Sun, Wear, 1998, 222, 135–144 CrossRef CAS.
  8. J. Yao, Tribol. Int., 1997, 30, 387–389 CrossRef CAS.
  9. K. Stanulov, H. Harhara and G. Cholakov, Tribol. Int., 1998, 31, 257–263 CrossRef CAS.
  10. G. Shen, Z. Zheng, Y. Wan, X. Xu, L. Cao, Q. Yue, T. Sun and A. Liu, Wear, 2000, 246, 55–58 CrossRef CAS.
  11. J. Yan, X. Zeng, E. van der Heide and T. Ren, Tribol. Int., 2014, 71, 149–157 CrossRef CAS PubMed.
  12. K. A. Shah, M. D. Joshi and V. B. Patravale, J. Biomed. Nanotechnol., 2009, 5, 396–400 CrossRef CAS PubMed.
  13. H. Zhang and M. W. Grinstaff, J. Am. Chem. Soc., 2013, 135, 6806–6809 CrossRef CAS PubMed.
  14. B. Bhushan, J. N. Israelachvili and U. Landman, Nature, 1995, 374, 607–616 CrossRef CAS.
  15. Z. Zhang, E. Yamaguchi, M. Kasrai and G. Bancroft, Tribol. Trans., 2004, 47, 527–536 CrossRef CAS.
  16. M. Najman, M. Kasrai and G. Bancroft, Tribol. Lett., 2003, 14, 225–235 CrossRef CAS.
  17. M. Najman, M. Kasrai and G. Bancroft, Wear, 2004, 257, 32–40 CrossRef CAS.
  18. K. Varlot, M. Kasrai, G. Bancroft, E. Yamaguchi, P. Ryason and J. Igarashi, Wear, 2001, 249, 1029–1035 CrossRef CAS.
  19. H. Ji, M. A. Nicholls, P. R. Norton, M. Kasrai, T. W. Capehart, T. A. Perry and Y. T. Cheng, Wear, 2005, 258, 789–799 CrossRef CAS PubMed.
  20. S. Aoki, A. Suzuki and M. Masuko, Proc. Inst. Mech. Eng., Part J, 2006, 220, 343–351 CrossRef CAS.
  21. H. D. Fridman and P. Levesque, J. Appl. Phys., 2004, 30, 1572–1575 CrossRef PubMed.
  22. C. Wagner, C. J. Powell, J. Allison and J. Rumble, Retrieved from NIST Standard Reference Data Program website, http://www.nist.gov/srd, 1997.
  23. M. Kasrai, M. E. Fleet, S. Muthupari, D. Li and G. Bancroft, Phys. Chem. Miner., 1998, 25, 268–272 CrossRef CAS.
  24. W. Liu, C. Ye, Q. Gong, H. Wang and P. Wang, Tribol. Lett., 2002, 13, 81–85 CrossRef CAS.

Footnote

Electronic supplementary information (ESI) available. See DOI: 10.1039/c4ra02267j

This journal is © The Royal Society of Chemistry 2014