Biomass-derived three-dimensional porous N-doped carbonaceous aerogel for efficient supercapacitor electrodes†
Yumei Rena,
Jianmin Zhanga,
Qun Xu*a,
Zhimin Chena,
Daoyuan Yanga,
Bo Wanga and
Zheng Jiang*ab
aCollege of Materials Science and Engineering, Zhengzhou University, Zhengzhou 450052, China. E-mail: qunxu@zzu.edu.cn; Fax: +86 371 67767827; Tel: +86 371 67767827
bEnergy Technology Group, Faculty of Engineering and the Environment, University of Southampton, Southampton, SO17 1BJ, UK. E-mail: z.jiang@soton.ox.ac.uk; Tel: +44 (0)23 80594893
First published on 5th May 2014
Abstract
Functionalized carbonaceous materials with a hierarchical structure and developed porosity are highly desired in energy storage and conversion fields. In this work, a facile and scalable hydrothermal methodology was established to synthesise three-dimensional (3D) N-doped carbonaceous aerogels using biomass-based starting materials and polypyrrole as the N-source. The effect of different calcination temperatures on the structural properties, type and content of N-species and electrochemical performance of the 3D N-doped carbonaceous aerogels was revealed. Because of the combinatorial effect of the appropriate N content and porous structure, the obtained samples exhibited excellent electrochemical performance, in particular, an outstanding specific capacitance of 281.0 F g−1 achieved for the sample calcined at 600 °C. This methodology offers a new fabrication strategy to prepare nanoscale carbonaceous materials with desirable morphology and a hierarchical architecture with great potential for applications in energy fields.
Introduction
The development of electrochemical systems with high power and energy densities for sustainable energy storage has been regarded as one of the critical solutions to resolve global concerns of fossil fuel depletion and environmental deterioration.1,2 Among various advanced electrical energy storage systems, supercapacitors have attracted tremendous interest as energy storage devices due to their higher power density and longer cycle life than batteries and conventional capacitors.3–5 If high-quality electrodes can be fabricated, supercapacitors would be an attractive alternative or a supplement to batteries in a variety of applications, especially for mobile electrical systems that require high power densities and a fast transient response.Carbon-based materials are extensively used as supercapacitor electrodes because of their environmental friendliness, low cost and excellent physicochemical properties, such as fine electrical conductivity, long cycle lifetime and intrinsic stability.4,6–11 Among diverse carbon materials, nanoscale carbons with a three-dimensional (3D) porous architecture is more plausible for high specific capacitance due to their high specific surface area and developed porosity, which provide a continuous electron pathway to facilitate ion transport by shortening diffusion pathways and ensuring excellent electrical contact.12–16 To date, porous carbons are usually prepared via template-directed syntheses using either a hard or soft template.13,17 More recently, great effort has been focused to prepare novel porous carbonaceous materials through the hydrothermal carbonization (HTC) of biomass, a low-cost and naturally abundant sustainable carbon resource.18–22 Such HTC synthesised carbonaceous materials may inherit the monolithic architecture of the original biomass or take special morphologies such as nanospheres and nanofibers. Despite such porous carbons possessing a large surface area, a tunable pore structure, good mechanical stability and conductivity, their surfaces are either hydrophobic or lack specific active sites, thus limiting their widespread practical applications.23,24
Heteroatom doping represents an effective strategy to tune the intrinsic surface properties of the carbonaceous electrode with regards energy conversion and storage.25–27 Various non-metal elements, including N, S and P, have been successfully doped into porous carbon materials with enhanced energy storage,28 while N is a more plausible dopant owing to its unique electronic properties originating from the conjugation of lone-pair electrons of N and graphitic π-bonds.11,26,29,30 In addition, the substituted N that partially replaces C atoms and destroys carbon frameworks would create more active sites and defects with enhanced electron density and electron-donating properties.31–33 Usually, N-doping in carbon materials can be realized directly using nitrogen-containing precursors or by the post-treatment of synthetic porous carbons.4,31,34–36 The post-treatment methodologies often induce only surface functionalization.34,35 The N-precursor route can preserve N at a relatively high concentration and homogeneously incorporate N into bulk carbon materials in a simple preparation procedure.33,36,37 More importantly, the doped N in the carbon network can persist under harsh working conditions.11,38 N-enriched conducting polymers are often adopted to prepare porous carbon electrodes to enhance their electrochemical performance.11,39 The carbonization of N-containing aromatic polymer materials such as polyacrylonitrile (PAN),35,40 polypyrrole (PPy),10,24,41 polyaniline (PANI),41 melamine resin42 has been considered an efficient strategy to prepare N-containing carbon nanomaterials. Among the precursors used for N-doped carbons, PPy stands out for its high nitrogen content and carbon yield.10,43
Here we report a facile HTC process for the synthesis of 3D N-doped porous carbonaceous aerogels, in which the hydrothermal carbonization of watermelon was conducted prior to nitriding it using a PPy precursor, which served as N-source and a supplementary carbon source. In this work, PPy was prepared by the hydrothermal process with the aid of FeCl3 as the oxidant, which is simple and convenient. The methodology manifested a facile route to tailor the surface areas and pore structures of the obtained products. The dependence of the electrodes' supercapacity, N species and content on the annealing temperature was thoroughly investigated.
Experimental
Materials
All the chemicals were analytical grade used without further purification. Pyrrole (C4H5N, MW: 67.09), iron(III) chloride anhydrous (FeCl3, purity: ≧99%), potassium hydroxide (KOH, purity: ≧85%), dehydrated alcohol (CH3CH2OH, purity: ≧99.7%), deionized water and watermelon as the carbon resource.Preparation of carbonaceous hydrogels and aerogels
The carbonaceous hydrogel (CG) was directly prepared by a simple hydrothermal process from the soft tissue biomass of watermelon. Watermelon was first cut into the appropriate volume and then put into the corresponding Teflon-lined stainless steel autoclave. The autoclave was heated to 180 °C for 12 h. The obtained carbonaceous hydrogel monoliths were washed by deionized water and dehydrated alcohol (the volume ratio is 1![[thin space (1/6-em)]](https://www.rsc.org/images/entities/char_2009.gif) :1) to remove the soluble impurities. Then, the corresponding carbonaceous aerogel (CA) was obtained by freeze-drying at −42 °C for 2 hours, followed by drying at 60 °C for 12 hours.
:1) to remove the soluble impurities. Then, the corresponding carbonaceous aerogel (CA) was obtained by freeze-drying at −42 °C for 2 hours, followed by drying at 60 °C for 12 hours.
Preparation of N-doped carbonaceous aerogel composite materials
All the chemicals were analytical grade reagents used as received without further purification. The N-doped carbonaceous aerogel composite materials were synthesized under hydrothermal conditions. Polypyrrole (PPy) was prepared with the aid of FeCl3 as the oxidant. In a typical procedure, the mass ratio of CA and pyrrole is 1:1, the mole ratio of pyrrole and ferric chloride hexahydrate is 1:1. First, pyrrole was added dropwise to the CA merged in the solution of FeCl3 and then the mixture was sonicated several minutes before being transferred into a Teflon-lined stainless steel autoclave (the ratio volume of solution/volume of autoclave is 0.6). The autoclave was sealed and maintained at 120 °C for 12 h. After the reaction was completed, the autoclave was allowed to cool to room temperature. The obtained sample was filtered, washed with deionized water and dehydrated alcohol to remove impurities and excess ions and dried in air at 60 °C for 24 h. To obtain the N-doped carbon materials, the dry gels were calcined at 600, 800 and 1000 °C for 1 hour in N2 atmosphere with a ramp heating rate of 3 °C min−1. The obtained samples were designated as N–CA-T, where T represents the carbonization temperature.
Characterization
The morphologies of the obtained structures were characterized by field-emission scanning electron microscopy (FE-SEM, JSM7500F) and transmission electron microscopy (TEM) (JEM-2100). X-ray diffraction (XRD) patterns of samples were measured on a Y-2000 X-ray diffractometer with copper Kα radiation (λ = 1.5406 Å) operating at 40 kV and 40 mA. Raman measurements were carried out on a Renishaw Microscope System RM2000 equipped with a 50 mW Ar+ laser at 514.5 nm. Fourier transform infrared spectra (FTIR) were recorded on a TENSOR 27 FTIR spectrometer (Bruker) in the absorption mode with a resolution of 2 cm−1 to identify the surface functional groups of the carbonaceous gels. N2 adsorption isotherms were obtained at 77 K using a Micromeritics ASAP 2020 system. The samples were degassed at 300 °C for 10 h before measurements. Specific surface areas and pore size distributions of the electrode materials were calculated by the Brunauer–Emmett–Teller (BET) method. X-ray photoelectron spectra (XPS, XR5 gun, 500 μm) were collected using Al Kα radiation operated at 150 W and 15 kV. The full survey was taken at a pass energy of 100 eV with a scan rate of 1 eV s−1.Electrochemical measurement
A three-electrode configuration was used to measure cyclic voltammetry, constant current charge–discharge behavior and electrochemical impedance spectroscopy. CV, EIS and chronopotentiometry experiments were performed on a CHI 660D electrochemical workstation at room temperature. The working electrode was prepared by mixing 80 wt% N–CA-T composite material, 10 wt% polytetrafluoroethylene (PTFE, used as a binder, PTFE 60 wt% dispersion in H2O, Sigma Aldrich) and 10 wt% carbon black. The mixture was spread and pressed onto a nickel foam (1 cm × 1 cm). After the electrode materials were loaded, the working electrode was pressed and dried in vacuum at 80 °C for 12 h. The above loaded nickel foam was used as a working electrode in a three-electrode system using Pt foil and Ag/AgCl as auxiliary and reference electrodes, respectively. The electrolyte used in all of the measurements was a 6 M KOH solution. The potential range for CV tests was −1.0 to 0 V, and the scan rate was 5, 10, 20, 50 and 100 mV s−1. Galvanostatic charge–discharge measurements were made from −1.0 to 0 V with different current densities at 0.2, 0.5, 1, 2, 4 and 6 A g−1. Electrochemical impedance spectroscopy (EIS) measurements were carried out in a frequency range of 0.01 Hz to 100 kHz with an AC amplitude of 5 mV.The specific capacitances obtained from the CV curves are calculated by the equation C = (ΔS)/(υmu), where C is the specific capacitance (F g−1), ΔS is the area of the CV curves, u is the potential window (V), υ is the scan rate (mV s−1) and m is the mass of the sample used for the electrochemical test (g) excluding the binder and conductive carbon black. The specific capacitance of the electrode material was calculated from the discharge curve according to C = IΔt/(ΔVm), where I is the discharge current (A), Δt is the discharge time (s), ΔV is the voltage change (V) excluding the IR drop in the discharge process and m is the mass of the electrode material (g) excluding the binder and conductive carbon black.
Results and discussions
The experimental sketch of our hydrothermal carbonization (HTC) combined with the PPy nitriding process is illustrated in Scheme 1, in which sugar-based (containing glucose, fructose and cane sugar) watermelon was used as a renewable carbon starting material, and PPy was introduced via the hydrothermal polymerisation of pyrrole. At the initial synthesis stage, a mild one-step hydrothermal carbonization of watermelon soft tissues was applied to generate a monolithic carbonaceous aerogel (CA). This process comprised a series of reactions, involving dehydration, polymerization to polyfurans and carbonization via further intermolecular dehydration. In the second stage, pyrrole was added onto the obtained CA and then put into a solution containing FeCl3 oxidant in a Teflon-lined stainless steel autoclave for hydrothermal polymerization. The collected PPy@CA was further calcined at varying temperatures to obtain an N-doped 3D biomass-based porous carbonaceous aerogel. | ||
| Scheme 1 Schematic strategy for the fabrication of an N-doped 3D biomass-based porous carbonaceous aerogel. | ||
Fig. 1(a) and (b) show a sponge-like monolithic carbonaceous hydrogel (CG) and a carbonaceous aerogel (CA) obtained through hydrothermal carbonization without and with freeze-drying, respectively. Scanning electron microscopy (SEM) and transmission electron microscopy (TEM) were used to observe the architecture of CA and CA-based composite materials. SEM images reveal that the obtained CA consists of a carbon nanofiber network cross-linked with carbon nanospheres constituting a 3D porous structure (Fig. 1(c)). After further hydrothermal treatment of CA with pyrrole and subsequent freeze-drying (Fig. 1(d)), the CA was covered with sheet-like PPy generated from the in situ polymerization of pyrrole. It was reported that hydrogen bonding, electrostatic interactions and π–π bonding between PPy and CA may provide the strong cross-linking sites in the network.27,44 Meanwhile, the polymerization of excess Py along a normal 3D porous structure leads to the partial aggregation of PPy. PPy@CA was calcined at different temperatures to study the influence of nitriding parameters. Fig. 1(e) shows the SEM image of N–CA-600, where the PPy scales have completely vanished as compared to the morphology of uncalcined PPy@CA (Fig. 1(c)). It can be easily concluded that PPy was introduced into the C network by thermal treatment and the C network was nitrided (see XPS section). SEM images of N–CA-800 and N–CA-1000 are also shown in Fig. S1a and b.† The TEM image of N–CA-600, as shown in Fig. 1(f), reveals its loosely packed porous architecture.
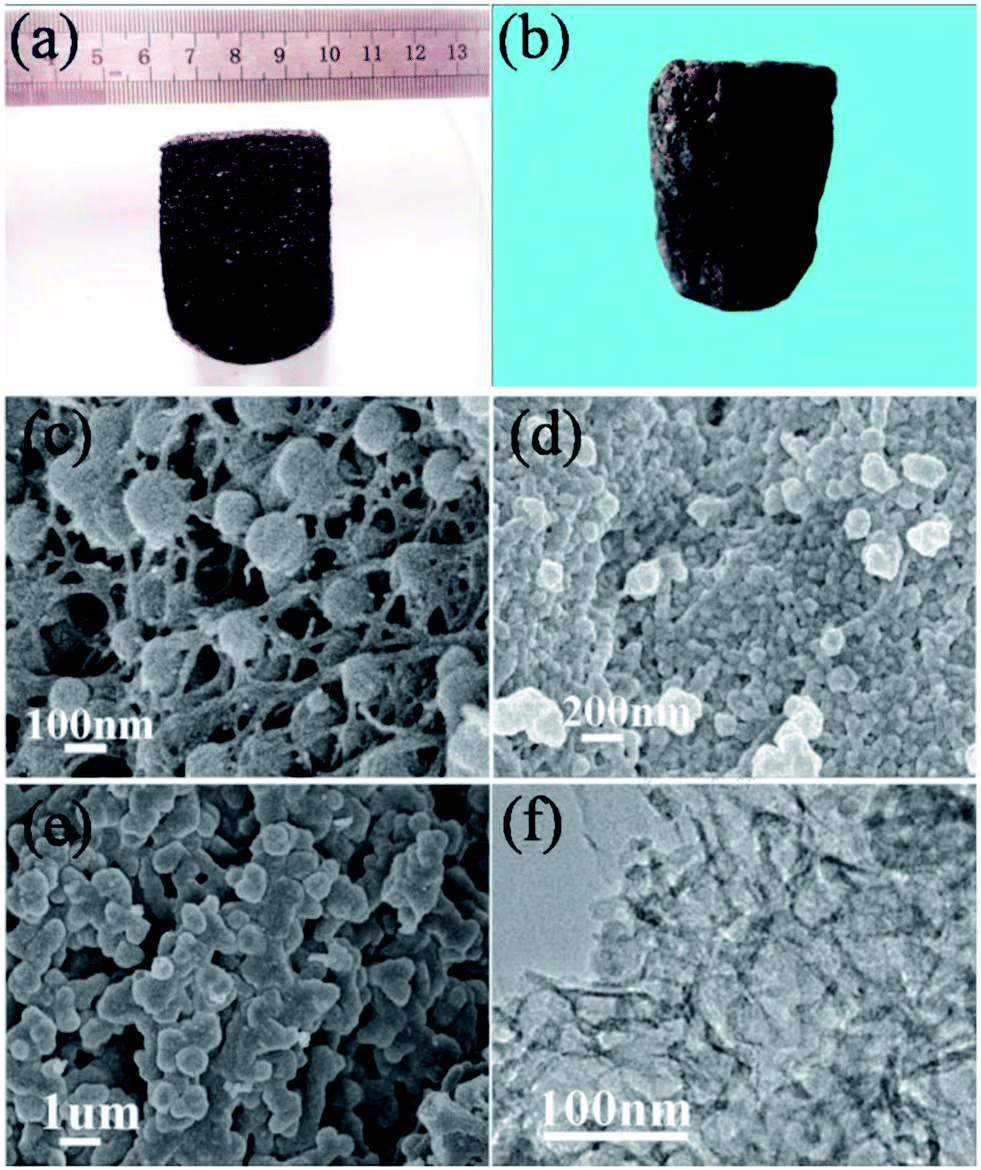 | ||
| Fig. 1 Photographs of a monolithic carbonaceous hydrogel (a) and aerogel (b); SEM images of a carbonaceous aerogel (c), PPy@CA (d) and N–CA-600 (e). TEM images of carbonized PPy@CA at 600 °C (f). | ||
Fig. 2(a) shows the Raman spectra of CA, PPy@CA and N–CA-600 samples. A distinct D band (∼1358 cm−1) and G band (∼1580 cm−1) are observed in the Raman spectrum of CA. The D band can be assigned to defects in the structure, while the G band corresponds to the vibration of sp2 hybridized carbon.11,45 The intensity ratio of the D and G bands (ID/IG) has been widely accepted as a good index for reflecting the extent of structural disorder.11,44 The calculated ID/IG ratio for CA is 0.3097, suggesting that it was highly graphitized. The PPy@CA nanocomposite shows a much stronger Raman spectrum and larger ID/IG ratio than those of CA, suggesting that the presence of PPy exerted a significant influence on CA. In addition, in PPy@CA, the strong characteristic bands at ∼1358 cm−1 and ∼1580 cm−1 are also attributed to the ring stretching mode and the C![[double bond, length as m-dash]](https://www.rsc.org/images/entities/char_e001.gif) C backbone stretching of PPy, respectively.46,47 The Raman spectrum of the N–CA-600 nanocomposite shows a relatively stronger D-band, revealing that it contains a lower degree of graphitic carbon and a significant amount of disordered sections or defects. The Raman spectra of PPy@CA as plotted in Fig. 2(b) show that elevating the calcination temperature from 600 to 1000 °C results in a reduced Raman intensity of D and G bands. However, the ID/IG ratio for the samples calcined at 600, 800 and 1000 °C is 0.9176, 0.9645 and 0.9681, respectively. The increase of ID/IG ratios with rising temperature suggests that the temperature is vital to the carbonization of the composite materials. Raman spectroscopy cannot detail the surface bonding information of the surface functional groups in the composite, which can be characterised by FTIR.
C backbone stretching of PPy, respectively.46,47 The Raman spectrum of the N–CA-600 nanocomposite shows a relatively stronger D-band, revealing that it contains a lower degree of graphitic carbon and a significant amount of disordered sections or defects. The Raman spectra of PPy@CA as plotted in Fig. 2(b) show that elevating the calcination temperature from 600 to 1000 °C results in a reduced Raman intensity of D and G bands. However, the ID/IG ratio for the samples calcined at 600, 800 and 1000 °C is 0.9176, 0.9645 and 0.9681, respectively. The increase of ID/IG ratios with rising temperature suggests that the temperature is vital to the carbonization of the composite materials. Raman spectroscopy cannot detail the surface bonding information of the surface functional groups in the composite, which can be characterised by FTIR.
 | ||
| Fig. 2 Raman spectra of a carbonaceous aerogel, PPy@CA and N–CA-600 (a) and N–CA-T (b); FTIR spectra (c) and (d) XRD pattern of N–CA-T (T = 600, 800, 1000 °C). | ||
Fourier transform infrared spectrometry (FTIR) was used to identify surface functional groups of the N-doped carbonaceous aerogel composite materials. As shown in Fig. 2(c), the peaks at ca. 3413 cm−1 can be assigned to the N–H symmetric stretching vibration. The existence of N-containing bonds is further confirmed by vibration appearing at ca. 1396 cm−1.26,48 The vibration around 1619 cm−1 can be attributed to N–H in-plane deformation vibrations or CC stretching vibration, indicating the presence of aromatic rings or the coexistence of N–H and CC species.29,43 The characteristic absorption band of the C–C stretching or breathing vibration of the pyrrole ring at 1108 cm−1 is distinct.29,43 Additionally, the peaks at 990 and 618 cm−1 are ascribed to the deformation vibration of vinyl C–H and C–H plane bending vibration, respectively. It is worth noting that increasing the carbonization temperature of PPy@CA did not significantly alter the band positions but raised its intensity with respect to CA (Fig. S2†). The presence of PPy was further confirmed by XRD characterization. Fig. 2(d) shows the XRD patterns of the N-doped carbonaceous aerogel N–CA-T composites, where two distinguished peaks due to PPy in the region of 10.7° and 44.6° are observed, in comparison with that of CA (Fig. S3†).
To identify the chemical species in the functionalized N–CA-T (T = 600, 800, 1000 °C), XPS measurement was carried out and presented in Fig. 3. Remarkable C 1s, N 1s and O 1s peaks are observed in the XPS survey spectra (Fig. 3(a), (c) and (e)), revealing the N species have been introduced into the biomass-derived CA after hydrothermal polymerization and thermal post-treatments with the PPy precursor. More importantly, the N 1s spectra reveal calcination amended the surface nitrogen species on the surfaces of PPy@CA composites. The high-resolution N 1s spectrum (Fig. 3(b)) of N–CA-600 evidences the presence of pyridinic-N (N-6, 397.9 eV) and pyrrolic-N (N-5, 400.0 eV).12 The N 1s spectrum (Fig. 3(d)) for N–CA-800, fitted to dual peaks, shows that the N-6 (397.9 eV) and N-5 (400.5 eV) peaks are blue-shifted, suggesting increased bonding strength. However, their intensity decreases remarkably in comparison with that of N–CA-600, suggesting that the concentration of such species was reduced at an elevated annealing temperature. After calcination at 1000 °C, the XPS peaks of N-6 and N-5 species almost disappear, suggesting that pyridinic and pyrrole groups are thermally unstable;4,31 however, two new peaks (Fig. 3(f)) appear at 401.0 and 403.4 eV, attributable to quaternary-N (N–Q) and N-oxides (N–X) in the pyridine-N group, respectively.25,34,49 The results demonstrate that the N atoms within the pentagonal ring of PPy are partly converted into N-6, N-5, N–Q or N–X during the carbonization process.11,41 Therefore, the thermal carbonization of PPy@CA represents a good nitriding method to introduce and tune surface N-functional groups, where N-6 bonds with two C atoms at the edges and contributes one p electron to the π system.32 N-5 refers to N atoms that contribute two p electrons to the π system (inset in Fig. 3(b)), and N–Q refers to N atoms that substitute for C atoms in the hexagonal ring. Apart from these three common nitrogen types, there are N–X bonds in which N is bonded with two C atoms and one oxygen atom (inset in Fig. 3(f)). N–X is observed in the FTIR of N–graphene, N–carbon nanotubes and N–carbon nanofibers.4,11,24,50
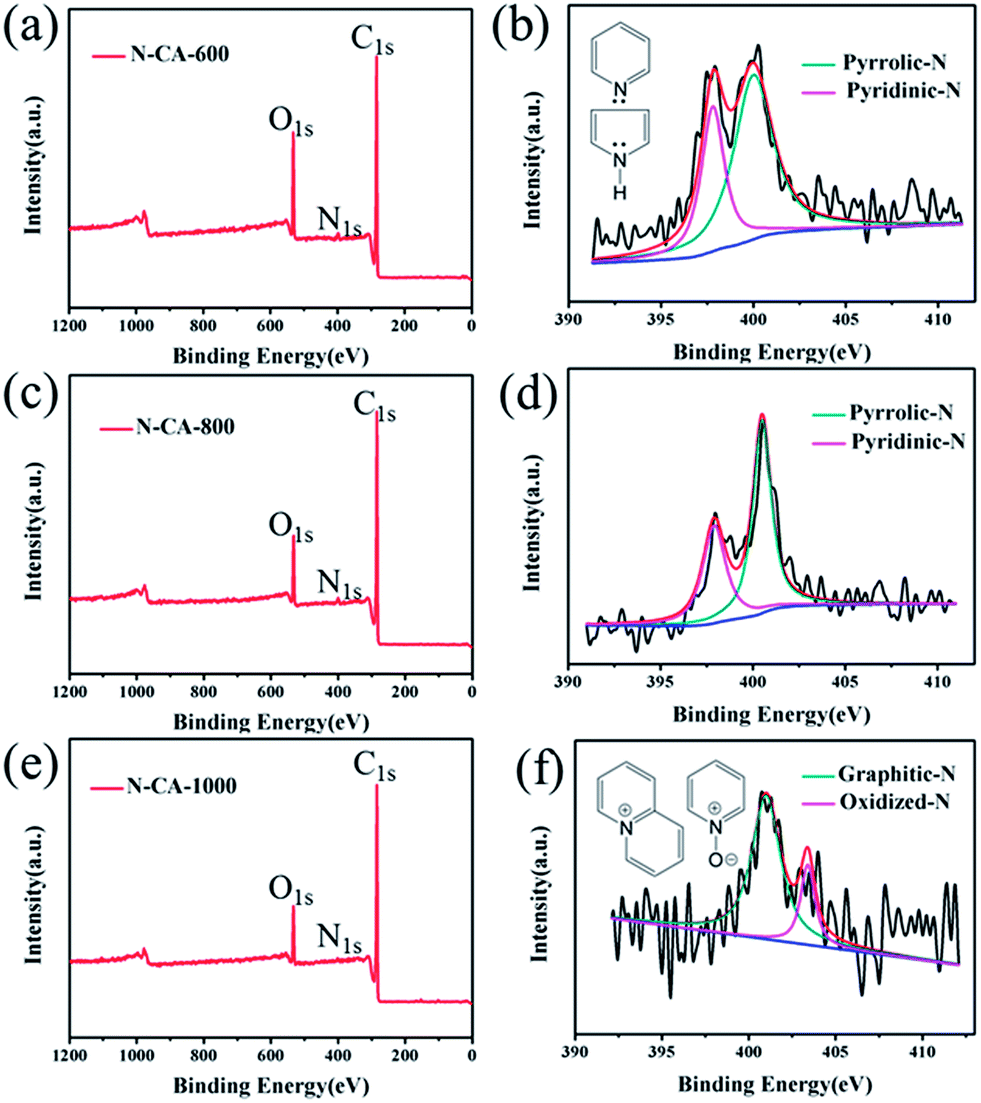 | ||
| Fig. 3 XPS survey scan of the N-doped carbonaceous aerogel composite materials: (a) N–CA-600, (c) N–CA-800, (e) N–CA-1000. High-resolution N1s peaks of (b) N–CA-600, (d) N–CA-800, (f) N–CA-1000. | ||
Table 1 summarises the surface atomic concentrations of C, O and N calculated from the peak areas of corresponding XPS spectra. The nitrogen content of N–CA-T samples (T = 600, 800, 1000 °C) are 2.12, 1.04 and 0.98 at%, respectively. The nitrogen content in the materials decreases significantly at elevated calcination temperatures, which is in agreement with FTIR results. The low doping level is mainly associated with a high annealing temperature, which accelerates the decomposition of N-containing frameworks and breaks the C–N bonds to release bonded N. It also implies that insufficient defects were created in the carbon network because doped N atoms create structural defects in the carbon material and give rise to more active sites.23,31,32,51 XPS results demonstrate that the calcination temperature is a critical factor in determining the relative concentrations of nitrogen species and carbon. Moreover, the accessible N-containing species would provide chemically active sites and facilitate the power density of supercapacitors since N atoms in heterocyclic rings may influence the spin density and charge distribution of neighbouring C atoms and then activate the carbon.11,31,51
| Samples | Physical Properties | Chemical properties | ||||||
|---|---|---|---|---|---|---|---|---|
| SBET (m2 g−1) | Smicro (m2 g−1) | Vtot (cm3 g−1) | Vmicro (cm3 g−1) | Pore size (nm) | N (at.%) | C (at.%) | O (at.%) | |
| N–CA-600 | 158.3 | 83.8 | 0.118 | 0.039 | 2.99 | 2.12 | 82.43 | 15.45 |
| N–CA-800 | 330.4 | 185.7 | 0.227 | 0.086 | 2.75 | 1.04 | 87.27 | 11.7 |
| N–CA-1000 | 305.8 | 160.4 | 0.210 | 0.074 | 2.75 | 0.98 | 89.27 | 9.74 |
N2 adsorption–desorption measurements were performed to determine the porosity of the N-doped 3D carbonaceous aerogel composites. The textural properties of these materials are summarized in Table 1. As listed in Table 1, the surface area (SBET) of the aerogels increases from 158.3 to 330.4 m2 g−1 as the calcination temperature is elevated from 600 to 800 °C but decreases to 305.8 m2 g−1 at 1000 °C. As shown in Fig. 4(a), the N-doped aerogels display II/IV type bimodal isotherm profiles with strong adsorption at low relative pressure, suggesting that micro-, meso- and macropores coexist in the materials.23,31,51 Such a hierarchical nanoporous architecture is highly desirable for energy storage and conversion because it allows fast ion diffusion by shortening the diffusion pathways, where macroporous frameworks may serve as ion-buffering reservoirs, mesoporous walls as ion highways for fast ion transmission and microporous textures for charge accommodation.12,21,38 Fig. 4(b) shows the Barrett–Joyner–Halenda (BJH) pore size distribution profiles derived from desorption branches. The sharp peaks centering at 3.7 nm are observed in all three N-doped carbon aerogels (inset of Fig. 4(b)), revealing that mesopores are dominant in the aerogels. The N2 adsorption–desorption characterisation results reveal that the carbonization temperature determines the pore structure of the resulting samples.
 | ||
| Fig. 4 Nitrogen adsorption–desorption isotherms (a), BJH desorption pore-size distribution (b) of N–CA-T (T = 600, 800, 1000 °C). Inset shows the magnified 0.5–4.5 nm region. | ||
Cyclic voltammetry (CV) and galvanostatic charge–discharge in a 6 M KOH aqueous solution are employed to investigate the electrochemical performance of the samples within the potential window between −1.0 and 0 V. The electrochemical performance of CA-600 and N–CA-600 is comparatively shown in Fig. 5. It can be seen from Fig. 5(a) that CA-600 exhibits a small rectangular CV curve corresponding to low capacitances, whereas N–CA-600 possesses a nearly rectangular capacitive CV profile with a few humps due to the combination of electric double-layer capacitance and pseudocapacitance. Fig. 5(b) compares the charge/discharge behaviour of the CA-600 and N–CA-600 electrodes. The discharging time of N–CA-600 was obviously longer than that of CA-600, indicating that N–CA-600 has a much larger capacitance. The doping by N provides the superior electrochemical performance of N–CA-600 compared with CA-600, since the doped N atoms could induce pseudocapacitive behaviour, enhance surface compatibility with the aqueous electrolyte and ensure the complete utilization of the exposed surface for charge storage.12,52
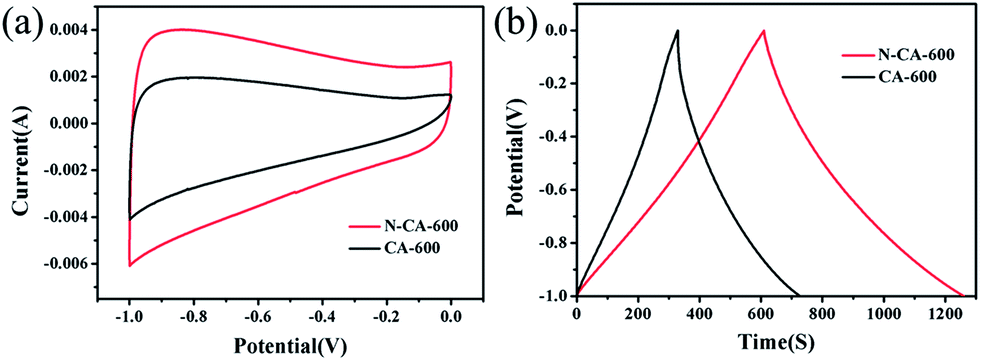 | ||
| Fig. 5 (a) Cyclic voltammetry (CV) curves of CA-600 and N–CA-600 electrode in a 6 M aqueous KOH electrolyte at a 5 mV s−1 scan rate; (b) charge–discharge curves of the CA-600 and N–CA-600 electrodes, constant current densities: 0.2 A g−1. | ||
The CV behaviour of PPy@CA electrode materials calcined at different temperature was investigated in order to understand the effect of calcination temperature on the electrochemical performance. The specific capacitance of N–CA-T (T = 600, 800, 1000 °C) electrodes at scan rates of 5 mV s−1 is plotted in Fig. 6(a). The CV curves are approximately rectangular, indicating the N-doped carbon aerogel electrode's good electrochemical performance. Their insignificant deviation from the ideal rectangular shape may arise from the resistance of the electrolyte and the contact resistance between the electrode and the current collector.52,53 The N–CA-600 electrode exhibits a high specific capacitance of 281.0 F g−1, which is much higher than those of N–CA-800 (168.9 F g−1) and N–CA-1000 (71.6 F g−1) at the same scan rate of 5 mV s−1. Fig. 6(b) comparatively shows the calculated specific capacitances at different scan rates of the three samples. Despite enhanced scan rates reducing the capacitance of the electrodes, the N–CA-600 electrode shows the best capacitance performance over broad scan rate ranges.
 | ||
| Fig. 6 (a) CV curves of N–CA-T electrodes in a 6 M aqueous KOH electrolyte at a scan rate of 5 mV s−1; (b) calculated specific capacitances of N–CA-T electrodes at different scan rates; (c) charge–discharge curves of N–CA-T electrodes at a constant current density of 0.2 A g−1; (d) Nyquist plot of N–CA-T, T = 600, 800 1000 °C. Inset shows the magnified 0–0.5 Ohm region. | ||
The capacitive behaviour of the three N-doped samples evaluated by the galvanostatic charge–discharge technique at a constant current density of 0.2 A g−1 is shown in Fig. 6(c). It can be clearly seen that all the curves exhibit symmetric triangles with gradual changes of slope in the potential range from −1.0 to 0 V, suggesting good electric double-layer capacitance performance. The discharging time of the three samples can be readily deduced from the discharge curves. From the discharge curve, the specific capacitance of N–CA-600 is calculated to be 150.6 F g−1 at a current density of 0.2 A g−1, while the specific capacitance values of N–CA-800 and N–CA-1000 are 101.5 F g−1 and 41.5 F g−1, respectively. These results verify that the N–CA-600 electrode has outstanding electrochemical performance.
The interfacial properties of electrodes were recorded using electrochemical impedance spectroscopy (EIS) carried out in a frequency range from 0.01 Hz to 100 kHz, and the results are presented in Fig. 6(d). The theoretical Nyquist plot of a supercapacitor consists of three regions depending on the frequencies. The semicircular part at higher frequencies corresponds to the electron transfer-limited process, and its diameter is equivalent to the faradic charge transfer resistance (Rct), solution resistance (Rs), which is the intersection of the curve at the real part Z′ in the high frequency range, and the Warburg impedance (W), which is the slope of the curves at low frequencies. The Nyquist plot of N–CA-600 exhibits a smaller semicircular diameter in the high-frequency region than those of N–CA-800 and N–CA-1000, suggesting that higher conductivity is achieved in the N–CA-600 system. At the same time, the more vertical shape at lower frequencies for N–CA-600 indicates a higher capacitive behaviour of the electrode.
In electrochemical applications, specific capacitance is normally a linear function of the total surface area; that is, the larger the surface area, the greater the double-layer capacitance. However, the capacitance in nitrogen-functionalized carbon does not follow this rule. This effect was ascribed to pseudocapacitance due to the faradaic redox reaction of edge N in the structures derived from pyridine or pyrrole in the carbonaceous materials. Therefore, a higher BET surface area was not always translated to higher performance in electrochemical systems.38 The high specific capacitance of sample N–CA-600 may be attributed to its relatively high N-doping level that changes the electron donor–acceptor characteristics of carbon despite its surface area only being 158.3 cm2 g−1. This is in agreement with previous studies where N-functionalities such as N-6 and N-5 bring about enhanced capacitance as a result of the existence of a pseudocapacitance effect.31,35,36,38,54 Nevertheless, N–Q functionalities were found to be less active than other N-functionalities for supercapacitors.31,51,55 From the perspective of binding energy in XPS analysis, it has been concluded that N-6 should play the dominant role in capacitance enhancement since it exhibited the largest binding energy.26,32,50 Therefore, controlling appropriate N configuration and concentration can greatly promote the capacitance of N-doped carbonaceous aerogel electrodes.
Conclusions
In this study, we demonstrated a feasible, scalable and cost-effective synthesis of 3D N-doped carbonaceous aerogels from sustainable biomass starting products. The fabrication of biomass-based porous N-doped carbonaceous material involves a one-pot hydrothermal synthesis of CA, followed by hydrothermal preparation of PPy@CA prior to calcination that finally introduces N into the C network. This preparation methodology offers great flexibility in tailoring the nitrogen bonding configurations and surface areas by varying the carbonization temperature. Because of the unique feature of the material, the PPy@CA prepared at 600 °C displays an excellent specific capacitance of 281.0 F g−1. We believe that these N-doped porous carbons are highly promising as novel versatile nanomaterials for multi-purpose applications in energy fields, and the synthesis strategy opens a good pathway to employ abundant and renewable natural resources for manufacturing N-doped porous carbon materials.Acknowledgements
We are grateful to the National Natural Science Foundation of China (no. 51173170, 50955010, 20974102) and for the financial support from the Innovation Talents Award of Henan Province (114200510019), State Key Laboratory of Chemical Engineering (no. SKL-ChE-13A04), and the Key program of science and technology (121PZDGG213) from Zhengzhou Bureau of science and technology.Notes and references
- C. Falco, N. Baccile and M. M. Titirici, Green Chem., 2011, 13, 3273–3281 RSC
.
- M. M. Titirici, R. J. White, C. Falcoa and M. Sevilla, Energy Environ. Sci., 2012, 5, 6769–6822 Search PubMed
- J. Zhang, Y. Yu, L. Liu and Y. Wu, Nanoscale, 2013, 5, 3052–3057 RSC
- L. F. Chen, X. D. Zhang, H. W. Liang, M. G. Kong, Q. F. Guan, P. Chen, Z. Y. Wu and S. H. Yu, Synthesis, ACS Nano, 2012, 6, 7092–7102 CrossRef CAS PubMed
- L. Zhao, L. Z. Fan, M. Q. Zhou, H. Guan, S. Y. Qiao, M. Antonietti and M. M. Titirici, Adv. Mater., 2010, 22, 5202–5206 CrossRef CAS PubMed
- L. L. Zhang, R. Zhou and X. S. Zhao, J. Mater. Chem., 2010, 20, 5983–5992 RSC
- B. G. Choi, M. H. Yang, W. H. Hong, J. W. Choi and Y. S. Huh, ACS Nano, 2012, 5, 4020–4028 CrossRef PubMed
- D. N. Futaba, K. Hata, T. Yamada and T. Hiraoka, et al., Nat. Mater., 2006, 5, 987–994 CrossRef CAS PubMed
- K. H. An, W. S. Kim, Y. S. Park, J. M. Moon, D. J. Bae, S. C. Lim, Y. S. Lee and Y. H. Lee, Nano Lett., 2012, 12, 3803–3807 CrossRef PubMed
- M. Sevilla, R. Mokaya and A. B. Fuertes, Energy Environ. Sci., 2011, 4, 2930–2936 CAS
- F. Su, C. K. Poh, J. S. Chen, G. Xu, D. Wang, Q. Li, J. Lin and X. W. Lou, Energy Environ. Sci., 2011, 4, 717–724 CAS
- L. Qie, W. M. Chen, H. H. Xu, X. Q. Xiong, Y. Jiang, F. Zou, X. L. Hu, Y. Xin, Z. L. Zhang and Y. H. Huang, Energy Environ. Sci., 2013, 6, 2497–2504 Search PubMed
- Y. M. He, W. J. Chen and X. D. Li, et al., ACS Nano, 2013, 7, 174–182 CrossRef CAS PubMed
- W. J. Chen, Y. M. He and X. D. Li, et al., Nanoscale, 2013, 5, 11733–11741 RSC
- Y. M. He, W. J. Chen and J. Y. Zhou, et al., ACS Appl. Mater. Interfaces, 2014, 6, 210–218 CAS
- X. Y. Chen, C. Chen, Z. J. Zhang, D. H. Xie, X. Deng and J. W. Liu, J. Power Sources, 2013, 230, 50–58 CrossRef CAS PubMed
- H. L. Guo and Q. M. Gao, J. Power Sources, 2009, 186, 551–556 CrossRef CAS PubMed
- M. M. Titirici and M. Antonietti, Chem. Soc. Rev., 2010, 39, 103–116 RSC
- N. Brun, C. A. Garcia-Gonzalez, I. Smirnova and M. M. Titirici, RSC Adv., 2013, 3, 17088–17096 RSC
- B. Hu, S. H. Yu, K. Wang, L. Liu and X. W. Xu, Dalton Trans., 2008, 5414–5423 RSC
- R. J. White, V. Budarin, R. Luque, J. H. Clark and D. J. Macquarrie, Chem. Soc. Rev., 2009, 38, 3401–3418 RSC
- X. L. Wu, T. Wen and H. L. Guo, et al., ACS Nano, 2013, 7, 3589–3597 CrossRef CAS PubMed
- J. Wei, D. D. Zhou, Z. K. Sun, Y. H. Deng, Y. Y. Xia and D. Y. Zhao, Adv. Funct. Mater., 2013, 23, 2322–2328 CrossRef CAS
- B. You, L. L. Wang, L. Yao and J. Yang, Chem. Commun., 2013, 49, 5016–5018 RSC
- H. M. Jeong, J. W. Lee, W. H. Shin, Y. J. Choi, H. J. Shin, J. K. Kang and J. W. Choi, Nano Lett., 2011, 11, 2472–2477 CrossRef CAS PubMed
- S. Y. Gao, H. Fan, Y. L. Chen, L. Li, Y. Bando and D. Golberg, Nano Energy, 2013, 1–10 Search PubMed
- Y. H. Lu, F. Zhang, T. F. Zhang, K. Leng, L. Zhang, X. Yang, Y. F. Ma, Y. Huang, M. J. Zhang and Y. S. Chen, Carbon, 2013, 63, 508–516 CrossRef CAS PubMed
- J. P. Paraknowitsch and A. Thomas, Energy Environ. Sci., 2013, 6, 2839–2855 CAS
- R. J. White, N. Yoshizawa, M. Antonietti and M. M. Titirici, Green Chem., 2011, 13, 2428–2434 RSC
- R. Lv, Q. Li and A. R. Botello-Mendez, et al., Sci. Rep., 2012, 2, 1–8 Search PubMed
- Y. W. Zhang, J. Ge, L. Wang, D. H. Wang, F. Ding, X. M. Tao and W. Chen, Sci. Rep., 2013, 1–8 Search PubMed
- H. B. Wang, T. Maiyalagan and X. Wang, ACS Catal., 2012, 2, 781–794 CrossRef CAS
- R. Czerw, M. Terrones and J. C. Charlier, et al., Nano Lett., 2001, 1, 457–460 CrossRef CAS
- M. Sevilla, L. H. Yu, T. P. Fellinger, A. B. Fuertes and M. M. Titirici, RSC Adv., 2013, 3, 9904–9910 RSC
- B. Xu, D. F. Zheng, M. Q. Jia, G. P. Cao and Y. S. Yang, Electrochim. Acta, 2013, 98, 176–182 CrossRef CAS PubMed
- B. Xu, S. S. Hou, G. P. Cao, F. Wu and Y. S. Yang, J. Mater. Chem., 2012, 22, 19088–19093 RSC
- B. Xu, H. Duan, M. Chu, G. P. Cao and Y. S. Yang, J. Mater. Chem. A, 2013, 1, 4565–4570 CAS
- S. Shrestha and W. E. Mustain, J. Electrochem. Soc., 2010, 157, B1665–B1672 CrossRef CAS PubMed
- C. X. Guo, N. Li and L. L. Ji, et al., J. Power Sources, 2014, 247, 660–666 CrossRef CAS PubMed
- A. H. Lu, A. Kiefer, W. Schmidt and F. Schuth, Chem. Mater., 2004, 16, 100–103 CrossRef CAS
- G. C. Marjanovic, I. Pasti, N. Gavrilov, A. Janosevic and S. Mentus, Chem. Pap., 2013, 67, 781–813 CrossRef PubMed
- W. Li, D. Chen, Z. Li, Y. Shi, Y. Wan, G. Wang, Z. Jiang and D. Zhao, Carbon, 2007, 45, 1757–1763 CrossRef CAS PubMed
- V. Chandra, S. U. Yu, S. H. Kim, Y. S. Yoon, D. Y. Kim, A. H. Kwon, M. Meyyappan and K. S. Kim, Chem. Commun., 2012, 48, 735–737 RSC
- J. M. Gu, W. S. Kim, Y. K. Hwang and S. Huh, Carbon, 2013, 56, 208–217 CrossRef CAS PubMed
- Y. M. Tan, C. F. Xu and G. X. Chen, et al., ACS Appl. Mater. Interfaces, 2013, 5, 2241–2248 CAS
- Y. S. Lim, Y. P. Tan, H. N. Lim, N. M. Huang and W. T. Tan, J. Polym. Res., 2013, 20, 1–10 CAS
- V. Chandra and K. S. Kim, Chem. Commun., 2011, 47, 3942–3944 RSC
- R. J. White, M. Antonietti and M. M. Titirici, J. Mater. Chem., 2009, 19, 8645–8650 RSC
- T. V. Vernitskaya and O. N. Efimov, Russ. Chem. Rev., 1997, 66, 443–457 CrossRef PubMed
- X. Li, H. Wang, J. T. Robinson, H. Sanchez, G. Diankov and H. Dai, J. Am. Chem. Soc., 2009, 131, 15939–15944 CrossRef CAS PubMed
- Z. Li, Z. W. Xu, X. H. Tan, H. L. Wang, C. M. B. Holt, T. Stephenson, B. C. Olsen and D. Mitlin, Energy Environ. Sci., 2013, 6, 871–878 CAS
- X. Y. Chen, C. Chen, Z. J. Zhang, D. H. Xie and X. Deng, Ind. Eng. Chem. Res., 2013, 52, 10181–10188 CrossRef CAS
- W. C. Li, G. Reichenauer and J. Fricke, Carbon, 2002, 40, 2955–2959 CrossRef CAS
- X. Yang, D. Wu, X. Chen and R. Fu, J. Phys. Chem. C, 2010, 114, 8581–8586 CAS
- C. O. Ania, V. Khomenko, E. Raymundo-Pinero, J. B. Parra and F. Beguin, Adv. Funct. Mater., 2007, 17, 1828–1836 CrossRef CAS
Footnote |
| † Electronic supplementary information (ESI) available: SEM images of N–CA-800 (d) and N–CA-1000, FTIR of carbonaceous aerogel, XRD of carbonaceous aerogel. See DOI: 10.1039/c4ra02109f |
| This journal is © The Royal Society of Chemistry 2014 |