DOI:
10.1039/C4RA02050B
(Paper)
RSC Adv., 2014,
4, 22964-22970
A highly selective turn-off fluorescent probe for Cu(II) based on a dansyl derivative and its application in living cell imaging†
Received
11th March 2014
, Accepted 2nd May 2014
First published on 5th May 2014
Abstract
A novel dansyl derivative (1) was designed and synthesized with high yield. It is highly selective for Cu2+ over other competing metal ions such as Ca2+, Co2+, Cr3+, Cu+, Fe2+, Ga3+, Hg2+, Mg2+, Na+, Ni2+ and Pb2+. Zn2+ and Fe3+ only slightly changed the fluorescence of probe 1. The linear relationship between fluorescence intensity and Cu2+ concentration indicates that 1 can be used for quantification. The binding ratio of probe 1 to Cu2+ was found to be 1![[thin space (1/6-em)]](https://www.rsc.org/images/entities/char_2009.gif) :1 according to Job's plot experiments. Probe 1 can be used in a broad pH value window ranging from 5 to 11. The limit of detection (LOD) based on 3 × δblank/k was calculated with a value as low as 1.6 × 10⁻⁶ M for Cu2+. Additionally, the association constant of probe 1 − Cu2+ complexes was found to be 5.08 × 10⁴ M−1. Moreover, fluorescence microscopy experiments showed that 1 can be used as a fluorescent probe for evaluating the presence of exogenous Cu2+ in living cells.
:1 according to Job's plot experiments. Probe 1 can be used in a broad pH value window ranging from 5 to 11. The limit of detection (LOD) based on 3 × δblank/k was calculated with a value as low as 1.6 × 10⁻⁶ M for Cu2+. Additionally, the association constant of probe 1 − Cu2+ complexes was found to be 5.08 × 10⁴ M−1. Moreover, fluorescence microscopy experiments showed that 1 can be used as a fluorescent probe for evaluating the presence of exogenous Cu2+ in living cells.
Introduction
Among the various transition metal ions, copper is an essential metal element not only for human beings and plants but also for extensive microorganisms, playing a crucial role in various fundamental physiological functions including enzyme functions and transcriptional events.1 However, deficiency of copper may lead to hematological manifestations and affect the corresponding enzyme activity and normal metabolism of organisms, whereas excess Cu2+ can exhibit toxicity and cause gastrointestinal disturbance and neurodegenerative diseases, including Wilson's and Alzheimer's diseases.2 In addition, copper ions are considered as an important environmental pollutant because of their widespread use by man-made sources, such as the paper industry, agriculture and fossil fuel combustion.3 Thus, it is of great significance to detect copper ions in living cells and environmental settings.4–6 In the past few years, traditional analytical assays, ranging from atomic absorption spectrometry to inductively coupled plasma mass spectrometry, have been used to detect metal ions. However, those strategies are always limited by several unsatisfactory aspects, such as high costs, complicated operation as well as the inability to analyze on site. Therefore, more convenient and economic approaches for copper ion detection are urgently desirable.7 Recently, the design and development of detection tools based on an optical signal with high sensitivity and excellent selectivity for metal ions as a hot research topic is booming in the field of chemosensing. Synthetic fluorescent ion probes provide gratifying advantages over other strategies for the selective recognition of chemically and biologically important ions, with the advantages of high sensitivity, simplicity, instantaneous response and low cost.8–10 Up to now, several studies have aimed at obtaining fluorescent probes for Cu2+ detection.11,12 Although a few probes showed fluorescence enhancement with the binding of Cu2+ ions, their selectivity and pH-independent ability need to be improved for a more suitable and broad practical application.13 Thus, the research related to this area is of great challenge and interest. In this study, we developed a novel fluorescence copper probe and investigated its fluorescence properties and bioimaging application. A dansyl derivative was chosen as the fluorophore because of its outstanding intramolecular charge transfer (ICT) structure and desirable spectroscopic properties, such as a large Stokes shift, absorbance in near UV region as well as because it is the smallest available fluorophore.14 A pyridine group was introduced into the dansyl molecular skeleton, since it can be utilized as a chelator for Cu2+ binding owing to nitrogen atoms bearing lone pair electrons, showing a certain coordination ability with Cu2+. Additionally, the piperidine carboxamide substituent is conjugated to the sulfamine side, and the folding spatial conformation of piperidine carboxamide is expected to synergically recognize Cu2+ with a pyridine group. While probe 1 interacts with copper ions, the fluorescence signal is envisioned to turn off. Fluorescence quenching can be attributed to the decrease of the electron-donating ability of the aniline nitrogen atoms and the occurrence of the intramolecular charge transfer process. Furthermore, this probe shows a fast response and high selectivity towards Cu2+ over other tested metal ions and anions. The results show that this probe can be used to detect Cu2+ at micromolar levels and in a broad pH range. It was finally applied successfully to image exogenous copper ions in living HeLa cells, demonstrating its practical applications.
Results and discussion
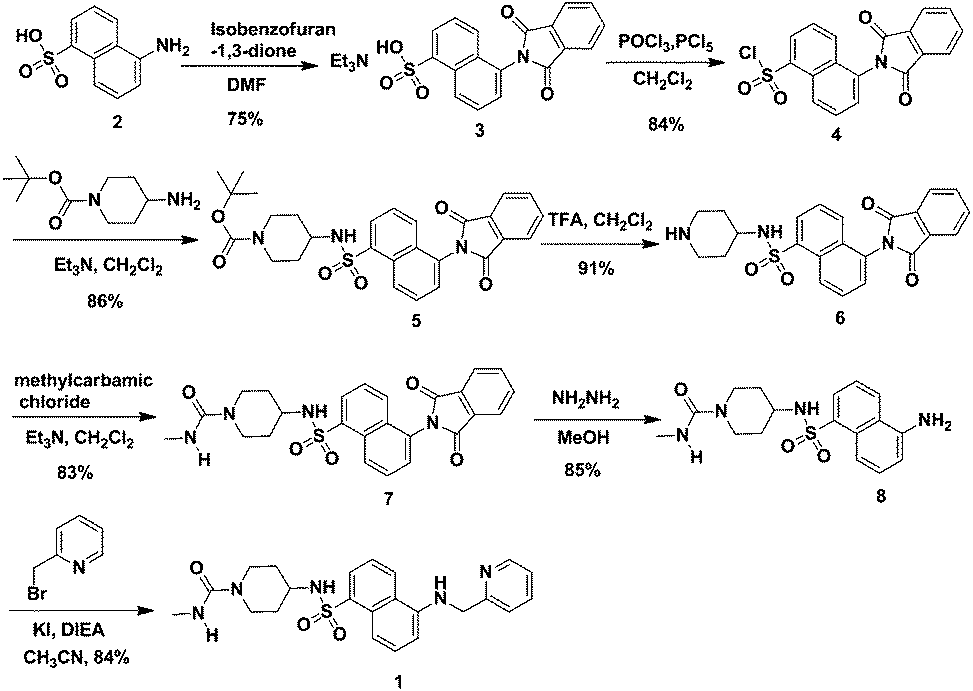
The detailed synthetic route of probe 1 is depicted in Scheme 1. It was synthesized with 29.2% overall yield by a seven-step synthetic procedure from the readily available starting material 5-aminonaphthalene-1-sulfonic acid. These chemical structures were fully characterized and confirmed by 1H NMR, 13C NMR, MS (ESI) and/or HRMS spectra (see ESI†).
 |
| | Scheme 1 Synthesis of probe 1. | |
To investigate the ion recognition capability of probe 1 in an optimal aqueous solution, the HEPES buffer was used to keep the probe solution in a physiological pH window. The spectroscopic properties of probe 1 were evaluated in different concentrations of the HEPES buffer solution. This novel probe displayed strong fluorescence intensity under neutral conditions (Fig. S1, ESI†), which indicated that 1 is insensitive to pH in a physiological environment and would work well in physiological conditions. Additionally, the optimal concentration of HEPES for the probe solution is 20 mmol L−1 as its fluorescence intensity is higher than that in other concentrations. Thus, 20 mmol L−1 was selected as the experimental media concentration in further spectroscopic measurement.
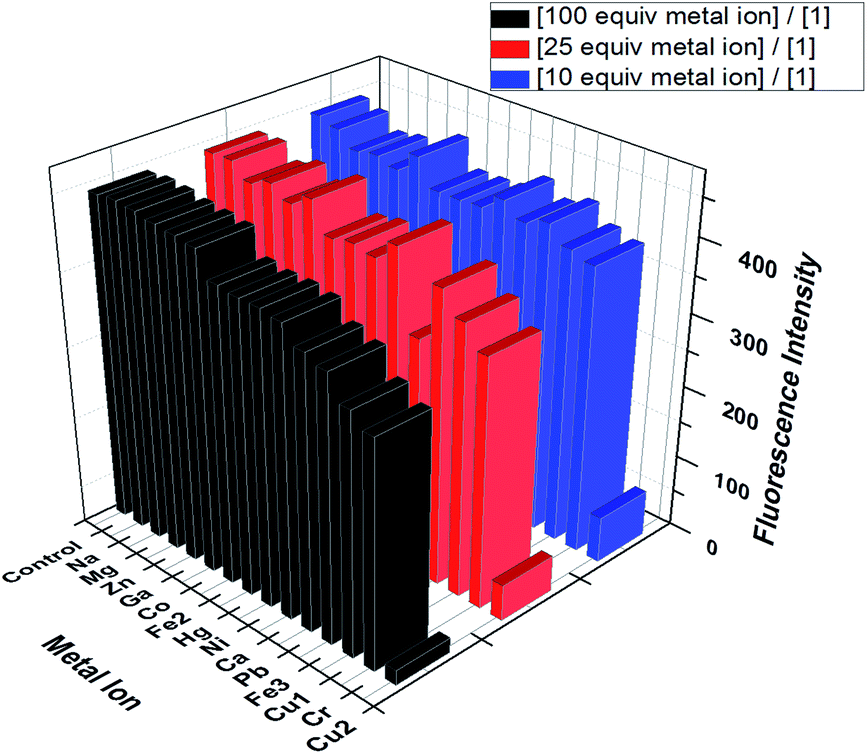
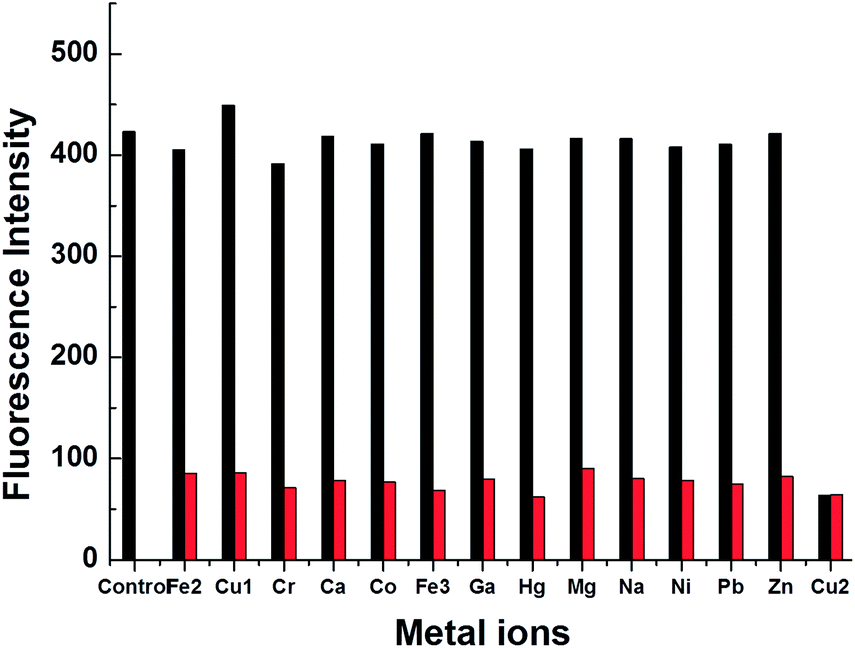
UV-vis analyses were first performed to investigate the response to metal ions. As seen in Fig. S2 (ESI),† the absorption maximum wavelength of probe 1 at 348 nm vanishes drastically upon the addition of Cu2+. However, no significant changes are observed towards other tested metal ions. The absorption titration of probe 1 with Cu2+ is also investigated in Fig. S3.† Without Cu2+, probe 1 shows a distinctive absorption band at 325 nm to 425 nm with a maximum absorption at 348 nm. Cu2+ titration leads to a decrease in this absorption, along with an increase in the 300 nm absorption band. To further verify the selectivity towards Cu2+, probe 1 was titrated over a wide range of metal ions. The wavelength of the maximum emission peak of the probe in the CH3CN/H2O (8/2, v/v) HEPES buffer solution (pH 7.0) is 515 nm when the fluorimetric detector was used with the excitation wavelength at 348 nm. The fluorescence intensity is slightly changed by the addition of 25 equiv. of Ca2+, Co2+, Cr3+, Cu+, Fe2+, Ga3+, Hg2+, Mg2+, Na+, Ni2+, Pb2+, Zn2+ and Fe3+ (Fig. 1). However, drastic fluorescence quenching is easily observed upon the addition of 25 equiv. of Cu2+, which indicated that 1 could selectively recognize Cu2+ in aqueous conditions. For reproducible recognition ability in a lower or higher concentration of various metal ions, an extensive selectivity experiment in three different concentrations of various metal ions was carried out as shown in Fig. 2; the fluorescence response of 1 upon the addition of 10, 25 and 100 equiv. of a variety of metal ions demonstrated that 1 has high selectivity for Cu2+ over other tested cations and can even well discriminate Cu2+ from Cu+. Beside, the spectroscopic response of 1 in the presence of various common anions was also studied in Fig. S4 (ESI),† including NO3−, S2−, Cl−, CH3COO−, Br−, CO32−, SO42− and HCO3−. It is concluded that none of these anions induced any significant changes in the fluorescent spectrum of 1, which illustrated that probe 1 has excellent selectivity for Cu2+ from all tested cations and anions.
 |
| | Fig. 1 Fluorescence response of probe 1 (16 μM) to various metal ions (400 μM) in CH3CN/HEPES buffer (8/2, v/v, pH = 7.0) excited at 348 nm. | |
 |
| | Fig. 2 Fluorescence responses of 1 (16 μM) in the presence of 10, 25 and 100 equiv. of various metal ions (CH3CN/HEPES buffer = 8/2, v/v, pH = 7.0, λex/λem = 348 nm/515 nm). | |
The experiment of Cu2+ titration was presented in Fig. 3 and S3.† Cu2+ addition leads to a decrease in the maximum emission peak, along with an increase in the 400 nm band, with isosbestic points at 460 nm. Upon the addition of Cu2+, it displays a sharp decrease and finally saturates at about 3 equiv. of Cu2+. From the photograph recorded under UV light, the emission color of the solution continuously changes from green to dark in Fig. 3a, which can be easily observed by the naked eye. There is a good linear correlation (R2 = 0.994, in the inset of Fig. 3b) between the fluorescence intensity and the concentration of Cu2+ in the range from 1.6 × 10⁻⁶ M to 3.2 × 10⁻⁵ M with 16 μM of probe 1. The linear regression equation was F = −192.197X + 523.351, where X denotes the equiv. of Cu2+. The association constant between 1 and Cu2+ was estimated as 5.08 × 10⁴ M−1 from the titration experiment (Fig. S5, ESI†). The detection limit of this probe was calculated to be 1.6 × 10⁻⁶ M (based on S/N = 3), which is much lower than the copper content in blood (11.8–23.6 μM). In short, probe 1 can be a sensitive fluorescent sensor for the quantitative detection of Cu2+ at micromolar levels.
 |
| | Fig. 3 (a) Fluorescence changes of 1 (16 μM) in the presence of increasing Cu2+ in CH3CN/HEPES buffer (8/2, v/v, pH = 7.0); (b) saturation curve between the relative fluorescence intensity and the equiv. of Cu2+. Insert: linear responses of 1 (16 μM) as a function of Cu2+ concentration (CH3CN/HEPES buffer = 8/2, v/v, pH = 7.0, λex/λem = 348 nm/515 nm). | |
To determine the binding stoichiometry of probe 1–Cu2+ complexes, Job's plot15 experiments were performed. A series of solutions containing Cu2+ and probe 1 were prepared, in which their total concentrations were constants. The fluorescence intensity of those mixtures of Cu2+ and probe 1 in varying molar ratios (1:9, 2:8, 3:7, 4:6, 5:5, 6:4, 7:3, 8:2 and 9:1) was measured. Fig. S6† exhibits that a maximum fluorescence intensity appears at 0.5 fraction, indicating the formation of a 1:1 complex between 1 and Cu2+ (Fig. 4a). To gain a clearer understanding of the structure of 1–Cu2+ and the binding site, 1H-NMR data of the complex was investigated. Cu2+ is a paramagnetic ion and affects the proton signals that are close to the Cu2+ binding site. The 1H-NMR spectra of 1 recorded with increasing equiv. of Cu2+ show that the proton (He) signals are gradually shifted upfield (Fig. 4b). Thus, the specific recognition site for Cu(II) is proposed between the site of the aniline and pyridyl nitrogen atoms. These results indicated that a plausible mode of 1–Cu2+ is proposed in Fig. 4a. To validate the pH applicability of 1, the effect of pH on the fluorescence intensity of probe 1 in the presence and absence of Cu2+ was also investigated. As presented in Fig. 5, S7 and S8 (ESI),† the fluorescence intensity of probe 1 alone was independent of the pH ranging from 5 to 13, which indicated that the chemical structure and fluorescence property of probe 1 are relatively stable over a wide pH range from 5 to 13. However, upon the addition of Cu2+, the fluorescence intensity of 1 drastically decreases, and these phenomena are stable from pH 4 to 11. However, when pH is lower than 4, the fluorescence quenching of probe 1 is most likely caused by the mechanism of photoinduced electron transfer (PET) from the fluorophore to protonated aniline under the strong acid environment. This observation might result from the strongly electron-withdrawing character of the protonated aniline, which may serve as an acceptor in its protonated form. Thus, a strong acid environment led to enhancement in the PET process upon the protonation of aniline. Additionally, when the pH is above 11, the fluorescence intensity of 1–Cu2+ complex increases gradually which can be attributed to the competition of hydroxyl ion (OH−) and the formation of Cu(OH)2. The results confirmed that 1 is able to detect Cu2+ in a wide pH window from 5 to 11, which is the overlap pH range of both the probe 1 alone and the mixture of probe 1–Cu2+. The above study indicated that probe 1 can be used in the physiological pH window and even some complicated environment.
 |
| | Fig. 4 (a) Proposed binding mode between probe 1 and Cu2+; (b) 1H-NMR 400 MHz spectra of 1 (10.0 mM) upon titration with 0.5 equiv., 0.75 equiv. and 1.0 equiv. of Cu2+. | |
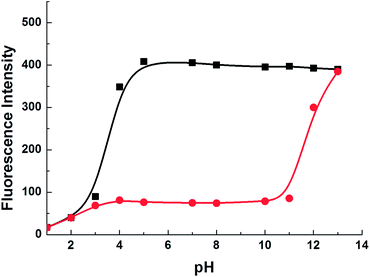 |
| | Fig. 5 Emission of 1 alone (black curve) and 1–Cu2+ complex (red curve) at different pH (λex/λem = 348 nm/515 nm). | |
To exclude potential interference from other metal ions on Cu2+ binding with probe 1, competition experiments were conducted with 13 other types of metal ions in the presence of Cu2+. As presented in Fig. 6, fluorescence quenching of 1 resulting from the mixture of Cu2+ and each of the various metal ions is similar to that caused by Cu2+ alone, indicating that all of those metal ions did not significantly affect the emission intensities of probe 1 and probe 1–Cu2+ complex. Therefore, it confirmed that 1 is a highly Cu2+-specific probe with an ‘ON-OFF’ optical function. The fluorescent quantum yield16 of 1 in the absence and the presence of Cu2+ is 8.2% and 0.42%, respectively (Table S1, ESI†).
 |
| | Fig. 6 Fluorescence responses of probe 1 (16 μM) to the addition of Cu2+ (320 μM) or 160 μM of other metal ions (black bars) and to the mixture of other metal ions (160 μM) with 320 μM of Cu2+ (red bars) in the CH3CN/HEPES buffer solution (8/2, v/v, pH = 7.0, λex/λem = 348 nm/515 nm). | |
Besides high selectivity and pH independence, a fast response is another necessity for a fluorescent probe to monitor Cu2+. To explore the response time of probe 1, the kinetics of fluorescence intensity upon the addition of different concentrations of Cu2+ was recorded. As depicted in Fig. 7, a clear decrease of fluorescence intensity is observed within 1 minute, and the response time of probe 1 to Cu2+ is dependent on concentration. Therefore, it is a favorable property of 1 for Cu2+ detection in comparison with other reported copper ion probes17a and traditional analytical assays mentioned above. This fast response also suggested that this probe enables Cu2+ detection in real time.
 |
| | Fig. 7 Reaction-time profiles of 1 (16 μM) in the absence (black) or presence of Cu2+ [1, 3, 4, 5, 8, 9, 10, 25 and 50 equiv.]. Fluorescence intensities at 515 nm were continuously monitored at time intervals in the CH3CN/HEPES buffer solution (8/2, v/v, pH = 7.0, λex/λem = 348 nm/515 nm). | |
To get insight into the reversibility of the binding between probe 1 and Cu2+, N,N,N′,N′-tetra(2-picolyl)-ethylenediamine (TPEN), a well-known metal ion chelator,17b was used in reversibility studies. The fluorescence intensity was restored to the status of free probe 1 by adding 4 equiv. of TPEN to the probe 1–Cu2+ complex (Fig. 8a), which means the response of probe 1 to Cu2+ can be reversed, and probe 1 can have a possibility of recycling or reutilization after reversible treatment. Furthermore, the time course kinetics of fluorescence experiments showed that fluorescence intensity of 1, 1–Cu2+ and TPEN/1–Cu2+ remained almost unaltered over a period of 3 min (Fig. 8b). It was concluded that 1, 1–Cu2+ and the complex of TPEN/1–Cu2+ have good photostability.
 |
| | Fig. 8 (a) Reversibility of Cu2+ binding to 1 upon the addition of TPEN. Black line: only probe 1; red line: 1–Cu2+ (2 equiv.); blue line: 1–Cu2+ (2 equiv.) plus TPEN (4 equiv.) in the CH3CN/HEPES buffer (8/2, v/v, pH = 7.0) solution on excitation at 348 nm; (b) time-course kinetics of fluorescence experiments. Red line: only probe 1; blue line: 1–Cu2+ (2 equiv.); black line: 1–Cu2+ (2 equiv.) plus TPEN (4 equiv.) in the CH3CN/HEPES buffer (8/2, v/v, pH = 7.0, λex/λem = 348 nm/515 nm). | |
With the understanding of the fluorescence turn-off response, and based on its favorable fluorescence properties, we explored the possibility of using 1 for the recognition of exogenous Cu2+ in living cells. For in vitro cell imaging, since considering that CH3CN is not good for cells, 16 μM of probe 1 is prepared only in the HEPES buffer solution instead of the CH3CN/HEPES buffer solution. HeLa cells were chosen, and their fluorescence images were recorded before and after incubation with Cu2+. The cells were supplemented with 1 alone for 15 min at 37 °C and washed with PBS to remove the remaining probe. Strong and bright fluorescence images are observed by confocal fluorescence microscopy (Fig. 9B–D), indicating that probe 1 has excellent cell membrane permeability. In contrast, HeLa cells display significant fluorescence quenching upon the addition of CuCl2 for 20 min at 37 °C, and no obvious fluorescence is found in Fig. 9F–H, which suggested that probe 1 is able to detect Cu2+ uptake in living cells. Moreover, it is important to point out that after a long time of incubation with probe 1 for 24 h, most HeLa cells remain in good condition, which demonstrated the low cytotoxicity of 1.
 |
| | Fig. 9 Confocal fluorescence images of HeLa cells. (A) Bright field image of HeLa cells; (B) fluorescence image of HeLa cells incubated with 1 (16 μM) by the blue channel; (C) green channel image of cells shown in panel (B); (D) merged images of B and C; (E) bright field image of HeLa cells; (F) fluorescence image of HeLa cells incubated with 1 (16 μM) followed by the addition of 50 μM CuCl2 by the blue channel; (G) green channel image of cells shown in panel (F); (H) merged images of F and G. | |
Conclusions
In summary, a novel fluorescence probe 1 was developed for detection of Cu2+ in both aqueous solutions and living cells. It shows excellent selectivity and high sensitivity for Cu2+ over other common metal ions and anions based on intramolecular charge transfer mechanism. 1 can be used to quantitatively detect micromolar levels of Cu2+ with a fast response and in a broad pH window range from 5 to 11. We also successfully demonstrated the utility of 1 for the determination of exogenous Cu2+ in living HeLa cells.
Experimental section
Materials and instrumentations
All chemicals used in this paper were obtained from commercial suppliers and used without further purification. Solvents used were purified by standard methods prior to use. NMR spectra were taken on a Bruker AMX400 spectrometer with chemical shifts reported as ppm (TMS as an internal standard). High resolution mass (HRMS) spectra were obtained using a Waters Q-Tof Permier mass spectrometer. UV-vis absorption spectra were obtained on a Shimadzu UV-2450 spectrophotometer with a quartz cuvette (path length = 1 cm). Fluorescence measurements were taken on a Shimadzu RF-5301PC fluorescence spectrometer. The fluorescence image of intracellular Cu2+ was observed under a Perkin Elmer UltraVIEW VOX confocal imaging system. pH measurements were made with a Sartorius Basic pH-meter PB-10. TLC analysis was conducted on silica gel plates, and column chromatography was performed over silica gel (mesh 200–300), both of which were purchased from Qingdao Ocean Chemicals.
Preparation of the test solution
A stock solution of 20 μM 1 was prepared in acetonitrile. A stock solution of 0.004 M Cu2+ was also prepared by dissolving Cu(NO3)2·3H2O in 20 mmol L−1 HEPES buffer, which was prepared using double distilled water. The working solution of 1 (16 μM) was prepared by mixing a 2 mL stock solution of Cu2+ with an 8 mL stock solution of 1 (20 μM). For the metal ion selectivity study, various metal ions solutions of CuCl, CoCl2, CrCl3, FeCl2, GaCl3·6H2O, HgCl2, MgCl2, NaCl, NiCl2·6H2O, Pb(NO3)2, ZnCl2 and Fe(NO3)3·9H2O were used. The anions study was performed using sodium salts of different anions. For all measurements of fluorescence spectra, excitation was at 348 nm with excitation and emission slit widths at 5 nm and 3 nm, respectively. Fluorescence titration experiments were conducted using 16 μM of 1 in the HEPES buffer/CH3CN solution (2/8, v/v) with varying concentrations of Cu2+.
Fluorescence quantum yield
The fluorescence quantum yields were determined using quinine as a standard with a known Φ value of 0.546 in 0.1 M H2SO4. The sample and standard were excited at the same wavelength (348 nm), maintaining nearly equal absorbance (0.05). The quantum yield was calculated as follows:
| Φs/Φf = (As/Af) × (Abss/Absf) × (ηs2/ηf2), |
where Φs and Φf are the fluorescence quantum yields of the standard and samples (1 and 1 + Cu2+), respectively; As and Af are the emission areas of the standard and samples, respectively; Abss and Absf are the absorbance of the standard and samples at the wavelength of excitation; ηs and ηf are the refractive indices of the standard and reference, respectively.
Imaging in HeLa cells
HeLa cells were cultured in an RPMI 1640 (Gibco) medium supplement with 10% newborn serum (NBS, Gibco), 100 units mL−1 penicillin (Gibco) and 100 μg mL−1 streptomycin (Gibco) at 37 °C in a humidified atmosphere of 5.0% CO2 in an incubator. For cell imaging, cells (2 × 10⁵) were plated in 2 mL of a complete cell growth medium on a 35 mm diameter glass-bottomed dish and incubated for 24 hours.
After cell adhesion, culture media was removed and washed with PBS three times and then 800 μL PBS was added into each dish. All the cell lines were incubated with 1 (16 μM) for 10 min at room temperature. Fluorescence images were obtained by blue and green channels, and the excitation wavelength of the laser was 405 nm and 488 nm, respectively. Upon the addition of 50 μM Cu2+ into the cell line, fluorescence images of intracellular Cu2+ were also obtained by blue and green channels, and the excitation wavelength of the laser was 405 nm and 488 nm, respectively.
General procedures for the synthesis of probe 1
Synthesis of 3. Triethylamine (2 mL) was added dropwise to a solution of 5-aminonaphthalene-1-sulfonic acid (5576 mg, 25 mmol) (2) and isobenzofuran-1,3-dione (4440 mg, 30 mmol) in DMF (20 mL), and the mixture was stirred and refluxed at 170 °C for 48 h. The solvent was evaporated, and the residue was taken up in chloroform, dried by MgSO4 and evaporated. The product was obtained following purification by silica gel column chromatography as a colorless solid 3 (8516 mg, yield 75%). 1H-NMR (400 MHz, CDCl3) δ (ppm): 9.14 (1H, d), 8.25 (1H, dd), 7.99 (2H, d), 7.83 (2H, d), 7.66 (2H, t), 7.46 (2H, t), 3.08 (6H, m), 1.29 (9H, t); 13C-NMR (100 MHz, CDCl3) δ (ppm): 167.7, 141.8, 134.5, 131.9, 131.1, 130.3, 128.9, 128.3, 127.1, 126.2, 126.0, 125.5, 125.1, 123.9, 46.2; HRMS (ESI) m/z: calcd, [M + Na]+ 477.1460; found, [M + Na]+ 477.1447.
Synthesis of 4. To a solution of 5-(1,3-dioxoisoindolin-2-yl)naphthalene-1-sulfonic acid 3 (6810 mg, 15 mmol) in phosphorus oxychloride (18400 mg, 120 mmol), phosphorus pentachloride (8500 mg, 40 mmol) was added portionwise. The reaction mixture was stirred for 12 h under nitrogen at room temperature. The reaction was quenched by pouring into ice water and stirring and then neutralized with solid sodium bicarbonate. Dichloromethane (250 mL) was employed to extract the cold aqueous solution. The combined organic layers were dried by MgSO4, concentrated and left under high vacuum to provide a pale yellow product 4 (4452 mg, yield 84%) without further purification.
Synthesis of 5. To a CH2Cl2 (20 mL) solution of 5-(1,3-dioxoisoindolin-2-yl)naphthalene-1-sulfonyl chloride 4 (5565 mg, 15 mmol), Et3N (2 mL) and tert-butyl 4-aminopiperidine-1-carboxylate (3309 mg, 16.5 mmol) were added. The reaction mixture was stirred at 25 °C for 18 h. Concentration and purification by column chromatography provided 5 (6903 mg, 86%) as a colorless solid. 1H-NMR (400 MHz, CDCl3) δ (ppm): 8.80 (1H, d), 8.33 (1H, d), 8.02 (2H, d), 7.80 (3H, t), 7.73 (1H, t), 7.55 (2H, t), 5.11 (1H, d), 3.87 (2H, s), 3.30 (1H, m), 2.73 (2H, t), 1.73 (2H, t), 1.41 (9H, s), 1.30 (2H, t); 13C-NMR (100 MHz, CDCl3) δ (ppm): 167.7, 154.6, 136.7, 134.9, 132.0, 131.6, 130.0, 129.5, 129.3, 128.8, 128.2, 128.0, 126.4, 125.5, 124.2, 79.9, 51.3, 33.0, 28.5; HRMS (ESI) m/z: calcd, [M + H]+ 536.1856; found, [M + H]+ 536.1846.
Synthesis of 6. To a solution of compound 5 (5352 mg, 10 mmol) in CH2Cl2 (15 mL), trifluoroacetic acid (15 mL) was added dropwise at 0 °C over 5 minutes. The reaction mixture was stirred for 12 hours at room temperature. The reaction mixture was then evaporated three times with dichloromethane. A yellow residue was obtained after evaporation. The residue was purified by silica gel column chromatography to yield 6 as a white solid (3860 mg, 91%). 1H-NMR (400 MHz, CDCl3) δ (ppm): 8.81 (1H, d), 8.34 (1H, d), 8.03 (2H, t), 7.87 (3H, m), 7.75 (1H, t), 7.55 (2H, dd), 3.49 (1H, m), 2.93 (2H, d), 2.52 (2H, m), 1.71 (2H, m), 1.30 (2H, m); MS (m/z): calcd, [M + H]+ 436.1; found, [M + H]+ 436.01.
Synthesis of 7. To a solution of 5-(1,3-dioxoisoindolin-2-yl)-N-(piperidin-4-yl)naphthalene-1-sulfonamide 6 (4351 mg, 10 mmol) in CH2Cl2 (15 mL), Et3N (2 mL) and methylcarbamic chloride (1116 mg, 12 mmol) were added. The reaction mixture was stirred at 25 °C for 8 h, at which point the solvent was removed in vacuum. The crude residue was directly purified via column chromatography to afford 7 as a white solid (4083 mg, 83%). 1H-NMR (400 MHz, CDCl3) δ (ppm): 8.79 (1H, d), 8.34 (1H, d), 8.02 (2H, m), 7.87 (3H, m), 7.76 (1H, m), 7.56 (2H, m), 4.89 (1H, d), 4.40 (1H, m), 3.71 (2H, d), 3.31 (1H, m), 2.76 (2H, m), 2.74 (3H, d), 1.73 (2H, m), 1.33 (2H, m); HRMS (ESI) m/z: calcd, [M + H]+ 493.1546; found, [M + H]+ 493.1532.
Synthesis of 8. To a solution of 7 (2460 mg, 5 mmol) in MeOH (20 mL), hydrazine (6250 mg, 125 mmol) was added. The resultant solution was stirred at 70 °C for 24 h, at which point the precipitate was removed via filtration and washed with MeOH (30 mL). The filtrate was collected, and the solvent was removed in vacuum to provide a crude product. The crude product was directly purified via column chromatography to afford 8 as a yellow solid (1539 mg, 85%). 1H-NMR (400 MHz, CD3OD) δ (ppm): 8.31 (1H, d), 8.20 (1H, d), 7.97 (1H, d), 7.44 (2H, m), 6.90 (1H, d), 3.68 (2H, d), 3.15 (1H, m), 2.64 (2H, t), 2.62 (3H, s), 1.485 (2H, m), 1.22 (2H, m); 13C-NMR (100 MHz, CD3OD) δ (ppm): 160.4, 146.2, 137.2, 130.1, 129.7, 128.9, 128.0, 125.6, 123.2, 115.0, 111.2, 51.8, 43.5, 33.5, 27.5; HRMS (ESI) m/z: calcd, [M + H]+ 363.1492; found, [M + H]+ 363.1491.
Synthesis of 1. To a stirred solution of primary amine 8 (181 mg, 0.5 mmol) in CH3CN (5 mL), 2-(bromomethyl)pyridine (128 mg, 0.75 mmol) and DIEA (194 mg, 1.5 mmol) were added dropwise. KI (8 mg, 0.05 mmol) was added. The mixture was refluxed at 90 °C for 6 h. The precipitate was filtered off, and the solution was evaporated to dryness. The resulting precipitate was purified via column chromatography to afford 1 as a greenish solid (190 mg, 84%). 1H-NMR (400 MHz, CD3OD) δ (ppm): 8.52 (1H, d), 8.46 (1H, d), 8.23 (1H, d), 7.93 (1H, d), 7.73 (1H, t), 7.50 (2H, dd), 7.35 (1H, t), 7.29 (1H, dd), 6.49 (1H, d), 4.65 (2H, s), 3.68 (2H, d), 3.16 (1H, m), 2.69 (2H, m), 2.63 (3H, s), 1.47 (2H, m), 1.23 (2H, m); 13C-NMR (100 MHz, CD3OD) δ (ppm): 160.4, 149.4, 145.6, 139.1, 137.4, 130.6, 130.2, 129.8, 128.1, 125.7, 123.8, 123.5, 122.9, 114.3, 106.4, 66.6, 51.8, 43.5, 33.5, 27.6, 20.2; HRMS (ESI) m/z: calcd, [M + H]+ 454.1835; found, [M + H]+ 454.1913.
Acknowledgements
This work was supported by grants from the National Natural Science Foundation of China (30900377 and 81271634), the Fundamental Research Funds for the Central Universities, Doctoral Station of Ministry of Education of China (no 20120162110070) and the Hunan Provincial Natural Science Foundation of China (12JJ1012).
Notes and references
-
(a) S. Okamoto and L. D. Eltis, Metallomics, 2011, 3, 963–970 RSC;
(b) R. Uauy, M. Olivares and M. Gonzalez, Am. J. Clin. Nutr., 1998, 67, 952S–959S CAS;
(c) E. L. Que, D. W. Domaille and C. J. Chang, Chem. Rev., 2008, 108, 1517–1549 CrossRef CAS PubMed.
-
(a) T. R. Halfdanarson, N. Kumar, C. Y. Li, R. L. Phyliky and W. J. Hogan, Eur. J. Haematol., 2008, 80, 523–531 CrossRef CAS PubMed;
(b) D. J. Waggoner, T. B. Bartnikas and J. D. Gitlin, Neurobiol. Dis., 1999, 6, 221–230 CrossRef CAS PubMed;
(c) D. Strausak, J. F. Mercer, H. H. Dieter, W. Stremmel and G. Multhaup, Brain Res. Bull., 2001, 55, 175–185 CrossRef CAS;
(d) K. J. Barnham, C. L. Masters and A. I. Bush, Nat. Rev. Drug Discovery, 2004, 3, 205–214 CrossRef CAS PubMed.
-
(a) W. Shotyk, D. Weiss, P. G. Appleby, A. K. Cheburkin, R. Frei, M. Gloor, J. D. Kramers, S. Reese and W. O. Vanderknaap, Science, 1998, 281, 1635–1640 CrossRef CAS;
(b) J. M. Benoit, W. F. Fitzgerald and A. W. Damman, Environ. Res., 1998, 78, 118–133 CrossRef CAS.
- J. W. Lee, H. S. Jung, P. S. Kwon, J. W. Kim, R. A. Bartsch, Y. Kim and S. J. Kim, Org. Lett., 2008, 10, 3801–3804 CrossRef CAS PubMed.
-
(a) K. Kiyose, H. Kojima, Y. Urano and T. Nagano, J. Am. Chem. Soc., 2006, 128, 6548–6549 CrossRef CAS PubMed.
-
(a) E. W. Miller, A. E. Albers, A. Pralle, E. Y. Isacoff and C. J. Chang, J. Am. Chem. Soc., 2005, 127, 16652–16659 CrossRef CAS PubMed;
(b) J. H. Huang, Y. F. Xu and X. H. Qian, J. Org. Chem., 2009, 74, 2167–2170 CrossRef CAS PubMed.
- C. W. Yu, J. Zhang, J. H. Li, P. Liu, P. H. Wei and L. X. Chen, Microchim. Acta, 2011, 174, 247–255 CrossRef CAS.
- L. Mutihac, J. H. Lee, J. S. Kim and J. Vicens, Chem. Soc. Rev., 2011, 40, 2777–2796 RSC.
- Z. Xu, N. J. Singh, J. Lim, J. Pan, H. N. Kim, S. S. Park, K. S. Kim and J. Yoon, J. Am. Chem. Soc., 2009, 131, 15528–15533 CrossRef CAS PubMed.
- E. L. Que and C. J. Chang, Chem. Soc. Rev., 2010, 39, 51–60 RSC.
-
(a) S. Goswami, S. Maity, A. C. Maity, A. K. Maity, A. K. Das and P. Saha, RSC Adv., 2014, 4, 6300–6305 RSC;
(b) X. Zhang, Y. Shirashi and T. Hirai, Org. Lett., 2007, 9, 5039–5042 CrossRef CAS PubMed;
(c) G. I. Grasso, S. Gentile, M. L. Giuffrida, C. Satriano, C. Sgarlata, M. Sgarzi, G. Tomaselli, G. Arena and L. Prodi, RSC Adv., 2013, 3, 24288–24297 RSC;
(d) M. Boiocchi, L. Fabbrizzi, M. Licchelli, D. Sacchi, M. Vazquez and C. Zampa, Chem. Commun., 2003, 1812–1813 RSC.
-
(a) M. Royzen, Z. Dai and J. W. Canary, J. Am. Chem. Soc., 2005, 127, 1612–1613 CrossRef CAS PubMed;
(b) R. Martinez, A. Espinosa, A. Tarraga and P. Molina, Org. Lett., 2005, 7, 5869–5872 CrossRef CAS PubMed;
(c) D. Maity, A. Raj, D. Karthigeyan, T. K. Kundu and T. Govindaraju, RSC Adv., 2013, 3, 16788–16794 RSC.
-
(a) L. Zeng, E. W. Miller, A. Pralle, E. Y. Isacoff and C. J. Chang, J. Am. Chem. Soc., 2006, 128, 10–11 CrossRef CAS PubMed;
(b) Y. Zhou, F. Wang, Y. Kim, S. J. Kim and J. Yoon, Org. Lett., 2009, 11, 4442–4445 CrossRef CAS PubMed.
- J. Q. Fan, M. M. Hu, P. Zhan and X. J. Peng, Chem. Soc. Rev., 2013, 42, 29–43 RSC.
- M. I. Rodriguez-Caceres, R. A. Agbaria and I. M. Warner, J. Fluoresc., 2005, 15, 185–190 CrossRef CAS PubMed.
- W. H. Melhuish, J. Phys. Chem., 1961, 65, 229–235 CrossRef CAS.
-
(a) P. Kaur, D. Sareen and K. Singh, Talanta, 2011, 83, 1695–1700 CrossRef CAS PubMed;
(b) P. W. Du and S. J. Lippard, Inorg. Chem., 2010, 49, 10753–10755 CrossRef CAS PubMed.
Footnote |
| † Electronic supplementary information (ESI) available: Data include UV-vis spectra, fluorescence quantum yield, association constant and figures of 1H NMR, 13C NMR spectra, ESI-MS and HRMS of compounds 3–8 and probe 1 are available. See DOI: 10.1039/c4ra02050b |
|
| This journal is © The Royal Society of Chemistry 2014 |
Click here to see how this site uses Cookies. View our privacy policy here.