PMMA-g-SOY as a sustainable novel dielectric material

Vijay Kumar Thakura, Mahendra Thungab, Samy A. Madboulybc and Michael R. Kessler*a
aSchool of Mechanical and Materials Engineering, Washington State University, Pullman, WA, USA. E-mail: MichaelR.Kessler@wsu.edu; Fax: +1 0512-259-0104; Tel: +1 0512-259-6972
bDepartment of Materials Science and Engineering, Iowa State University, Ames, IA, USA
cCairo University, Faculty of Science, Chemistry Department, Giza, Egypt

Received 5th March 2014 , Accepted 1st April 2014

First published on 1st April 2014


Abstract

Soy protein (and associated carbohydrate) (SOY) is graft copolymerized with poly(methyl methacrylate) (PMMA) to synthesize novel low cost dielectric materials for multifunctional applications. Graft copolymerization of methyl methacrylate onto pre-activated SOY is carried out using a simple reflux method to form covalently bonded PMMA-g-SOY copolymers. The resulting PMMA-g-SOY is processed into films without employing any toxic chemical solvents. The PMMA-g-SOY films exhibited enhanced storage modulus and a low loss tangent together with promising dielectric properties compared to the pristine PMMA polymer. This strategy may open a new avenue to efficiently use green co-products for multifunctional applications in traditional and structural capacitors.

Introduction

Polymers play an important role in various fields because they offer advantages over conventional materials (metals, ceramic, etc.) in terms of flexibility, ease of handling and processing, lightness, to name a few.1–9 Particularly during the last few years, polymer-based dielectric materials were considered in a number of advanced applications, especially in capacitor materials, electrical insulation materials, organic electronics, and high speed electro-optic (EO) devices.10–16 Different synthetic polymeric systems were used as dielectric materials in engineering applications because they offered remarkable combinations of properties, such as reasonable dielectric permittivity, low dielectric loss, high dielectric breakdown strength, high stability, high volume resistivity, and low shrinking rate.17–21 The use of bio-based materials from renewable resources as one of the components in dielectric polymers has the potential to reduce cost and environmental footprint.22–25 As an alternative to traditional synthetic polymers, hybrids of biobased, green materials and synthetic polymers may offer a number of advantages, especially eco-friendliness, increased functionality, non-toxicity, biodegradability, increased design flexibility, and possibly reduced unit cost.26–28

To date, no detailed study has been carried out on the effective utilization of biobased materials as components of copolymers, in particular on bio-based graft copolymers as dielectric materials. Among various biobased materials, soy flour (SOY) offers the potential to be used as a component in green dielectric materials. SOY is available in excess amounts in the United States as a by-product of the soybean industry.29,30 It generally contains about 56% protein, consisting mainly of acidic amino acids such as aspartic acid, glutamic acid and their corresponding amides together with basic and neutral amino acids and 34% carbohydrates.31,32

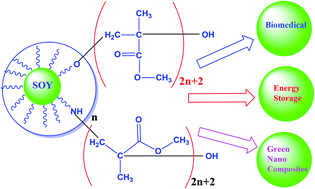
In the present work, SOY was graft copolymerized with methyl methacrylate (MMA) monomer to be used as a novel, dielectric material for electronic/capacitor applications as well as to make the resulting soy based graft copolymer compatible with various polymer matrices for biomedical and green nanocomposites applications. Methyl methacrylate (MMA) was chosen as the reaction monomer because its polymer, poly(methyl methacrylate) (PMMA), is a hard and rigid, transparent polymer with a glass transition temperature of 105 °C, and a well-established polar dielectric material with a high dielectric constant.33–35 PMMA is often used as the preferred dielectric component because of its high dielectric properties, resistance to hydrolysis, good outdoor weather resistance, thermoplastic nature, and ease of molding.36,37 The effects of different parameters of graft copolymer synthesis, such as monomer concentration, reaction time, temperature, solvent and initiator concentration were investigated and correlated with the degree of grafting. Different characterization techniques, such as FTIR, NMR, TGA/DTG, and SEM analysis, were used to verify the formation of the modified soy (PMMA-g-SOY) copolymers. Subsequently, the graft copolymers (PMMA-g-SOY) and pristine PMMA samples were processed into films and their dielectric and dynamic mechanical properties analyzed.

Experimental section

The methyl methacrylate (MMA) monomer was obtained from Fluka/Sigma Aldrich. The radical initiator, ammonium persulphate, and polymethyl methacrylate (PMMA) polymer were also purchased from Sigma Aldrich. The soy protein (and associated carbohydrate) (SOY), was provided by ADM Specialty Products-Oilseeds, Decatur, IL, USA. Sodium hydroxide and sodium metabisulfite were obtained from Fisher Scientific and J. T. Baker Chemical Co. Ltd., respectively.

To produce grafted SOY, sodium hydroxide was continuously added to water to form a solution with a pH between 10 and 12. In the next step, 2.0 g of SOY was added and the mixture was reacted for at least 60 minutes at 95 °C, followed by the addition of sodium metabisulfite into the flask to cleave the disulfide bonds of SOY for about 2 h at 85 °C. The temperature was adjusted to 75 °C and 0.150 g of the ammonium persulphate initiator and monomer (methyl methacrylate) were added. The mixture was then allowed to react at 60 °C for 4 h. After completion of the reaction, the flask was cooled under running tap water and the final product was precipitated with an ethanol solution for 24 h. The rudimentary product was then extracted with acetone for 48 h to remove the homopolymer and any unreacted monomer, dried at 40 °C for 12 h, and subsequently at 70 °C for 48 h to remove water. The percentage of grafting was calculated by the following equation:38,39

 
image file: c4ra01894j-t1.tif(1)
where W: weight of original SOY, Wg: weight of PMMA grafted SOY.

Pure PMMA polymer and PMMA-g-SOY copolymer were initially processed by melt mixing at 230 °C using a twin screw microcompounder from DACA Instruments, CA, USA. The residence time of the melt in the barrel was maintained at 5 minutes to homogenize the melt. The extruded polymer was pelletized and compression molded at 235 °C under pressures >200 PSI (>14 atm) for 5 minutes to prepare films (50 × 50 × 1 mm) using a compression molding machine from Wabash, IN, USA.

The dielectric properties of the pristine PMMA and PMMA-g-SOY copolymer samples were characterized using a Novocontrol dielectric spectrometer with frequency sweeps from 1 Hz to 1 MHz. The dielectric constant and tan[thin space (1/6-em)]δ values of the samples were analyzed using Win Deta software. 1H NMR spectroscopic analysis of SOY and PMMA-g-SOY copolymer was recorded on a Varian spectrometer (Palo Alto, CA) at 300 MHz using deuterated DMSO as the solvent. The FTIR spectra of SOY and PMMA-g-SOY copolymer were recorded on a Nicolet 460 FTIR spectrometer (Madison, WI). The surface morphology of SOY and PMMA-g-SOY copolymer samples was observed with SEM (Quanta FEG 250, FEI, USA) to determine the structural changes. Thermal stability of the samples was studied using thermogravimetric analysis performed on a TA Instruments Q50 thermobalance in nitrogen atmosphere at a heating rate of 20 °C min−1. The dynamical mechanical behavior was characterized on test specimens with dimensions of 20 × 8 × 1 mm using a DMA-Q800 from TA instruments (New Castle, DE, USA) in tensile mode. Temperature sweep tests were carried out between 30 and 200 °C at a frequency of 1 Hz, with strain amplitude of 0.05% and at a heating rate of 3 °C min−1. The storage modulus (E′) and damping coefficient tan[thin space (1/6-em)]δ were measured as a function of temperature.

Results and discussion

Soy protein (and associated carbohydrate) (SOY) generally contains approx. 56% protein (mainly consisting of acidic amino acids such as aspartic acid and glutamic acid and their corresponding amides together with basic and neutral amino acids) and carbohydrates.29–32 The presence of reactive functional groups such as –NH2 and OH makes SOY susceptible to modification through free radical induced graft copolymerization (see Fig. 1).29–32 The proposed graft copolymerization synthesis reaction proceeds in three steps namely: chain initiation; propagation and termination respectively as described in the following section.38–41
image file: c4ra01894j-f1.tif
Fig. 1 Structural representation of SOY composition.

Radical formation

Eqn (2) and (3) depicts the formation of free radicals during graft copolymer synthesis. Ammonium persulphate (APS) generates SO4* (eqn (2)), which reacts in the presence of water (used as solvent in the reaction mixture) and gives OH* free radicals (eqn (3)).42–44
 
O3S–O–O–SO3 → 2SO4* (2)
 
2SO4* + H2O → HSO4 + *OH (3)

Chain initiation

Chain initiation is the first step that takes place during the graft copolymerization synthesis reaction.40–45 During this stage of reaction, the functional groups on the SOY are easily attacked by an ammonium persulphate initiator and form radicals that initiate graft copolymerization of SOY and methyl methacrylate. In the presence of the initiator, the free macroradicals are added to the double bond of the monomer, which results in the formation of a covalent bond between monomer and the SOY backbone with the creation of a free radical on to the monomer resulting in the initiation of graft copolymerization reaction.40–45 Further reaction of these free radical species with methyl methacrylate monomer and the SOY backbone results in the generation of active sites on the reaction moieties (eqn (4)–(6)). The radical formation can occur individually/simultaneously either on the soy backbone or on the monomer to be grafted first.
 
image file: c4ra01894j-u1.tif(4)
 
image file: c4ra01894j-u2.tif(5)
 
image file: c4ra01894j-u3.tif(6)

Chain propagation

Chain propagation is the intermediate step during the free radical graft copolymerization synthesis reaction.40–45 During this stage of the reaction, subsequent addition of MMA monomer molecules to the initiated chain propagates grafting onto the SOY backbone resulting in growing active chains. Eqn (7) through (9) provide a detailed description of the chain propagation reactions during the graft copolymerization steps:40–45
 
image file: c4ra01894j-u4.tif(7)
 
image file: c4ra01894j-u5.tif(8)
 
image file: c4ra01894j-u6.tif(9)

Chain termination

Chain termination is the last step during graft copolymerization synthesis.40–45 During the chain termination stage, reaction between the active SOY backbone and growing MMA monomer chains formed during the propagation steps gives the desired graft copolymer (eqn (10)).
 
image file: c4ra01894j-u7.tif(10)
 
image file: c4ra01894j-u8.tif(11)

Along with the formation of the graft copolymer, some homopolymers also formed during the termination reaction and that is easily removed through the soxhlet extraction method.

Various reaction parameters, such as solvent amount, time, temperature, initiator, and monomer concentration were optimized to maximize the degree of grafting (127%)40–45 (see corresponding descriptions in the ESI). For all the study carried out in this work, optimized grafted (127%) sample was used.

Chemical characterization of pristine and PMMA-g-SOY copolymer

FTIR spectra of SOY and PMMA-g-SOY are shown in Fig. 2. Fig. 2 shows that SOY exhibited strong and broad O–H as well as N–H stretching bands between 3300 and 3600 cm−1, a strong band at 1668 cm−1 caused by the C[double bond, length as m-dash]O stretching of the amide group (amide-I), and a band at 1551 cm−1 that is predominantly attributed to N–H bending (amide-II). In contrast, the spectrum of PMMA-g-SOY exhibited a new carbonyl stretching band at 1740 cm−1 and new bands at 1155 and 1247 cm−1 caused by C–O stretching of poly(MMA) onto soy. Both FTIR spectra and gravimetric studies indicated that grafting of the MMA monomer to SOY was successful. FTIR spectrum of the PMMA-g-SOY samples with different percentage of grafting obtained during optimization of different reaction parameters were also analyzed (ESI Fig. S6). From the figure it is clear that the PMMA was successfully graft copolymerized on the SOY samples during the optimization of reaction parameters and all the samples showed a variation in the intensity of FTIR peaks depending upon the percentage grafting.
image file: c4ra01894j-f2.tif
Fig. 2 FTIR spectra of pristine SOY and PMMA-g-SOY.

The 1H NMR spectra also confirmed the polymeric structure of the PMMA-g-SOY copolymers. Fig. 3 shows 1H-NMR spectra of SOY and PMMA-g-SOY with optimized grafting. The peaks at 5.19, 4.75, 4.48, 3.83, and 2.49, 1.97, 1.23 ppm are the characteristic peaks of NH2, SH, and hydroxy groups present in the soy flour. The functional groups (i.e., amino and hydroxyl) were exposed during the synthesis and reacted with MMA monomer, causing new NMR signals with different intensities after graft copolymerization was completed. Thus, NMR results also confirmed that PMMA-g-SOY was successfully synthesized.


image file: c4ra01894j-f3.tif
Fig. 3 1H NMR spectra of pristine SOY and PMMA-g-SOY.

Raman spectra of the pristine and PMMA-g-SOY was also studied to further confirm the successful grafting of PMMA onto pristine SOY. Fig. 4(a and b) shows the Raman spectra of pristine PMMA and PMMA-g-SOY. After the graft copolymerization synthesis reaction, the spectra of PMMA-g-SOY showed significant changes that specify the successful graft copolymerization through covalent bonding. Raman spectra of SOY showed the characteristics peaks of pristine soybean flour sample. There was intensity variation in the bands due to the different composition of SOY that contains proteins as well as carbohydrates. The peaks at 1507 cm−1 and 1601 cm−1 can be assigned to the glutamic acid and phenylalanine. Other peaks were also related to the SOY composition and agree with those reported in the literature.46 On the other hand in comparison to the pristine SOY, the grafted SOY sample i.e. PMMA-g-SOY showed the presence of some prominent peaks at 1125 cm−1, 1655 cm−1, 2926 cm−1 and 3061 cm−1 confirming the successful grafting of PMMA chains onto the SOY backbone polymer. Along with these prominent bands, few intrinsic peaks of SOY were diminished that were affected by the graft copolymer synthesis reaction.


image file: c4ra01894j-f4.tif
Fig. 4 (a) Raman spectra of pristine SOY. (b) Raman spectra of PMMA-g-SOY.

Thermogravimetric analysis of pristine SOY and PMMA-g-SOY was carried out as a function of % weight loss versus temperature in nitrogen atmosphere. Three distinct decomposition stages were observed in the thermal degradation profile of pure SOY. The first stage of decomposition occurred in the temperature range from 49.5 to 200 °C causing a weight loss of 7.4%; the second stage of decomposition occurred between 201 and 500 °C with a weight loss of 65.3%; and the final degradation stage occurred between 501 and 894 °C with a weight loss of 7.5% (Fig. 5a).


image file: c4ra01894j-f5.tif
Fig. 5 (a) TGA/DTG of pristine SOY. (b) TGA/DTG of pristine SOY and PMMA-g-SOY.

The first-stage of decomposition in SOY corresponded to the elimination of water and the dissociation of the quaternary structure of proteins and carbohydrates. The second phase of decomposition involved the cleavage of peptide bonds of amino acid residues and the dissociation of different bonds in protein and carbohydrate moieties. The final phase of decomposition of SOY involved the complete decomposition of proteins and carbohydrates, with the liberation of various gases, such as CO, CO2, and NH3. The residual wt% for pure SOY left after the third degradation stage was attributed to the formation of carbon char.

The TGA tests were performed under inert atmosphere, so the SOY transformed into carbon at high temperatures instead of going through complete oxidation. Compared to pristine soy flour, the PMMA-g-SOY (Fig. 5b) exhibited a two-phase thermal decomposition in the temperature range from 250 to 455 °C (84.2% weight loss) and from 456.1 to 890 °C (6.4% weight loss). The temperature for 10% weight loss was measured as 222 °C and 328 °C for SOY before and after grafting, respectively. The significant increase in temperature for 10% weight loss was attributed to the enhancement in thermal stability of the SOY after graft copolymerization, confirming the successful formation of PMMA-g-SOY copolymers through covalent bonding. The DTG analysis of the thermal decomposition of SOY showed exothermic peaks at 71.7 °C (0. 10%/°C), 242.2 °C (0.31%/°C), and 307.8 °C (0.54%/°C), while for PMMA-g-SOY, decomposition occurred at 333.9 °C (0.1838%/°C), 419.80 °C (1.332%/°C), and 797.8 °C (0.072%/°C). The DTG results showed that the rate of thermal decomposition was higher for soy flour than for PMMA-g-SOY, thus supporting the TGA results.

SEM images of pristine SOY and PMMA-g-SOY copolymers are shown in Fig. 6(a and b). These micrographs demonstrated the clear morphological differences in SOY and PMMA-g-SOY copolymers. The sharp changes in the morphology of the SOY prior to and after graft copolymerization were attributed to the incorporation of PMMA chains into peptide/S–S linkages and OH groups of SOY through covalent bonding, resulting in a complete change of structural properties of the SOY backbone.40–45 These results are further supported by SEM images of the fracture surfaces of the pristine PMMA and the PMMA-g-SOY copolymers films after melt processing as shown in Fig. 7.


image file: c4ra01894j-f6.tif
Fig. 6 Scanning electron micrographs of (a) pristine SOY and (b) PMMA-g-SOY.

image file: c4ra01894j-f7.tif
Fig. 7 SEM images of the fracture surfaces of the pristine PMMA and the PMMA-g-SOY copolymers films after melt processing.

Fig. 7 shows the SEM images of the fracture surfaces of the pristine PMMA and the PMMA-g-SOY copolymers films after melt processing. The fracture surface showed an irregular topography with sharp crack edges for pure PMMA when compared to PMMA-g-SOY copolymers. The rough fracture surfaces of pure PMMA could be attributed to the inherent brittle nature of the materials. The fracture surface of PMMA-g-SOY copolymers seems to be comparable with pure PMMA. However, a distinct difference in the microstructure between the investigated materials can be identified in high magnification SEM images placed as insets in Fig. 7. The high magnification microstructure of pure PMMA reveals characteristic white spots on the fracture surface. These spots indicate yielding in the material due to stress localization prior to crack initiation in PMMA. Whereas, the high magnification image of PMMA-g-SOY shows fine dispersion of SOY in PMMA/SOY copolymer phase. Generally, blending SOY in PMMA may result in showing macroscopic agglomerations of SOY in PMMA matrix. The strong physical interactions between SOY–SOY filler limit the dispersion of SOY in PMMA. However, grafting SOY with PMMA results in dominating the SOY–SOY interactions as SOY is chemically bonded to PMMA after grafting. Hence the newly formed covalent bonds play a significant role in controlling the dispersion SOY in the polymer matrix.

Dynamic-mechanical analysis (DMA) of PMMA-g-SOY copolymers

Fig. 8(a and b) shows the storage modulus (E′) and the damping coefficient (tan[thin space (1/6-em)]δ = E′′/E′) of pristine PMMA and PMMA-g-SOY copolymer films as a function of temperature respectively. The DMA curves for these samples were obtained from rectangular-shaped specimens subjected to a heating cycle with a rate of 3 °C min−1 at a frequency of 1 Hz. The curves depict the influence of PMMA grafting on the glass transition behavior and storage modulus of pure PMMA.33–35 The characteristic regimes of the temperature dependent elastic modulus reveal a glassy plateau, followed by a glass transition and a terminal response above glass transition. A glass transition temperature is identified by a strong inclination in the E′ curves and a decrease in the modulus of the samples above glass transition temperature; the different slope is caused by the onset of terminal relaxation in the polymer chains. Another important characteristic obtained from the tan[thin space (1/6-em)]δ curves of both the pristine and the graft copolymer curves is their respective glass-transition temperature (Tg). The peak in the tan[thin space (1/6-em)]δ curve corresponds to the Tg of the PMMA phase in the PMMA-g-Soy copolymer; it increased from 128 °C in pure PMMA to 139 °C in the copolymer. In addition to the shift in Tg to high temperatures, the peak intensity also increased in PMMA-g-SOY compared to pure PMMA.
image file: c4ra01894j-f8.tif
Fig. 8 (a) The storage modulus (E′) and the damping coefficient (tan[thin space (1/6-em)]δ = E′′/E′) of pristine PMMA. (b) The storage modulus (E′) and the damping coefficient (tan[thin space (1/6-em)]δ = E′′/E′) of PMMA-g-SOY.

In general, the peak intensity of Tg in the tan[thin space (1/6-em)]δ curve is inversely proportional to the volume fraction of the confined polymer segments in the bulk polymer.33–35 This increase in storage modulus and Tg of PMMA-g-SOY copolymers was primarily attributed to the formation of strong covalent bonds between the SOY and MMA monomers, resulting in a decrease in segmental mobility of the PMMA chains. In addition, the increase in storage modulus was attributed to the reinforcement effect of the soy flour.

Dielectric analysis of PMMA-g-SOY copolymers

Polymer based dielectric materials have attracted considerable interest in number of applications ranging from electronic to energy storage in multifunctional capacitors due to their inherent advantages such as design flexibility, low cost, ease of fabrication, functionality, improved reliability and suitable electrical/mechanical performance.33–35,44–48 However most of the dielectric materials presently being used are obtained from the petrochemical resources. In the present work we explore the use of SOY as sustainable low cost dielectric materials for possible applications in multifunctional capacitor and other electronic/polymer nanocomposites systems.

Fig. 9 shows the dielectric constant (ε′) and the dielectric loss tangent (tan[thin space (1/6-em)]δ = ε′′/ε′) of pure PMMA and PMMA-g-SOY copolymer films measured at room temperature (25 °C) as a function of frequency, respectively.


image file: c4ra01894j-f9.tif
Fig. 9 Dependence of dielectric constant and dielectric loss tangent of PMMA and PMMA-g-SOY on the frequency at 25 °C.

The electric field was applied perpendicular to the plane of the samples. Fig. 9 shows that the dielectric constant of the PMMA-g-SOY copolymer is slightly lower than that of the pristine PMMA polymer, indicating that graft copolymerization of SOY does not negatively affect the inherent dielectric properties of PMMA. The dielectric constant decreased with increase in frequency, which is expected in polymeric systems.35–39 The change in dielectric constant with frequency was attributed to the interfacial polarization in the system; however, at higher frequencies the electric field changed too fast to sustain the polarization effects so that the contribution to the dielectric constant was minimal. These results are consistent with previous results for other copolymeric systems.35–39 It is also interesting to note that the peak maximum in tan[thin space (1/6-em)]δ, which is related to the local relaxation process of PMMA, decreased slightly and shifted to lower frequencies in PMMA-g-SOY. This effect was attributed to the decreased mobility of the partial rotation of the –COOCH3 side groups around the C–C bonds in the PMMA-g-SOY copolymer chains. It matches earlier reports35−39 to the dielectric constant was minimal. These results are consistent with previous results for other copolymeric systems.35,38,39

The effect of temperature on the dielectric properties, such as dielectric constant and tan[thin space (1/6-em)]δ, was also studied to confirm the dielectric properties of the polymer/graft copolymer system. Fig. 10 shows the comparative temperature-dependence of dielectric constant (ε′) and tan[thin space (1/6-em)]δ for pristine PMMA and the PMMA-g-SOY copolymer specimens as a function of temperature at a frequency of 10 kHz.


image file: c4ra01894j-f10.tif
Fig. 10 Dependence of dielectric constant and dielectric loss tangent of PMMA and PMMA-g-SOY on temperature at a frequency of 10 kHz.

On the other hand Fig. 11 and 12 show the dependence of dielectric constant (ε′) and dielectric loss ε′′ as a function of temperature at varying frequencies ranging from 10−2 to 107 frequency for pure PMMA and the PMMA-g-SOY copolymer specimens respectively.35 The temperature in all these measurements was increased from 10 to 140 °C in 5 °C increments. The dielectric constant increased with increasing temperature; this behavior can be explained by the fact that with an increase in temperature the segmental mobility of the polymers/graft copolymer systems increased, which facilitated the orientation of dipoles, resulting in the increment in dielectric properties35,38,39 (Fig. 11 and 12). The dielectric constants of PMMA and PMMA-g-SOY are identical in the glassy state (T ≤ 80 °C). At higher temperatures (80 to 130 °C) the dielectric constant of pure PMMA is higher than that of PMMA-g-SOY because of the lower Tg of PMMA that allows for higher mobility of the polymer chains (Fig. 11 and 12).35


image file: c4ra01894j-f11.tif
Fig. 11 Dependence of dielectric constant/dielectric loss of pristine PMMA on temperature at different frequencies.

image file: c4ra01894j-f12.tif
Fig. 12 Dependence of dielectric constant/dielectric loss of PMMA-g-SOY on temperature at different frequencies.

In addition, the mobility of ionic carriers, the polarization in the amorphous phase, and the development of space charges at elevated temperatures contributed to an increase in dielectric permittivity of the polymer/graft copolymer system.35,38,39 With increase in temperature up to 110 °C, dielectric loss ε′′ also increased, but then decreased again because of the glass relaxation process (α-relaxation).35 The α-relaxation process of pure PMMA occurred at a temperature approx. 20 °C lower than for the PMMA-g-SOY at 10 kHz (Fig. 10) because the Tg of PMMA-g-SOY was higher than the Tg for PMMA (see DMA analysis).

Conclusions

We demonstrated the successful synthesis of PMMA-g-SOY copolymers using free radical induced copolymerization and characterized the graft copolymers using various experimental techniques. The PMMA-g-SOY copolymer exhibited promising dielectric properties and a very high storage modulus indicating the potential of the PMMA-g-SOY as a novel, low-cost material substituting pristine synthetic polymers. From an environmental and economic point of view, bio-based PMMA-g-SOY copolymers with sufficient grafting may open a new direction in the field of green, dielectric materials and for other practical applications which may also include biomedical and green nanocomposites.

References

  1. Z.-M. Dang, J.-K. Yuan, J.-W. Zha, T. Zhou, S.-T. Li and G.-H. Hu, Prog. Mater. Sci., 2012, 57, 660–723 CrossRef CAS.
  2. V. K. Thakur, G. Ding, J. Ma, P. S. Lee and X. Lu, Adv. Mater., 2012, 24, 4071–4096 CrossRef CAS.
  3. Z.-M. Dang, J.-K. Yuan, S.-H. Yao and R.-J. Liao, Adv. Mater., 2013, 25, 6334–6365 CrossRef CAS.
  4. Z.-M. Dang, T. Zhou, S.-H. Yao, J.-K. Yuan, J.-W. Zha, H.-T. Song, J.-Y. Li, Q. Chen, W.-T. Yang and J. Bai, Adv. Mater., 2009, 21, 2077–2082 CrossRef CAS.
  5. X. Huang, M. Feng and X. Liu, RSC Adv., 2014, 4, 4985–4992 RSC.
  6. K. Hayashida, RSC Adv., 2013, 3, 221–227 RSC.
  7. B. Chu, X. Zhou, K. Ren, B. Neese, M. Lin, Q. Wang, F. Bauer and Q. M. Zhang, Science, 2006, 313, 334–336 CrossRef CAS.
  8. A. Chandran, J. Prakash, P. Ganguly and A. M. Biradar, RSC Adv., 2013, 3, 17166–17173 RSC.
  9. F. He, C. Yuan, K. Li, S. Diao, K. Jin, J. Wang, J. Tong, J. Ma and Q. Fang, RSC Adv., 2013, 3, 23128–23132 RSC.
  10. S. Nayak, B. Sahoo, T. K. Chaki and D. Khastgir, RSC Adv., 2013, 3, 2620–2631 RSC.
  11. S. Nayak, B. Sahoo, T. K. Chaki and D. Khastgir, RSC Adv., 2014, 4, 1212–1224 RSC.
  12. N. Ning, X. Bai, D. Yang, L. Zhang, Y. Lu, T. Nishi and M. Tian, RSC Adv., 2014, 4, 4543–4551 RSC.
  13. Z.-M. Dang, L. Wang, Y. Yin, Q. Zhang and Q.-Q. Lei, Adv. Mater., 2007, 19, 852–857 CrossRef CAS.
  14. X. Dou, X. Liu, Y. Zhang, H. Feng, J.-F. Chen and S. Du, Appl. Phys. Lett., 2009, 95, 132904 CrossRef.
  15. Y. H. Zhang, S. G. Lu, Y. Q. Li, Z. M. Dang, J. H. Xin, S. Y. Fu, G. T. Li, R. R. Guo and L. F. Li, Adv. Mater., 2005, 17, 1056–1059 CrossRef CAS.
  16. P. Kim, N. M. Doss, J. P. Tillotson, P. J. Hotchkiss, M.-J. Pan, S. R. Marder, J. Li, J. P. Calame and J. W. Perry, ACS Nano, 2009, 3, 2581–2592 CrossRef CAS.
  17. P. Kim, S. C. Jones, P. J. Hotchkiss, J. N. Haddock, B. Kippelen, S. R. Marder and J. W. Perry, Adv. Mater., 2007, 19, 1001–1005 CrossRef CAS.
  18. M.-F. Lin, V. K. Thakur, E. J. Tan and P. S. Lee, RSC Adv., 2011, 1, 576 RSC.
  19. V. K. Thakur, M.-F. Lin, E. J. Tan and P. S. Lee, J. Mater. Chem., 2012, 22, 5951 RSC.
  20. M. Arbatti, X. Shan and Z. Cheng, Adv. Mater., 2007, 19, 1369 CrossRef CAS.
  21. L. Xie, X. Huang, C. Wu and P. Jiang, J. Mater. Chem., 2011, 21, 5897–5906 RSC.
  22. C. K. Hong and R. P. Wool, J. Appl. Polym. Sci., 2005, 95, 1524–1538 CrossRef CAS.
  23. L. Yu, Y. Zhang, W. Tong, J. Shang, B. Shen, F. Lv and P. K. Chu, RSC Adv., 2012, 2, 8793–8796 RSC.
  24. M. Zhan and R. P. Wool, J. Appl. Polym. Sci., 2010, 118, 3274–3283 CrossRef CAS.
  25. M. Zhan, R. P. Wool and J. Q. Xiao, Composites, Part A, 2011, 42, 229–233 CrossRef.
  26. A. S. Singha, A. K. Rana and R. K. Jarial, Mater. Des., 2013, 51, 924–934 CrossRef CAS.
  27. A. Triki, M. Guicha, M. Ben Hassen and M. Arous, J. Appl. Polym. Sci., 2013, 129, 487–498 CrossRef CAS.
  28. I. Ben Amor, M. Arous and A. Kallel, J. Electrost., 2014, 72, 156–160 CrossRef CAS.
  29. S. Chabba, G. F. Matthews and A. N. Netravali, Green Chem., 2005, 7, 576–581 RSC.
  30. T. G. Dastidar and A. N. Netravali, Green Chem., 2013, 15, 3243–3251 RSC.
  31. W. J. Wolf, J. Agric. Food Chem., 1970, 18, 969–976 CrossRef CAS.
  32. S. N. Swain, S. M. Biswal, P. K. Nanda and P. L. Nayak, J. Polym. Environ., 2004, 12, 35–42 CrossRef CAS.
  33. E. A. Stefanescu, X. Tan, Z. Lin, N. Bowler and M. R. Kessler, Polymer, 2010, 51, 5823–5832 CrossRef CAS.
  34. E. A. Stefanescu, X. Tan, Z. Lin, N. Bowler and M. R. Kessler, Polymer, 2011, 52, 2016–2024 CrossRef CAS.
  35. V. K. Thakur, D. Vennerberg, S. A. Madbouly and M. R. Kessler, RSC Adv., 2014, 4, 6677–6684 RSC.
  36. C. S. Reddy, A. Zak and E. Zussman, J. Mater. Chem., 2011, 21, 16086–16093 RSC.
  37. M. Li, X. Huang, C. Wu, H. Xu, P. Jiang and T. Tanaka, J. Mater. Chem., 2012, 22, 23477–23484 RSC.
  38. V. K. Thakur, E. J. Tan, M.-F. Lin and P. S. Lee, J. Mater. Chem., 2011, 21, 3751 RSC.
  39. V. K. Thakur, E. J. Tan, M.-F. Lin and P. S. Lee, Polym. Chem., 2011, 2, 2000 RSC.
  40. H.-P. Li, B.-G. Ma, S.-M. Zhou, L.-M. Zhang and J.-Z. Yi, Colloid Polym. Sci., 2010, 288, 1419–1426 CAS.
  41. B. S. Kaith, R. Jindal and J. K. Bhatia, J. Appl. Polym. Sci., 2011, 120, 2183–2190 CrossRef CAS.
  42. V. K. Thakur, M. K. Thakur and R. K. Gupta, Carbohydr. Polym., 2013, 97, 18–25 CrossRef CAS.
  43. V. K. Thakur, M. K. Thakur and R. K. Gupta, Carbohydr. Polym., 2013, 98, 820–828 CrossRef CAS.
  44. V. K. Thakur, M. K. Thakur and R. K. Gupta, Carbohydr. Polym., 2014, 104, 87–93 CrossRef CAS.
  45. V. K. Thakur, M. K. Thakur and R. K. Gupta, Int. J. Biol. Macromol., 2013, 61, 121–126 CrossRef CAS.
  46. H. Lee, B.-K. Cho, M. S. Kim, W.-H. Lee, J. Tewari, H. Bae, S.-I. Sohn and H.-Y. Chi, Sens. Actuators, B, 2013, 185, 694–700 CrossRef CAS.
  47. J.-K. Yuan, Z.-M. Dang, S.-H. Yao, J.-W. Zha, T. Zhou, S.-T. Li and J. Bai, J. Mater. Chem., 2010, 20, 2441–2447 RSC.
  48. J. Li, J. Claude, L. E. Norena-Franco, S. I. Seok and Q. Wang, Chem. Mater., 2008, 20, 6304 CrossRef CAS.

Footnote

Electronic supplementary information (ESI) available: Fig. S1 to S5: optimization of various reaction parameters for maximum percentage graft copolymerization of MMA onto SOY. Fig. S6 FTIR of pristine SOY and PMMA-g-SOY with different percentage of grafting. Fig. S7–S10: TGA/DTG of PMMA-g-SOY with different percentage of grafting. See DOI: 10.1039/c4ra01894j

This journal is © The Royal Society of Chemistry 2014
Click here to see how this site uses Cookies. View our privacy policy here.