Double-walled TiO2 nanotubes prepared with NH4BF4 based electrolyte and their photoelectrochemical performance

Hui Li, Junheng Xing, Zhengbin Xia* and Jiangqiong Chen
School of Chemistry and Chemical Engineering, South China University of Technology, Guangzhou 510641, China. E-mail: cezhbxia@scut.edu.cn; Fax: +86 20 8711 2093; Tel: +86 20 8711 2047

Received 3rd March 2014 , Accepted 12th May 2014

First published on 13th May 2014


Abstract

Highly ordered anodic single-walled TiO2 nanotubes (SW-TiO2 NTs) and double-walled TiO2 nanotubes (DW-TiO2 NTs) are prepared in the unique NH4BF4 based electrolyte. The formation of SW-TiO2 NTs and DW-TiO2 NTs can be simply tuned by the voltages. The DW-TiO2 NTs show higher photoelectrochemical performance than the SW-TiO2 NTs.

Over the past two decades, TiO2 nanotubes (NTs) prepared by the electrochemical anodization method have attracted great attention in the fields of photocatalysis,1,2 solar cells,3–5 sensors6,7 and Li-ion batteries.8 Generally, fluoride ions of the aqueous or organic electrolytes are deemed to be the essential ingredient to fabricate anodic TiO2 NTs.9–12 However, Schmuki et al. and others recently demonstrated that the self-organized TiO2 NTs could be also formed in ionic liquid (such as BMIM-BF4) based electrolytes, which paved a way for the alternative preparation of TiO2 NTs by using fluoride ions free electrolytes.13–15 It should be noted that the ionic liquid used in their study was very expensive and the structure of the obtained TiO2 NTs was irregular, which hindered further development of this method.

The surface area is a crucial factor for the enhancement of photoconversion efficiency of TiO2 NTs. Double-walled TiO2 nanotubes (DW-TiO2 NTs), which possess much higher surface area than the traditional single-walled TiO2 nanotubes (SW-TiO2 NTs), are considered to be one of the most promising nanostructures for photoelectrochemical (PEC) applications. Recently, Albu et al. reported the fabrication of obvious DW-TiO2 NTs through heating processing.16 Misra et al. fabricated the DW-TiO2 NTs by sonoelectrochemical anodization using ionic liquid, and the formed DW-TiO2 NTs showed superb water splitting efficiency.17 However, in their study, the formed DW-TiO2 NTs are length limited and disordered, and the anodization system cannot perform well at high voltages. Up to date, no work has been reported on tuning the formation of SW-TiO2 NTs and DW-TiO2 NTs in specific electrolyte with effective strategies.

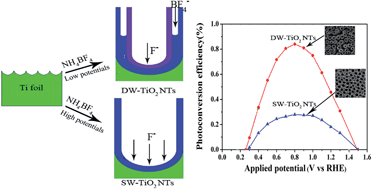
In this paper, we firstly report the fabrication of highly ordered DW-TiO2 NTs and SW-TiO2 NTs via two-step anodization method in the NH4BF4 based electrolyte rather than in the conventional fluoride ions containing electrolyte. The obtained DW-TiO2 NTs achieve high photoconversion efficiency of about 0.84% under illumination of stimulated solar light (AM1.5, 100 mW cm−2).

The two-step anodization is the most convenient method to prepare highly ordered hierarchical top-porous and bottom-tubular TiO2 nanostructures.18–21 Fig. 1 shows the SEM and TEM images of the TiO2 NTs obtained at various voltages. The TiO2 NTs obtained at 60 V show the obvious dual hierarchical structure. Holes with average diameter (D) of about 40 nm are uniformly distributed in the upper layer (Fig. 1a) and the topology of the bottom layer displays the apparent double-walled structure with the inner pore diameter of 40 nm, outer pore diameter of 100 nm, and the length of around 800 nm (Fig. 1b). The double-walled TiO2 NTs can be also found in TEM image (Fig. 1c). For the TiO2 NTs formed at 80 V, the nanopores diameter (D = 50 nm) of the upper layer increases with voltages (Fig. 1d), and the bottom tubular layer shows the single-wall/double-wall combined transition state. The thickness of bottom layer is about 2 μm with the internal diameter, external diameter of 50 nm, 100 nm separately (Fig. 1e), which is in accordance with the TEM image (Fig. 1f). The results suggest that the length of the TiO2 NTs increases with potentials, which is consistent with the reports that the nanotubes length is proportional to the applied voltages for the same anodization duration.22,23 The hexagonal pores size (D = 120 nm) increases as the voltages increases to 100 V (Fig. 1g), and the bottom layer shows the obvious single-walled structure with the nanopores diameter of 150 nm and the tube length of approximately 2.5 μm (Fig. 1h). In TEM image the single wall thickness of 8 nm can be directly observed (Fig. 1i). In short, these results show that it can easily control the transformation of the TiO2 NTs from double-wall to single-wall by tuning the applied voltages.


image file: c4ra01857e-f1.tif
Fig. 1 SEM images of the upper layer, the bottom layer and TEM images of TiO2 NTs grown at: 60 V (a–c), 80 V (d–f) and 100 V (g, h and i). The upright insets in (b), (e) and (h) show the cross-sectional views of the corresponding TiO2 NTs.

Fig. 2a shows the XRD results of the unannealed and annealed samples. The unannealed sample prepared at 80 V is amorphous, while the samples formed at various potentials and were subsequently annealed at 450 °C for 2 h present the anatase phases. Fig. 2b reveals the double peaks at 458.6 and 464.3 eV, corresponding to the Ti 2p3/2 and Ti 2p1/2 of the Ti4+ (TiO2), respectively.24 The O 1s XPS peak of the formed TiO2 NTs in Fig. 2c can be separated with two distinct peaks, the dominant peak at 529.7 eV is in agreement with O 1s electron binding energy for TiO2, whereas the weak peak at 531.3 eV suggests the formation of F–Ti–O or N–Ti–O structures.25 As shown in Fig. 2d, the presence of a broad peak around 400.09 eV implies the state of the doped nitrogen TiO2.26,27 Fig. 2e shows a single peak of B 1s at 192.4 eV, which is attributed to Ti–O–B interstitial boron.28,29 A pair of peaks at 685.1 and 688.7 eV are observed for F 1s (Fig. 2f), which can be assigned to the metal–fluoride bonding such as Ti–F and the doped F atoms in the TiO2 matrix, respectively.30–32 To sum up, the XPS results reveal that the nonmetal elements of N, F and B are doped into the obtained TiO2 NTs.


image file: c4ra01857e-f2.tif
Fig. 2 XRD patterns of the as-prepared and annealed TiO2 NTs obtained at different voltages unannealed and annealed in oxygen at 450 °C for 2 h (a), and Ti 2p (b), O 1s (c), N 1s (d), B 1s (e), F 1s (f) XPS spectra of TiO2 NTs prepared at 80 V for 1 h.

The UV-vis diffuse reflectance absorption spectra (DRS) of as-prepared samples are shown in Fig. 3. The slightly red shifts of the absorption edge are observed for the prepared samples compared with the reported pure anatase TiO2 (about 400 nm), indicating the band gaps of all samples are definitely narrowed, which may be due to the anion (N, F and B) doping effect discussed in the above XPS. Moreover, the DW-TiO2 NTs show much higher light absorption in visible light region than the SW-TiO2 NTs. This is ascribed to the DW-TiO2 NTs possess larger specific surface area in comparison with the SW-TiO2 NTs for effective light trapping. It is worth noting that the absorbance in the visible region of the DW-TiO2 NTs formed at 80 V (DW80V-TiO2 NTs) is stronger than that of the DW-TiO2 NTs formed at 60 V (DW60V-TiO2 NTs). The enhanced ability of the DW-TiO2 NTs to absorb visible light makes it a promising photocatalyst for solar-driven applications.


image file: c4ra01857e-f3.tif
Fig. 3 UV-vis diffuse reflectance spectra of DW60V-TiO2 NTs, DW80V-TiO2 NTs and SW100V-TiO2 NTs.

Prior to the PEC measurements, the thin upper layer of the samples were ultrasonically removed for simply discussing the influences of single-walled and double-walled structures on the PEC performance of TiO2 NTs. Fig. 4a shows that the photocurrent of the DW-TiO2 NTs formed at the voltages of 80 V and 60 V are much higher than that of the SW-TiO2 NTs fabricated at the voltage of 100 V, which means that the photoresponse and the charge transport properties of the DW-TiO2 NTs are better than that of the SW-TiO2 NTs. Moreover, as shown in Fig. 4b, the photocurrent density of the DW80V-TiO2 NTs, DW60V-TiO2 NTs is 1.60 and 0.96 mA cm−2 at 1.23 V (vs. RHE), about 166% and 60% higher than that of the SW100V-TiO2 NTs. The DW80V-TiO2 NTs show more excellent PEC performance than the DW60V-TiO2 NTs, due to that the DW80V-TiO2 NTs possess much more aligned tubular structure than the DW60V-TiO2 NTs, which can reduce the recombination of the electrons and holes.


image file: c4ra01857e-f4.tif
Fig. 4 Photoelectrochemical properties of DW60V-TiO2 NTs, DW80V-TiO2 NTs, SW100V-TiO2 NTs electrodes: amperometric It curves at an applied potential of 1.23 V (vs. RHE) (a), linear-sweep voltammograms with scanning rate of 5 mV s−1 (b), and photoconversion efficiency as a function of applied potentials (c).

The hydrogen production efficiency of the obtained TiO2 NTs is calculated via the following equation:33

image file: c4ra01857e-t1.tif
where ε0 is the photoconversion efficiency, jp is the photocurrent density (mA cm−2), I0 means the intensity of the incident light, E0rev represents the standard reversible potential (1.23 V vs. RHE), and |Eapp| denotes the absolute value of the applied voltage which is obtained from Eapp = EmeasEaoc, where Emeas is the electrode potential (vs. Ag/AgCl) at which jp is measured and Eaoc is the electrode potential (vs. Ag/AgCl) at open circuit under illumination. Plots of photoconversion efficiency with applied potential are shown in Fig. 4c. The DW80V-TiO2 NTs, DW60V-TiO2 NTs, SW100V-TiO2 NTs show maximum efficiencies of 0.84%, 0.46%, 0.25% at 0.8 V (vs. RHE), respectively, which means that the DW-TiO2 NTs show better photocatalysis performance than the SW-TiO2 NTs. A possible explanation for this is that the DW-TiO2 NTs have larger surface area, more porous structure and better light absorption in comparison with the SW-TiO2 NTs.

To understand the bulk diffusion and surface charge transfer characteristics and reveal the differences in the PEC activity of the as-prepared samples, photoluminescence (PL) technique has been used to determine the efficiency of charge carriers trapping, migration and transfer due to the PL signals of the semiconductor materials, resulting from the recombination of photoexcited charge carriers.34,35 As shown in Fig. 5, all samples display PL peaks at around 420 nm. The PL intensity of DW80V-TiO2 NTs and DW60V-TiO2 NTs are all much slower than that of the SW100V-TiO2 NTs. These results demonstrate that the double-walled structure effectively inhibits the photoexcited charge recombination. Furthermore, the DW80V-TiO2 NTs exhibit a weaker PL intensity compared with the DW60V-TiO2 NTs. It can be attributed to that the well ordered structure of DW80V-TiO2 NTs facilitate the separation of electron–hole pairs.


image file: c4ra01857e-f5.tif
Fig. 5 Photoluminescence (PL) spectra of DW60V-TiO2 NTs, DW80V-TiO2 NTs and SW100V-TiO2 NTs.

The mechanisms of the formation of the DW-TiO2 NTs and SW-TiO2 Ns prepared at various anodizing voltages in the NH4BF4 based electrolyte is discussed briefly. Firstly, the anion BF4 are partly decomposed to release the fluoride ions into the electrolyte under the high electric field. Subsequently, two types of pitting take place on the well-textured Ti surface during the initial stage of the second-step of anodization process because of the different etching ability of the BF4 and F.17 The electric field distribution in the curved bottom of the imprint pores is larger than that in the edge of the concave holes, which causes the decomposed F enrich in the bottom rather than in the fringe of the pore (Fig. 6a). The produced F are more prone to react with Ti and TiO2 at the centre of the concavity than BF4, thus the bottom pore grows deeper with the fast etching rate of F, meanwhile, the voids occur at the surrounding walls of the pores and continue grow to be tubes with the slow etching rate of BF4. Thereafter, the double-walled NTs which consist of longer inner tubes and shorter outer tubes are formed with the different etching rate of the F and BF4 (Fig. 6b). The amount of free fluoride ions may depends on the applied potentials, which means that high anodizing voltages (100 V) generate more fluoride ions than the low potentials (60 V), therefore the formed double-walled structure at low potentials is relatively stable, while it disappears due to the intensive dissolution of F dissociated at high voltages to form the thin single-walled structure (Fig. 6c).


image file: c4ra01857e-f6.tif
Fig. 6 Schematic diagram of DW-TiO2 NTs and SW-TiO2 NTs formation by two-step anodization in the NH4BF4 based electrolyte. Initial stage of the second-step of anodization process (a), DW-TiO2 NTs (b) and SW-TiO2 NTs (c) formed at low and high potentials, respectively.

In summary, we investigate the fabrication of uniform TiO2 NTs in NH4BF4 based electrolyte. DW-TiO2 NTs, combined DW-TiO2/SW-TiO2 NTs and SW-TiO2 NTs are obtained at 60 V, 80 V and 100 V, respectively. The DW-TiO2 NTs possess larger surface area and better orderliness than the SW-TiO2 NTs, which result in higher photocurrent and photoconversion efficiency. We believe our discovery is significant in that it allows us to use a previously unexplored anodizing electrolyte for the synthesis of TiO2 NTs and presents a new avenue to fabricate the DW-TiO2 NTs for improving photoconversion efficiency in PEC water splitting performance.

Acknowledgements

We acknowledge the financial support from the National Nature Science Foundation of China (NSFC, no. 20976058).

Notes and references

  1. S. P. Albu, A. Ghicov, J. M. Macak, R. Hahn and P. Schmuki, Nano Lett., 2007, 7, 1286 CrossRef CAS PubMed.
  2. C. J. Lin, W. Y. Yu, Y. T. Lu and S. H. Chien, Chem. Commun., 2008, 45, 6031 RSC.
  3. B. O'Regan and M. Grätzel, Nature, 1991, 353, 737 CrossRef CAS.
  4. J. M. Macak, H. Tsuchiya, A. Ghicov and P. Schmuki, Electrochem. Commun., 2005, 7, 1133 CrossRef CAS PubMed.
  5. Q. W. Chen and D. S. Xu, J. Phys. Chem. C, 2009, 113, 6310 CAS.
  6. O. K. Varghese, D. W. Gong, M. Paulose, K. G. Ong, E. C. Dickey and C. A. Grimes, Adv. Mater., 2003, 15, 624 CrossRef CAS.
  7. G. K. Mor, O. K. Varghese, M. Paulose and C. A. Grimes, Sens. Lett., 2003, 1, 42 CrossRef CAS PubMed.
  8. H. Q. Li, S. K. Martha, R. R. Unocic, H. M. Luo, S. Dai and J. Qu, J. Power Sources, 2012, 218, 88 CrossRef CAS PubMed.
  9. D. Gong, C. A. Grimes, O. K. Varghese, W. Hu, R. S. Singh, Z. Chen and E. C. Dickey, J. Mater. Res., 2001, 16, 3331 CrossRef CAS.
  10. Q. Y. Cai, M. Paulose, O. K. Varghese and C. A. Grimes, J. Mater. Res., 2005, 20, 230 CrossRef CAS.
  11. M. Paulose, K. Shankar, S. Yoriya, H. E. Prakasam, O. K. Varghese, G. K. Mor, T. J. LaTempa, A. Fitzgerald and C. A. Grimes, J. Phys. Chem. B, 2006, 110, 16179 CrossRef CAS PubMed.
  12. N. K. Allam and C. A. Grimes, J. Phys. Chem. C, 2007, 111, 13028 CAS.
  13. I. Paramasivam, J. M. Macak, T. Selvam and P. Schmuki, Electrochim. Acta, 2008, 54, 643 CrossRef CAS PubMed.
  14. H. Q. Li, J. Qu, Q. Z. Cui, H. Xu, H. M. Luo, M. F. Chi, R. A. Meisner, W. Wang and S. Dai, J. Mater. Chem., 2011, 21, 9487 RSC.
  15. H. Wender, A. F. Feil, L. B. Diaz, C. S. Ribeiro, G. J. Machado, P. Migowski, D. E. Weibel, J. Dupont and S. R. Teixeira, ACS Appl. Mater. Interfaces, 2011, 3, 1359 CAS.
  16. S. P. Albu, A. Ghicov, S. Aldabergenova, P. Drechsel, D. LeClere, G. E. Thompson, J. M. Macak and P. Schmuki, Adv. Mater., 2008, 20, 4135 CAS.
  17. S. E. John, S. K. Mohapatra and M. Misra, Langmuir, 2009, 25, 8240 CrossRef CAS PubMed.
  18. J. M. Macak, S. Albu, D. H. Kim, I. Paramasivam, S. Aldabergerova and P. Schmuki, Electrochem. Solid-State Lett., 2007, 10, K28 CrossRef CAS PubMed.
  19. S. Q. Li, G. M. Zhang, D. Z. Guo, L. G. Yu and W. Zhang, J. Phys. Chem. C, 2009, 113, 12759 CAS.
  20. D. S. Guan and Y. Wang, Nanoscale, 2012, 4, 2968 RSC.
  21. Z. H. Zhang and P. Wang, Energy Environ. Sci., 2012, 5, 6506 CAS.
  22. H. E. Prakasam, K. Shankar, M. Paulose and C. A. Grimes, J. Phys. Chem. C, 2007, 111, 7235 CAS.
  23. S. Yoriya, M. Paulose, O. K. Varghese, G. K. Mor and C. A. Grimes, J. Phys. Chem. C, 2007, 111, 13770 CAS.
  24. J. H. Xing, H. Li, Z. B. Xia, J. F. Hu, Y. H. Zhang and L. Zhong, J. Electrochem. Soc., 2013, 160, C503 CrossRef CAS PubMed.
  25. J. C. Yu, L. Z. Zhang, Z. Zheng and J. C. Zhao, Chem. Mater., 2003, 15, 2280 CrossRef CAS.
  26. G. Liu, F. Li, D. W. Wang, D. M. Tang, C. Liu, X. Ma, G. Q. Lu and H. M. Cheng, Nanotechnology, 2008, 19, 025606 CrossRef PubMed.
  27. D. H. Wang, L. Jia, X. L. Wu, L. Q. Lu and A. W. Xu, Nanoscale, 2012, 4, 576 RSC.
  28. X. S. Zhou, F. Peng, H. J. Wang, H. Yu and J. Yang, J. Solid State Chem., 2011, 184, 134 CrossRef CAS PubMed.
  29. X. S. Zhou, F. Peng, H. J. Wang, H. Yu and J. Yang, Electrochem. Commun., 2011, 13, 121 CrossRef CAS PubMed.
  30. A. Suzuki, Y. Shinka and M. Masuko, Tribol. Lett., 2007, 27, 307 CrossRef CAS.
  31. W. Ho, J. C. Yu and S. Lee, Chem. Commun., 2006, 10, 1115 RSC.
  32. Q. Li and J. K. Shang, Environ. Sci. Technol., 2009, 43, 8923 CrossRef CAS PubMed.
  33. S. U. M. Khan, M. Al-Shahry and W. B. Ingler Jr, Science, 2002, 297, 2243 CrossRef CAS PubMed.
  34. J. C. Yu, J. G. Yu, W. K. Ho, Z. T. Jiang and L. Z. Zhang, Chem. Mater., 2002, 70, 3808 CrossRef.
  35. Y. Cong, J. L. Zhang, F. Chen, M. Anpo and D. N. He, J. Phys. Chem. C, 2007, 111, 10618 CAS.

Footnote

Electronic supplementary information (ESI) available: Experimental methods, photoelectrochemical activity tests. See DOI: 10.1039/c4ra01857e

This journal is © The Royal Society of Chemistry 2014
Click here to see how this site uses Cookies. View our privacy policy here.