Crystallization kinetics behavior of ionic liquid [EMIM][BF4] confined in mesoporous silica matrices
Abhishek Kumar Gupta,
Rajendra Kumar Singh* and
Suresh Chandra*
Ionic Liquid and Solid State Ionics Laboratory, Department of Physics, Banaras Hindu University, Varanasi-221005, India. E-mail: rksingh_17@rediffmail.com; sureshchandra_bhu@yahoo.co.in; Fax: +91 542 2368390; Tel: +91 542 6701541
First published on 7th May 2014
Abstract
The crystallization kinetics behavior of pure ionic liquid (IL) (1-ethyl-3-methylimidazolium tetrafluoro borate; EMIMBF4) as well as IL confined in mesoporous silica matrices (termed as ionogel) is the concern of our present study. The ionogels (IGs) were synthesized by a non-hydrolytic sol–gel process. DSC was employed to investigate the isothermal crystallization kinetics behavior of IL in bulk as well as in confinement. Isothermal crystallization temperatures were chosen a few °C above the onset crystallization temperature of IL in bulk and in confinement. Crystallization kinetic parameters such as relative crystallinity (α), crystallization half time (t1/2), crystallization rate constant (K) and Avrami exponents (n) have been determined by an isothermal technique using DSC. Crystallization kinetic parameters have been found to be dependent on the amount of IL and the crystallization isothermal temperatures. The experimental data based on the isothermal method show that confinement of the IL results in (i) delayed crystallization and (ii) reduced dimensionality of the crystallization kinetics from 3D (for bulk IL) to 1D. X-ray photoelectron spectroscopy (XPS) and transient plane source (TPS) studies have been used to explain the delayed crystallization.
Introduction
Studies on ionic liquids are growing due to their intrinsic interesting properties1–4 (like low vapour pressure, high solvation ability, non-flammability, non-toxicity, high ionic conductivity etc.), which make them potential candidates for possible technical applications in various devices such as electrochemical devices like batteries,5 fuel cells,6 solar cell,7 super-capacitors,8 electro chromic display devices,9 actuators10 etc. Direct application of ILs is prevented due to many limitations such as packaging problems, limited temperature range of operation, portability, leakage and corrosion problems associated with the liquidus nature of ILs. Recently, a novel class of materials termed as “ionogels”11–13 (IGs) has been developed by confining ionic liquids in porous matrices like SiO2, TiO2, SnO2, carbon nano tube etc.14–17 Immobilization of the IL in silica matrix provides mechanical support, easy handling, high conductivity and stability to the IL and increases its performance by making them a good solid electrolytes suitable for the solid state devices. Applications of IGs range from electrochemical devices; like, lithium ion batteries,18 proton transport membranes suitable for fuel cells,19 energy storage devices such as supercapacitors,20 solid electrolyte for dye sensitized solar cell,21 optical devices; like, electro chromic applications22 and sensors.23 The porous oxide is generally prepared by hydrolytic and non-hydrolytic sol–gel synthesis routes.24–27 The properties of IL have been found to change on confinement. For example, the phase transition temperatures like glass transition temperature (Tg), crystallization temperature (Tc) and melting temperature (Tm) of bulk IL are reported to change on confinement.14,15,28–32 These changes have been explained on the basis of interaction of pore wall of confining matrix with confined IL.12,28–32 A large number of studies are available on the effect of confinement on properties of many materials like molecular liquids, gases, water, liquid crystals etc.33–36 The emphasis on many of these studies is to study the effect on the crystallization behavior. Few studies on the crystallization kinetics of ILs are reported.37 However, to the best of our knowledge, there is no study reported on the crystallization kinetics behavior of IL confined in nano-pores. Most of the ILs are glass forming materials and few of these pass through a crystallization peak at a characteristic temperature, (Tc).28,29,38–40 Different approaches are adopted for studying the crystallization kinetics behaviour of polymers,41–44 pure ionic liquids37 and ionic liquid based polymer electrolytes.45 Muller's group has given a detailed guideline to fit the isothermal polymer crystallization kinetics data obtained by differential scanning calorimetry (DSC) using Avrami equation and described the role of choosing the proper crystallization temperature for isothermal polymer crystallization kinetics.41 Proper choice of crystallization temperature is very important, in case of ionic liquid too. For isothermal crystallization kinetics study of IL and #IGs, samples are cooled below glass transition temperature for sufficient time and then to study the crystallization kinetics behaviour, samples are heated towards crystallization temperature (details are discussed in the Experimental section). Whereas, in the case of polymers, to erase the thermal history, samples are first heated above melting temperature, for some time and then quenched to proper isothermal crystallization temperature to study the isothermal crystallization kinetics behaviour.41,45Recently, we have studied [EMIM][BF4] confined in nano porous silica having pore sizes 7.4 and 7.8 nm, as well as unconfined [EMIM][BF4], and found that it shows two crystallization peaks both in bulk and in confinement,28,29 indicating simultaneous presence of two different types of solid phases.28,38,39 The focus of the present study is to find, in general, the effect of confinement on crystallization kinetics and in particular to answer the following questions: (i) does confinement slow down or hasten the crystallization? (ii) whether the crystallization in confinement is 3D or it changes to 1D because of the restrictive barriers due to the walls of confining nano-pores? In the present investigation we have used “isothermal crystallization” technique to study the crystallization kinetics using DSC. It is found that the crystallization slows down on confinement and the ionic liquid prefers 1D crystallization in confinement. X-ray photoelectron spectroscopy (XPS) and transient plane source (TPS) measurements have been used to explain the slowing down of crystallization process of IL in confinement.
Experimental section
Preparation of samples of ionic liquid confined in silica
Ionic liquid (IL), (1-ethyl-3-methylimidazolium tetrafluoroborate, EMIMBF4) obtained from Sigma Aldrich was used for the preparation of IGs. The samples of IL confined in nanoporous silica were obtained by sol–gel process as described by us earlier.28,29 In brief, tetraethylortho-silicate (TEOS), formic acid (HCOOH) and IL were mixed in molar ratio of 1![[thin space (1/6-em)]](https://www.rsc.org/images/entities/char_2009.gif) :
:![[thin space (1/6-em)]](https://www.rsc.org/images/entities/char_2009.gif) 8
8![[thin space (1/6-em)]](https://www.rsc.org/images/entities/char_2009.gif) :
:![[thin space (1/6-em)]](https://www.rsc.org/images/entities/char_2009.gif) x (where x = 0, 0.25 and 0.35) for obtaining the IGs [x = 0 is for pure silica gel]. We have chosen different mol% of IL such as 0.15, 0.25, 0.35, 0.5 mol% etc. for the formation of IGs but IGs with 0.25 and 0.35 mol% only were found more stable than the other mol% and have been designated as #IG2 and #IG3 respectively.
x (where x = 0, 0.25 and 0.35) for obtaining the IGs [x = 0 is for pure silica gel]. We have chosen different mol% of IL such as 0.15, 0.25, 0.35, 0.5 mol% etc. for the formation of IGs but IGs with 0.25 and 0.35 mol% only were found more stable than the other mol% and have been designated as #IG2 and #IG3 respectively.
Karl Fischer analysis
Mettler Toledo C20 Karl Fischer Coulometric Titrator was used for the determination of moisture (water) content in ionic liquid which was ∼200 ppm for pure ionic liquid.To overcome the problem related to the moisture, all the samples (IL as well as IGs) were dried under high vacuum (∼10−6 torr) for 24 h and then heated at 60 °C for ∼12 h before storing in a glove box (Bionics, Model no. BST-TGB10000/A).
Crystallization kinetics by isothermal crystallization techniques
Three different samples, neat IL, #IG2 (0.25 mol% of IL confined in SiO2 matrix) and #IG3 (0.35 mol% of IL confined in SiO2 matrix) were taken for crystallization kinetic study and subjected to the DSC analysis under the isothermal process.A Differential Scanning Calorimeter (DSC) Mettler Toledo DSC-1 was used for the investigation of onset of crystallization, (Tc)onset, and studying crystallization kinetic behavior. The DSC measurements were done in N2 atmosphere with a flow rate of 25 ml min−1 and for this, weight of samples in aluminum pan was kept nearly constant (≈13–15 mg) in all the cases. The results of the measurements (DSC and crystallization kinetics studies) were reproducible for the samples stored in glove box. Before performing the measurements (DSC and crystallization kinetics studies) the samples were again preheated in a sealed pan containing a pin hole by giving a temperature programme for DSC which includes, a first heating cycle (at a heating rate of 20 °C min−1) from 30 °C to 100 °C and holding it there for nearly 5 min. Then the samples were cooled from 100 °C to −120 °C at a cooling rate of −50 °C min−1, followed by an isotherm of 30 min at −120 °C. Finally, the DSC thermograms were recorded from −120 °C to 100 °C at a heating rate of 10 °C min−1 and (Tc)onset were noted. The values (Tc)onset for bulk IL, #IG2 and #IG3 are −76, −47 and −60 °C, respectively.
For studying isothermal crystallization kinetics process, the crystallization temperatures were chosen 2 to 8 °C above the (Tc)onset. The isothermal crystallization temperatures, (Tc)iso, used were −70, −72 and −74 °C for pure IL; −40,−41, −43 °C for #IG2 and −55, −57, −59 °C for #IG3, respectively. For carrying out experiment on isothermal crystallization kinetics, samples were first cooled to −120 °C and then heated to ∼20 °C below the (Tc)onset @ 5 °C min−1 and then quenched rapidly @ 50 °C min−1, to various crystallization temperatures. For the deconvolution of the experimental crystallization curves, PeakFit v4.12 was used. It identifies the peak by finding local maxima in a smoothed data stream; second peak was then added where residuals occur.
X-ray photoelectron spectroscopy (XPS) technique was used to get an idea about the chemical interaction and identification of electronic states of the IL in confined system. XPS study was carried out using VSW-ESCA photoelectron spectrometer (with AlKα unmonochromatized X-rays having energy of ∼1486.6 eV). The resolution of the instrument was ∼1.0 eV. Binding energy (B.E.) of C1s ∼284.6 eV was taken as reference to correct the shift in binding energy (B.E.) of core levels due to charging effect. XPSPEAK4.1 software was used for the deconvolution of the XPS B.E. peaks.46 Thus the obtained B.E. peak position was used for the interpretation of the spectra.
Thermal conductivity of the IGs was measured using pellets of #IG2 and #IG3, which were prepared at a load of 3 tons and measurements have been made at room temperature using recently developed transient plane source (TPS) technique also called the Gustafsson probe or the hot disk (HD) technique.47
The method is based on the use of a transiently heated plane sensor which consists of concentric circles coated by a thin polymer with good chemical resistance and mechanical properties on both sides. The concentric circles are made into a double spiral so that current can be fed from one end to the other. To measure the thermal conductivity, TPS sensor is placed between two pieces of the sample material to be tested. One of the main advantages of transient techniques over steady state techniques is the influence of contact resistance that can be removed in the analysis of experimental data. This enables accurate measurement over a wide range of thermal conductivity for a variety of materials.
Results and discussion
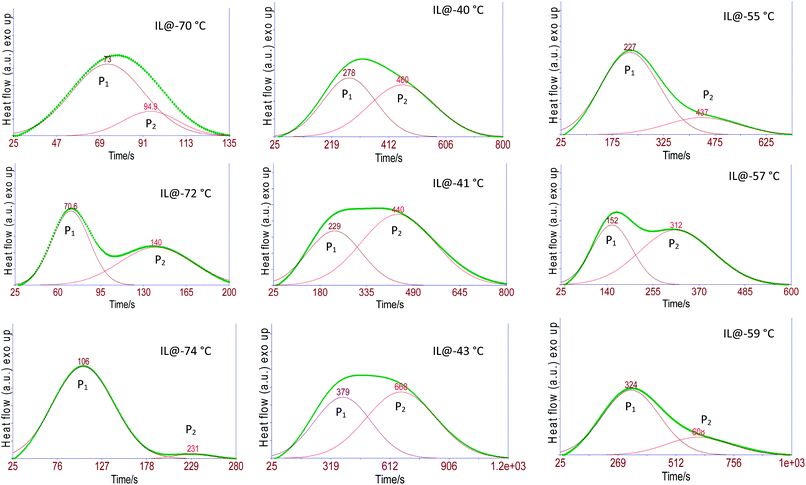
The experimental isothermal crystallization curves (Eiso) for the three samples viz. pure IL, #IG2 and #IG3 at different crystallization temperatures (as described in Experimental section) are given in Fig. 1. We have deconvoluted the isotherms and deonvoluted peaks marked as P1 and P2 [also shown by colored lines] corresponding to the two solid phases are shown in Fig. 1 [isothermal crystallization curves are shown by the dark lines]. It can be seen that there are signatures for the existence of two peaks which indicate that there are two solid phases in which [EMIM][BF4] is likely to crystallize. Earlier DSC results of bulk IL, [EMIM][BF4] as well as confined IL have shown the existence of two Tc's and Tm's in the thermogram.28,29,38,39 The earlier one is due to the ordered crystal structure and later one is due to anion disorder.28,29,39 The first crystallization peak is more prominent while second crystallization peak is rare and is observed only in some ILs such as [EMIM][BF4],39 [BMIM][PF6] (ref. 48) etc. Some other ILs have also been found to crystallize in three phases.49 Change in intensity and position of these peaks related to two crystallization phases may occur, with the change in the amount of IL and isothermal crystallization temperatures. Because, all the measurements have been made at different crystallization temperatures so peak positions and intensity of the phases appearing at different temperatures are expected to be different (Fig. 1). To study the crystallization process as a function of time for each of the phases separately, the results for the two peaks (P1 and P2) are also presented separately in Fig. 2.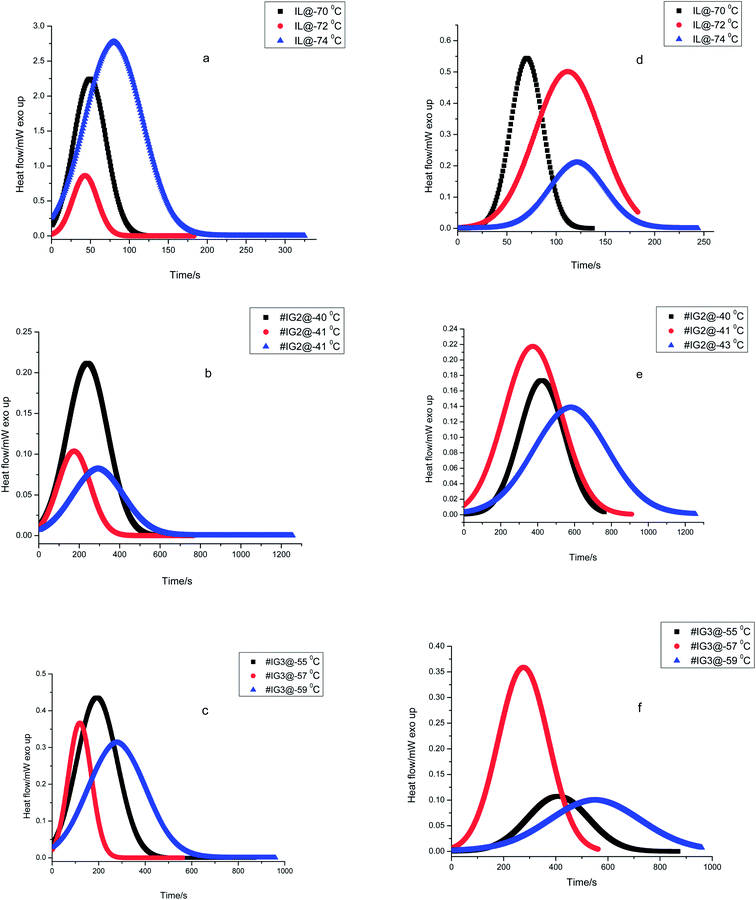 | ||
| Fig. 2 Heat flow vs. time plots during isothermal crystallization for ILs and #IGs, where (a–c) correspond to solid phase 1 and (d–f) correspond to solid phase 2 present in the material. | ||
The relative crystallinity (α) at a time ‘t’ can be evaluated using the DSC exothermic thermograms (Fig. 2), which is defined as the ratio of crystallinity at any time ‘t’ to the crystallinity when time approaches ‘infinity’ as given below50
 | (1) |
Using eqn (1), the relative crystallinity (α) generated at any time ‘t’ for pure IL and for IL in confinement are plotted as a function of time (t) at various crystallization temperatures in Fig. 3. Fraction of the IL transformed to crystallized state with time for IL in bulk and in confinement at three different crystallization temperatures are shown in Fig. 3(a)–(f) [where, Fig. 3(a) and (d) for IL, Fig. 3(b) and (e) for #IG2 and Fig. 3(c) and (f) for #IG3 corresponding to first and second solid phases respectively]. This has been used to find out the value of crystallization half time (t1/2) which is the time needed to attain 50% crystallization of the system. The values of t1/2 are given in Table 1. A comparison of results of pure IL with those of #IGs shows that IL, [EMIM][BF4] confined in silica matrix takes longer time (∼150–580 s) to crystallize in comparison to the neat IL (∼70–100 s). The same feature of delayed crystallization of confined IL in comparison to the neat IL has been observed for the second crystallization peak present in the IL, which shows that crystallization rates become slower in confinement. The slowing down of the crystallization rate of IL in confinement may be due to interactive forces acting between the pore wall surface which hinders the process of crystallization. For IL in confinement, besides electrostatic (cation–anion, cation–cation & anion–anion)51 and van der Waals interactions; surface interactions (H-bonding, liquid–solid interface etc.) with the silica pore wall are also possible.3,32,39,51–53 Among these various interactions, surface interactions play dominant role in confinement and decide the crystallization rate because surface interactions will oppose the molecules to arrange and support the delayed crystallization process in confinement by hindering the motion of IL.54 Detail explanation of surface interactions and delayed crystallization have been discussed in the next section related to X-ray photoelectron spectroscopy (XPS) and transient plane source (TPS) studies.
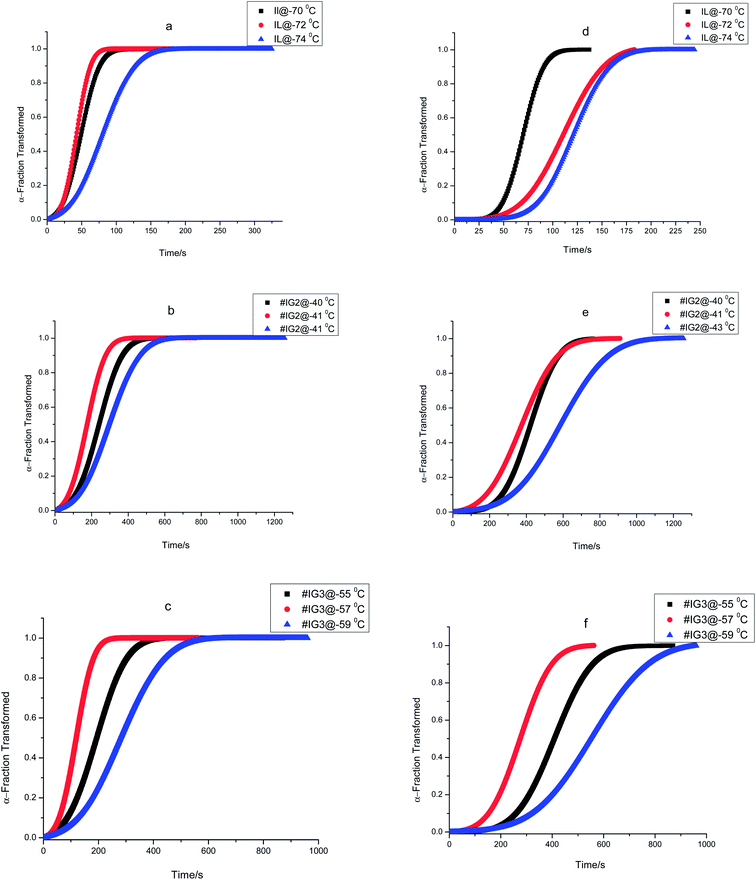 | ||
| Fig. 3 The plot of fraction transformed vs. crystallization time for ILs and #IGs, where (a–c) correspond to solid phase 1 and (d–f) correspond to solid phase 2 present in the material. | ||
| Samples | (Tc)iso (°C) | n1 | n2 | K1 (s−n) | K2 (s−n) | t1/2 (s) | |
|---|---|---|---|---|---|---|---|
| t1/2(1) (s) | t1/2(2) (s) | ||||||
| Pure IL | −70 | 2.32 | 2.42 | 7.53 × 10⁻⁵ | 6.28 × 10⁻⁷ | 70 | 94 |
| −72 | 2.28 | 2.31 | 8.23 × 10⁻⁵ | 2.82 × 10⁻⁶ | 73 | 137 | |
| −74 | 2.04 | 2.51 | 7.88 × 10⁻⁵ | 1.25 × 10⁻⁷ | 106 | 227 | |
| #IG2 | −40 | 1.09 | 1.05 | 4.53 × 10⁻⁴ | 1.37 × 10⁻⁴ | 208 | 406 |
| −41 | 1.03 | 1.00 | 2.66 × 10⁻⁴ | 1.18 × 10⁻⁵ | 278 | 460 | |
| −43 | 1.04 | 1.05 | 2.46 × 10⁻⁴ | 3.66 × 10⁻⁵ | 334 | 619 | |
| #IG3 | −55 | 1.17 | 1.10 | 4.07 × 10⁻⁴ | 5.51 × 10⁻⁵ | 152 | 307 |
| −57 | 1.09 | 1.10 | 3.78 × 10⁻⁴ | 6.83 × 10⁻⁶ | 225 | 442 | |
| −59 | 1.06 | 1.06 | 2.75 × 10⁻⁴ | 1.98 × 10⁻⁵ | 316 | 583 | |
Isothermal crystallization kinetics behavior of IL in bulk and in confinement has been interpreted using Avrami equation. For obtaining more information about the isothermal crystallization kinetics, the evolution of the relative crystallinity (α) with the crystallization time (t) was assumed as55,56
| α = 1 − exp(−Ktn) | (2) |
The eqn (2) can be rewritten as
| ln[−ln(1 − α)] = lnK + nlnt | (3) |
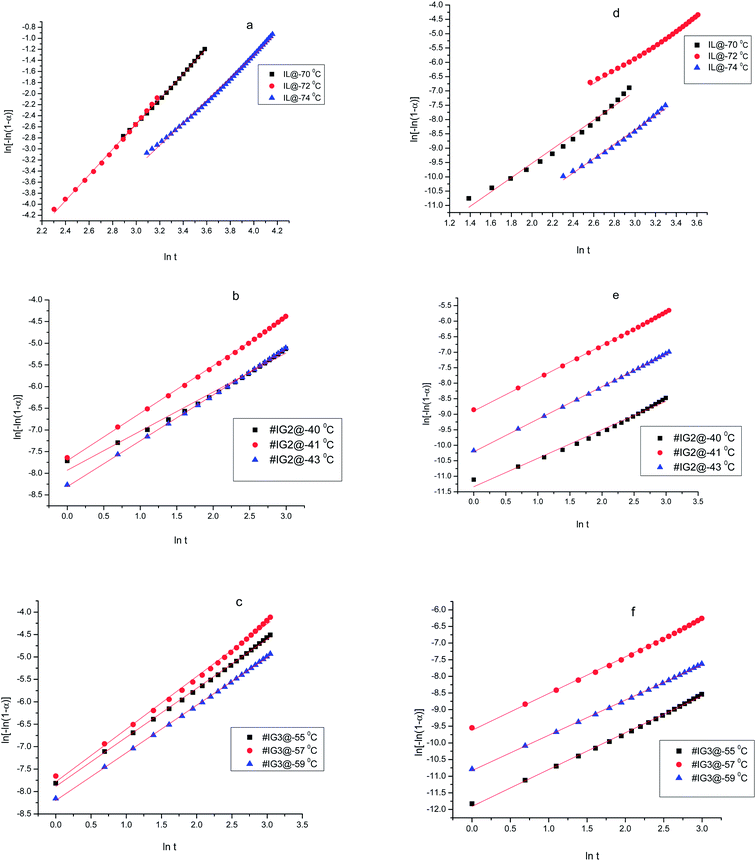
Thus, if the experimental kinetic data obeys the Avarmi equation, then the plot of ln[−ln(1 − α)] as a function of ln![[thin space (1/6-em)]](https://www.rsc.org/images/entities/char_2009.gif) t would be a straight line, which is useful in finding the values of n and K. Fig. 4 shows, the complete Avrami plots for pure IL, #IG2 and #IG3 at different isotherm temperatures. Avrami equation is generally applicable at initial stages of crystallization (i.e., at lower times) and the straight line behavior of ln[−ln(1 − α)] vs. ln
t would be a straight line, which is useful in finding the values of n and K. Fig. 4 shows, the complete Avrami plots for pure IL, #IG2 and #IG3 at different isotherm temperatures. Avrami equation is generally applicable at initial stages of crystallization (i.e., at lower times) and the straight line behavior of ln[−ln(1 − α)] vs. ln![[thin space (1/6-em)]](https://www.rsc.org/images/entities/char_2009.gif) t is applicable. Avrami exponent (n) and crystallization rate constant (K) can be obtained by knowing the slope and intercept of the straight line respectively, using Avrami plots at initial stages of crystallization (Fig. 5). Values of Avrami exponents (n1 and n2), crystallization constants (K1 and K2) and crystallization half-times (t1/2(1) and t1/2(2)) at various crystallization temperatures corresponding to the two phases present in the material for the IL and IGs are given in Table 1.
t is applicable. Avrami exponent (n) and crystallization rate constant (K) can be obtained by knowing the slope and intercept of the straight line respectively, using Avrami plots at initial stages of crystallization (Fig. 5). Values of Avrami exponents (n1 and n2), crystallization constants (K1 and K2) and crystallization half-times (t1/2(1) and t1/2(2)) at various crystallization temperatures corresponding to the two phases present in the material for the IL and IGs are given in Table 1.
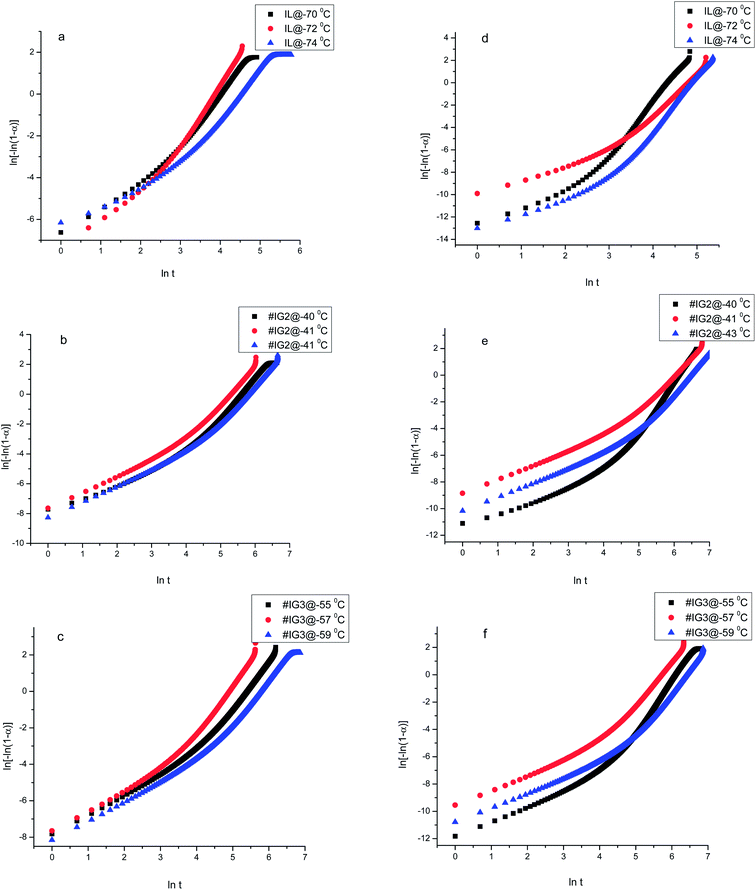 | ||
| Fig. 4 Complete Avrami plots using an isothermal method for ILs and #IGs, where (a–c) correspond to solid phase 1 and (d–f) correspond to solid phase 2 present in the material. | ||
The values of Avrami exponents n1 and n2 (corresponding to the both phases present in the IL) for pure IL are respectively 2.32 and 2.42 (at crystallization temperature Tc = −70 °C), 2.28 and 2.31 (at crystallization temperature Tc = −72 °C) and 2.04 and 2.51 (at crystallization temperature Tc = −74 °C) (see Table 1) suggesting three dimensional crystal growth for IL in bulk while incorporation of IL in SiO2 matrix changes the crystallization behavior of IL. For all crystallization temperatures, obtained values of ‘n1 and n2’ for #IG2 and #IG3 are nearly equal to 1 which indicates a one dimensional crystal growth.
To get a sufficient evidence in favour of this delayed crystallization rate, we carried out simultaneous measurement of X-ray photoelectron spectroscopy (XPS) and transient plane source (TPS) to explore the reason for the delayed crystallization rate in confinement as discussed below.
X-ray photoelectron spectroscopy (XPS)
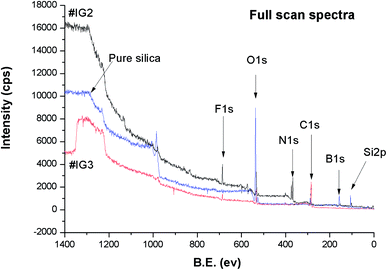
We have carried out the core level XPS study of the pure silica and IL confined in silica samples. The binding energy (B.E.) positions of the different elements present in the samples have been analysed carefully. Survey scan spectra of pure silica and the IL confined samples #IG2 and #IG3 show the presence of various peak positions related to Si 2p, B 1s, C 1s, N 1s, O 1s and F 1s at their respective B.E. positions (Fig. 6). In order to get a precise and detailed understanding about the chemical interactions/compositions, we have taken the detailed scan spectra and further deconvoluted it. The detailed scan XPS spectra for all the observed elements viz. Si 2p, O 1s, B 1s, N 1s, F 1s and C 1s present in the IL in confined systems of silica matrix i.e. for #IG2 and #IG3 are shown in the Fig. 7(a)–(h) and Fig. 8(a)–(f), respectively. It has been observed that the B.E. peaks of all the elements (Si 2p, O 1s, B 1s, N 1s, F 1s and C 1s) get changed upon confinement as compared to their respective reported58–60 bulk B.E. positions.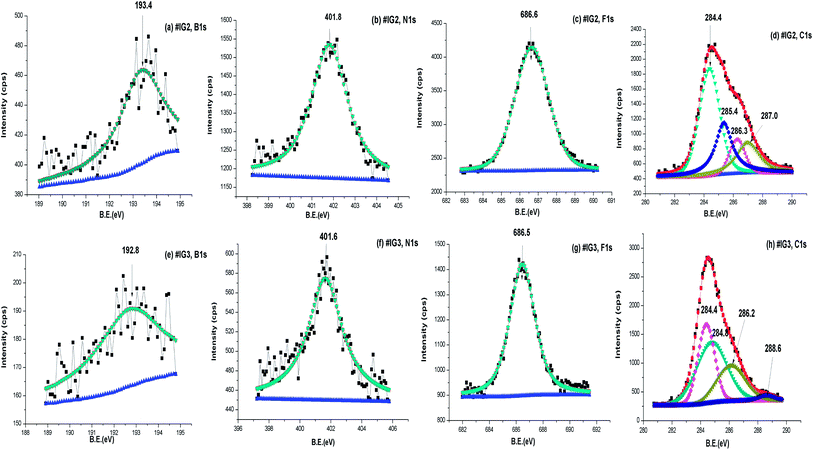 | ||
| Fig. 7 Deconvoluted XPS spectra of (a and e) B 1s, (b and f) N 1s, (c and g) F 1s, (d and h) C 1s respectively for #IG2 and #IG3. | ||
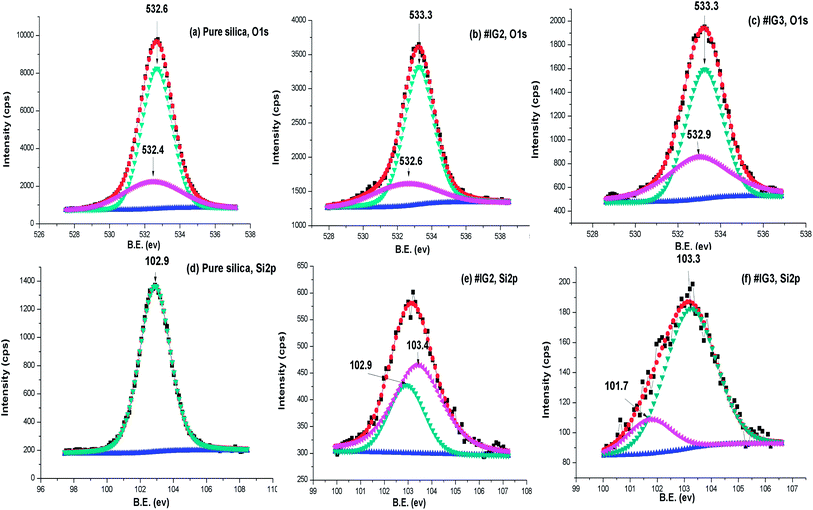 | ||
| Fig. 8 Deconvoluted XPS spectra of (a–c) O 1s, (d–f) Si 2p respectively for pure silica, #IG2 and #IG3. | ||
The observed B.E. positions for B1s of IL is ∼193.4 eV and 192.8 eV for #IG2 and #IG3 (Fig. 7(a) and (e)), respectively, which has been shifted to lower B.E. side as compared to the reported bulk value for B 1s (∼195.6 eV).58 Similarly, the B.E. peak positions of N 1s and F 1s are also found to be shifted upon confinement to 401.8 eV (#IG2) [Fig. 7(b)] and 401.6 eV (#IG3) [Fig. 7(f)] for N 1s and 686.6 eV (#IG2) [Fig. 7(c)] and 686.5 eV (#IG3) [Fig. 7(g)] for F 1s as compared to their bulk B.E. positions of ∼398.4 eV (for N 1s) and 688.3 eV (for F 1s), respectively. The B.E. peak position for C 1s ∼286.5 eV reported earlier for IL showed the sp2 hybridized carbons in the hetro-aromatic ring of the imidazolium and sp3 hybridized state carbons in ethyl and methyl groups bonding directly with nitrogen atom.58 For our sample, the B.E. positions for C 1s were found to be shifted in the confined systems (Fig. 7(d) and (h)). Both, #IG2 and #IG3 show the change in the BE peaks in confinement as compared with the earlier reported value (∼286.5 eV) (ref. 58 and 59) for C 1s of the IL associated with aliphatic chain as well as rings which appears at 284.4, 285.4, 286.3 and 287.0 eV for #IG2 [Fig. 7(d)]; and at 284.4, 284.8, 286.2 and 288.6 eV for #IG3 [Fig. 7(h)]. It corresponds to the sp2 hybridized carbons in the hetro-aromatic ring of the imidazolium and sp3 hybridized state carbons in ethyl and methyl group bonding directly with nitrogen atom.
To further confirm whether B.E. positions related to O 1s and Si 2p of the pure silica is changed due to the surface interactions or not, we analysed the deconvoluted detailed scan XPS spectra of pure silica and IL confined in silica samples (Fig. 8(a)–(f)). The deconvoluted XPS spectra of pure silica [Fig. 8(a)] for O1s show two B.E. peaks at ∼532.6 and ∼532.4 eV due to oxide of SiO2.60 It has been observed that B.E. positions of elemental O 1s shift towards higher B.E. side by ∼0.7 eV for both #IG2 and #IG3 as compared to its elemental value of pure silica ∼532.6 eV (ref. 60) [Fig. 8(a)–(c)]. This may be due to interaction of IL cations and anions with the Si–O of the silica matrix. The deconvoluted XPS spectra of pure silica for Si 2p show single B.E. peak at ∼102.9 eV (ref. 60) due to presence of elemental Si [Fig. 8(d)], while silica with confined IL shows two B.E. peaks at ∼102.9 and ∼103.4 eV for #IG2 and ∼101.7 and ∼103.3 eV for #IG3 [Fig. 8(e) and (f)]. The earlier one is due to Si element of SiO2 and later one (peak of Si 2p towards higher B.E. side) is due to the interaction of IL with the silica pore wall surface. This hinders the motion of IL in confinement and delayed the crystallization process as observed by us in isothermal crystallization kinetics studies using DSC.
The observed change in the B.E. positions for all the elements viz. Si 2p, O 1s, B 1s, N 1s, F 1s and C 1s have been attributed to the surface interactions of confined IL with the silica nano-pores and results as a change in the energy of the confined IL due to spatial hindrance offered by silica pore-wall and hence, responsible for delay in crystallization rate upon confinement. Transient plane source (TPS) measurement is used to further confirm the cause of delayed crystallization.
Transient plane source (TPS) measurement for the thermal transport properties of IL in confinement
Total time of crystallization of the IL upon confinement could be affected by the thermal conductivity of the materials because it follows the laws of thermodynamics and has ability to define heat conduction inside the pure material and during crystallization of IL in confinement.We can not ignore the factors which act as barriers to the heat transfer during the process of crystallization by which total time of crystallization may increase or decrease. The work of Grady et al.61 in 2001 shows that thermal conductivity of the material limits the rate of heat transfer and hence affects the crystallization rates so the role of thermal conductivity of the synthesized material is important. The values of thermal conductivities for the pure silica, #IG2 and #IG3 are 0.8, 1.87, 1.76 W m−1 K−1 respectively, where as for pure ionic liquid [EMIM][BF4] it is 0.2 W m−1 K−1.62 For pure IL, thermal conductivity value is quite low (∼0.2 W m−1 K−1) and also has the less crystallization half time (t1/2) ∼ 100 s. It is notable that, mixing of two materials with different thermal conductivities (i.e. pure silica and IL) increases the value of thermal conductivity and correspondingly crystallization half times of the resulting IGs. This may be due to the effect of thermal conduction; as thermal conductivity of #IG2 (0.25 mol% of IL) is 1.87 W m−1 K−1, correspondingly the crystallization half time (t1/2) also increased to ∼550 s and as the amount of IL is further increased in #IG3 (0.35 mol% of IL), thermal conductivity decreased to 1.76 W m−1 K−1, and the value of crystallization half time (t1/2) decreased to ∼500 s. To explain this phenomenon at the molecular level, it can be considered that silica matrix acts as a sink for the confined system as it has higher value of thermal conductivity compared to the IL.61 This supports the faster heat transfer away from the crystal growth during crystallization process in confinement and hence will take much time in complete crystallization and will make crystallization delayed while pure IL, due to low value of thermal conductivity, will utilize all absorbed heats to crystallize its constituent molecules because there are no heat sinks which can draw heat away from the molecules and will take less time in complete crystallization.
Conclusion
Crystallization kinetics behavior of pure ionic liquid (IL) (1-ethyl-3-methylimidazolium tetrafluoro borate; EMIMBF4) as well of ionogels (synthesized by non-hydrolytic sol–gel process) has been studied at few °C above the crystallization onset temperatures. Crystallization kinetic parameters such as relative crystallinity (α), crystallization half time (t1/2), crystallization rate constant (K) and Avrami exponents (n) were determined by isothermal techniques using DSC. Crystallization kinetic parameters are found to be dependent on amount of IL and isothermal temperatures. The isothermal study of the IL and IGs show that confinement reduces the dimensionality of crystallization of the ionic liquid from 3D to 1D and also slows down the crystallization rate of IL in confinement. The results of XPS show that BE peaks corresponding to B 1s, N 1s, F 1s and C 1s affected in confinement due to the hindrance offered by the matrix pore wall.Acknowledgements
One of us (S.C.) is thankful to the National Academy of Science, India, for the award of the NASI Honorary Senior Scientist. (R.K.S.) is thankful to BRNS, DAE for providing financial assistance to carry out this work. A.K.G. is thankful to CSIR, New Delhi, India for an award of Senior Research Fellowship (SRF). The authors are thankful to Dr T. Shripathi, UGC-DAE, Consortium for Scientific Research, Indore for XPS measurements.References
- Electrochemical Aspects of Ionic Liquids, ed. H. Ohno, John Wiley & Sons, Hoboken, NJ, 2005 Search PubMed.
- F. Endres, D. MacFarlane and A. Abbott, Electrodeposition from Ionic Liquids, WILEY-VCH Verlag GmbH & Co. KGaA, Weinheim, 2008 Search PubMed.
- M. Koel, Ionic Liquids in Chemical Analysis, CRC Press Taylor & Francis Group, 2009 Search PubMed.
- D. R. MacFarlane and K. R. Seddon, Aust. J. Chem., 2007, 60, 3 CrossRef CAS.
- A. S. Y. Lee, H. H. Yong, Y. J. Lee, S. K. Kim and S. Ahn, J. Phys. Chem. B, 2005, 109, 13663 CrossRef PubMed.
- E. R. F. d. Souza, J. C. Padilha, R. S. G. Alves and J. Dupont, Electrochem. Commun., 2003, 5, 728 CrossRef.
- Y. N. Yamanaka, R. Kawano, W. Kubo, N. Masaki, T. Kitamura, Y. Wada, M. Watanabe and S. Yanagida, J. Phys. Chem. B, 2007, 111, 4763 CrossRef PubMed.
- A. Balducci, U. Bardi, S. Caporali, M. Mastragostino and F. Soavi, Electrochem. Commun., 2004, 6, 566 CrossRef CAS PubMed.
- D. R. Macfarlane, M. Forsyth, P. C. Howlett, J. M. Pringle, J. Sun, G. Annat, W. Neil and E. I. Izgorodina, Acc. Chem. Res., 2007, 40, 1165 CrossRef CAS PubMed.
- J. Ding, D. Zhou, G. Spinks, G. Wallace, S. Forsyth, M. Forsyth and D. MacFarlane, Chem. Mater., 2003, 15, 2392 CrossRef CAS.
- S. Dai, Y. H. Ju, H. J. Gao, J. S. Lin, S. J. Pennycook and C. E. Barnes, Chem. Commun., 2000, 243 RSC.
- J. L. Bideau, L. Viau and A. Vioux, Chem. Soc. Rev., 2011, 40, 907 RSC.
- M. A. Neouze, J. L. Bideau, P. Gaveau, S. Bellayer and A. Vioux, Chem. Mater., 2006, 18, 3931 CrossRef CAS.
- J. Zhang, Q. Zhang, X. Li, S. Liu, Y. Ma, F. Shi and Y. Deng, Phys. Chem. Chem. Phys., 2010, 12, 1971 RSC.
- S. Bellayer, L. Viau, Z. Tebby, T. Toupance, J. L. Bideau and A. Vioux, Dalton Trans., 2009, 1307 RSC.
- Q. Z. Li, W. Fan and J. Zhan, Nanoscale, 2011, 3, 1646 RSC.
- J. Wang, H. Chu and Y. Li, ACS Nano, 2008, 2, 2540 CrossRef CAS PubMed.
- D. Petit, J. P. Korb, P. Levitz, J. L. Bideau, D. Guyomard and A. Vioux, AIP Conf. Proc., 2011, 85, 1330 Search PubMed.
- E. Delahaye, R. Gobel, R. Lobbicke, R. Guillot, C. Siebera and A. Taubert, J. Mater. Chem., 2012, 22, 17140 RSC.
- A. I. Horowitz and M. J. Panzer, J. Mater. Chem., 2012, 22, 16534 RSC.
- O. Fontaine, A. Touidjine, M. Marechal, C. Bonhomme, F. Ribot, B. Geffroy, B. Jousselme, C. Sancheza and C. L. Robert, New J. Chem., 2014, 38, 2008 RSC.
- A. Kavanagh, R. Copperwhite, M. Oubaha, J. Owens, C. McDonagh, D. Diamonda and R. Byrne, J. Mater. Chem., 2011, 21, 8687 RSC.
- A. Kavanagh, R. Byrne, D. Diamond and K. J. Fraser, Membranes, 2012, 2, 16 CrossRef CAS PubMed.
- Handbook of Sol–Gel Science and Technology Processing, characterization and applications, ed. H. Kozuka, Kluwer Academic Publishers (now springer), 2005, vol. 1 Search PubMed.
- A. Vioux, Chem. Mater., 1997, 9, 2292 CrossRef.
- L. L. Hench and J. K. West, Chem. Rev., 1990, 90, 33 CrossRef CAS.
- D. P. Debecker and P. H. Mutin, Chem. Soc. Rev., 2012, 41, 3624 RSC.
- A. K. Gupta, M. P. Singh, R. K. Singh and S. Chandra, Dalton Trans., 2012, 41, 6263 RSC.
- A. K. Gupta, R. K. Singh and S. Chandra, RSC Adv., 2013, 3, 13869 RSC.
- M. P. Singh, R. K. Singh and S. Chandra, ChemPhysChem, 2010, 11, 2036 CAS.
- M. P. Singh, R. K. Singh and S. Chandra, J. Phys. Chem. B, 2011, 115, 7505 CrossRef CAS PubMed.
- A. K. Gupta, Y. L. Verma, R. K. Singh and S. Chandra, J. Phys. Chem. C, 2014, 118, 1530 CAS.
- J. Zhang, J. G. Liu and J. Jonas, J. Phys. Chem., 1992, 96, 3478 CrossRef CAS.
- K. Morishige and K. Kawano, J. Phys. Chem. B, 2000, 104, 2894 CrossRef CAS.
- D. C. Steytler and J. C. Dore, Mol. Phys., 1985, 56, 1001 CrossRef CAS.
- Y. Shao and T. W. Zerda, J. Phys. Chem. B, 1998, 102, 3387 CrossRef CAS.
- S. J. Pas, M. S. Dargusch and D. R. MacFarlane, Phys. Chem. Chem. Phys., 2011, 13, 12033 RSC.
- M. E. V. Valkenburg, R. L. Vaughn, M. Williams and J. S. Wilkes, Fifteenth Symposium on Thermophysical Properties, 22–27 June 2003 Search PubMed.
- A. R. Choudhury, N. Winterton, A. Steiner, A. I. Cooper and K. A. Johnson, J. Am. Chem. Soc., 2005, 127, 16792 CrossRef CAS PubMed.
- R. Gobel, P. Hesemann, J. Weber, E. Moller, A. Friedrich, S. Beuermann and A. Taubert, Phys. Chem. Chem. Phys., 2009, 11, 3653 RSC.
- A. T. Lorenzo, M. L. Arnal, J. Albuerne and A. J. Muller, Polym. Test., 2007, 26, 222 CrossRef CAS PubMed.
- J. Albuerne, L. Marquez, A. J. Muller, J. M. Raquez, P. Degee, P. Dubois, V. Castelletto and I. W. Hamley, Macromolecules, 2003, 36, 1633 CrossRef CAS.
- A. J. Muller, J. Albuerne, L. Marquez, J. M. Raquez, P. Degee, P. Dubois, J. Hobbs and I. W. Hamley, Faraday Discuss., 2005, 128, 231 RSC.
- Y. L. Loo, R. A. Register and A. J. Ryan, Phys. Rev. Lett., 2000, 84, 4120 CrossRef CAS.
- S. K. Chaurasia, R. K. Singh and S. Chandra, CrystEngComm, 2013, 15, 6022 RSC.
- M. Gaowei, E. M. Muller, A. K. Rumaiz, C. Weiland, E. Cockayne, J. Jordan-Sweet, J. Smedley and J. C. Woicik, Appl. Phys. Lett., 2012, 100, 201606 CrossRef PubMed.
- S. E. Gustafsson, Rev. Sci. Instrum., 1991, 62, 797 CrossRef CAS PubMed.
- A. Triolo, A. Mandanici, O. Russina, V. Rodriguez-Mora, M. Cutroni, C. Hardacre, M. Nieuwenhuyzen, H. J. Bleif, L. Keller and M. A. Ramos, J. Phys. Chem. B, 2006, 110, 21357 CrossRef CAS PubMed.
- A. V. Blokhin, Y. U. Paulechka and G. J. Kabo, J. Chem. Eng. Data, 2006, 51, 1377 CrossRef CAS.
- M. Naffakh, C. Marco and M. A. Gomez-Fatou, J. Phys. Chem. B, 2011, 115, 2248 CrossRef CAS PubMed.
- R. Kanzaki, T. Mitsugi, S. Fukuda, K. Fujii, M. Takeuchi, Y. Soejima, T. Takamuku, T. Yamaguchi, Y. Umebayashi and S. Ishiguro, J. Mol. Liq., 2009, 147, 7 CrossRef PubMed.
- S. Zahn, F. Uhlig, J. Thar, C. Spickermann and B. Kirchner, Angew. Chem., Int. Ed., 2008, 47, 3639 CrossRef CAS PubMed.
- A. M. Fernandes, M. A. A. Rocha, M. G. Freire, I. M. Marrucho, J. A. P. Coutinho and L. M. N. B. F. Santos, J. Phys. Chem. B, 2011, 115, 4033 CrossRef CAS PubMed.
- M. A. Gebbie, M. Valtiner, X. Banquy, E. T. Fox, W. A. Henderson and J. N. Israelachvili, Proc. Natl. Acad. Sci. U. S. A., 2013, 110, 9674 CrossRef CAS PubMed.
- M. J. Avrami, J. Chem. Phys., 1939, 7, 1103 CrossRef CAS PubMed.
- M. J. Avrami, J. Chem. Phys., 1941, 9, 177 CrossRef CAS PubMed.
- E. Woo, J. Huh, Y. G. Jeong and K. Shin, Phys. Rev. Lett., 2007, 98, 136103 CrossRef.
- A. Tonisoo, J. Kruusma, R. Parna, A. Kikas, M. Hirsimaki, E. Nommiste and E. Lust, J. Electrochem. Soc., 2013, 60, A1084–A1093 CrossRef PubMed.
- T. Cremer, C. Kolbeck, K. R. J. Lovelock, N. Paape, R. Wclfel, P. S. Schulz, P. Wasserscheid, H. Weber, J. Thar, B. Kirchner, F. Maier and H. P. Steinrck, Chem.–Eur. J., 2010, 16, 9018 CrossRef CAS PubMed.
- J. Serra, P. Gonzalez, S. Liste, C. Serra, S. Chiussi, B. Leon, M. Perez-Amor, H. O. Ylanen and M. Hupa, J. Non-Cryst. Solids, 2003, 332, 20 CrossRef CAS PubMed.
- B. P. Grady, W. B. Gei, R. J. Lamirand and M. Shah, Polym. Eng. Sci., 2001, 41, 5 Search PubMed.
- M. E. V. Valkenburg, R. L. Vaughn, M. Williams and J. S. Wilkes, Thermochim. Acta, 2005, 425, 181 CrossRef PubMed.
| This journal is © The Royal Society of Chemistry 2014 |

