Nanoporous morphology control of polyethylene membranes by block copolymer blends

Hiroki Uehara*a, Makiko Kanoa, Hidekazu Tanakaa, Satomi Katoa, Hiroyasu Masunagab and Takeshi Yamanobea
aDivision of Molecular Science, Faculty of Science and Technology, Gunma University, Kiryu, Gunma 376-8515, Japan. E-mail: hirokiuehara@gunma-u.ac.jp
bJapan Synchrotron Radiation Research Institute, Sayo, Hyogo 679-5198, Japan

Received 26th February 2014 , Accepted 29th August 2014

First published on 1st September 2014


Abstract

Nanoporous polyethylene (PE) membranes prepared by etching treatment for diblock copolymers composed of PE and polystyrene (PS) are applicable for biotechnological interfaces of various devices. The conventional control of pore size is limited by block compositions or etching conditions. In this study, an increase in the removable PS component was enabled by blending the above base copolymer (PE-b-PS) with PS homopolymer or another block copolymer containing a greater PS content. A series of films of these blends were isothermally crystallized under the optimum conditions, and were mildly etched to prepare nanoporous membranes. Therefore, excellent robustness was achieved in the resultant nanoporous membranes, which is beneficial for wider applications. A desirable combination of precise pore dimensions and large pore volume was achieved by blending the PS homopolymer with lower molecular weight, compared to a nanoporous membrane prepared from pure base copolymer, which is also confirmed by molecular permeation tests.

Introduction

Recently, nanoporous membranes have received much attention in biological applications, including biosensors,1–5 tissue engineering,6 lab-on-a-chip,7 drug delivery,8,9 molecular separation,10–13 and sieves.14 A typical example is an anodic aluminium oxide membrane. The most remarkable characteristic of such inorganic membranes, including nanoporous silicon ones, is the straightness of the nanopores even for thicknesses exceeding micrometers.2 This is advantageous for rapid permeation of the molecules for filtration or separation. In contrast, its disadvantage is brittleness even when bent just slightly.

Similar straight nanopore channels have been obtained by track-etching polymeric membranes.15 These membranes are flexible and are thus widely applied for highly-sensitive sensing of single molecules, such as DNA strands.16 However, their pore volumes are restricted by a limitation of etching ion-beam density, which is undesirable for rapid molecular separation, including dialysis and water purification.

Block copolymer is another choice for preparing homogeneous nanoporous morphology because micro-phase separation on a nanometer scale is spread across the whole membrane. Selective etching or degradation of certain components leads to the homogeneous nanopore morphologies.11,13,17–23 Such morphological feature is desirable for size-sensitive permeation of targeted molecules, which is highly required for biosensors. In particular, a bicontinuous arrangement of different phases of block copolymers yields a dense network of nanopores, which also guarantees the desirable passing, even when some of the pores are blocked by diffusant fouling.24

Controlled synthesis of the starting block copolymer is necessary for the homogeneity of the segmental length of each block, giving precise phase separation morphologies. This applies in particular to bicontinuous phase separation, such as in double gyroid or ordered bicontinuous double diamond structures. Li et al.25 prepared a nanoporous membrane from a gyroid-type bicontinuous phase separation of polybutadiene-b-polydimethysiloxane. However, this ordered phase separation requires the narrowest distribution of the block lengths. Therefore, a “precise synthesis” technology for block copolymer is the key to the size control of the resultant nanoporous morphology.

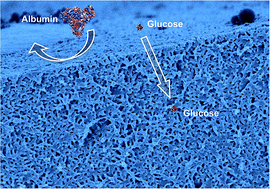
In contrast, we adopted another approach for preparing a bicontinuous phase arrangement. We focused on polymer crystallization, which can vary the composition of crystalline and amorphous phases. Indeed, diblock copolymer composed of polyethylene (PE) and polystyrene (PS), PE-b-PS, exhibits the desirable bicontinuous crystalline/amorphous phase separation when it is crystallized under optimum conditions.26,27 Selectively removing the amorphous phase of both PE and PS components through acid etching treatment yielded a characteristic network morphology of nanopores passing through the membrane thickness. The residual crystalline PE networks are the supporting component for this nanoporous membrane, thus it is robust and flexible. This is advantageous for micro electronic and mechanical system (MEMS) applications, which requires bending or rolling for assembly in the small space available in tiny devices. Indeed, various glucose sensing applications are widely developed by using polymeric materials.28 Therefore, we also applied this nanoporous PE membrane prepared from block copolymer precursor to a size-selective interface for an implantable glucose sensor.29 The permeation tests revealed that smaller glucose molecules pass through the nanoporous PE membrane, and larger albumin molecules are blocked, depending on the diameter of the prepared nanopores. The smaller pore diameter achieved by mild etching gives precise size-selectivity of molecular permeation, but takes a longer time for complete permeation of glucose molecules. In contrast, a larger pore diameter can shorten the permeation time, but the size selectivity will be restricted.

Other possible applications of nanoporous membranes are drug and nutriment release. The medical or essential components stored inside the membrane slowly diffuse out through the nanopores. The controlled permeation through the conjectured pore networks is preferable for desirable molecular releasing.

Blending block copolymers with homopolymers is a different approach for preparation of bicontinuous phase separation, and thus several research groups have applied this methodology for preparing nanoporous membranes.30 Our previous study31 also examined a blend of PE-b-PS exhibiting bicontinuous crystalline/amorphous phase arrangement with the other PE-b-PS having a longer PE block. The resultant increase in the PE component improved the continuity of the crystalline PE phase. In this study, the inverse increase of the PS component was attempted by blending same PE-b-PS with homopolymer PS or PE-b-PS containing a longer PS block. The PS component can be removed by fuming nitric acid (FNA) etching, thus an increase in the PS component can enhance the pore connectivity across the membrane thickness while maintaining precise nanopore dimension.

Such increase of etchable PS component also allows mild etching for nanopore formation, which is advantageous for improvement of mechanical properties of the prepared nanoporous membranes. Indeed, longer FNA etching destroys the crystalline PE components, resulting in the non-porous morphology.27,29 Short-time etching is preferable if the passing-though nanopore network is still obtainable. In this study, the mild etching for shorter time was applied for a series of blends containing greater PS content. The initial isothermally crystallized morphology were detected by scanning probe microscopy (SPM), and later etched nanopores were observed by scanning electron microscopy (SEM). The mechanical properties of such nanoporous membranes were estimated by tensile tests. The pore size distribution was evaluated by small-angle X-ray scattering (SAXS) profiles obtained using synchrotron radiation source at SPring-8. Glucose and albumin permeations were also compared for the prepared nanoporous membranes.

Experimental section

Materials

Table 1 lists the polymeric materials used in this study. All polymeric materials were purchased from Polymer Source, Inc., in Quebec, Canada. These polymers were blended by combining base copolymer (PE(67k)-b-PS(54k)) with 5 wt% of the other homopolymers (PS(10k) or PS(57k)) or block copolymer (PE(2.3k)-b-PS(50k)). Therefore, each blend contains 95 wt% of base copolymer. The base copolymer is the same material used in our previous studies.26,27,29,31
Table 1 Molecular characteristics of the polymeric materials used in this study
Sample Mwa Mw/Mnb
PE PS
a Weight (Mw) and number average molecular weights (Mn) were determined from GPC data.b Molecular weight distribution was evaluated by Mw/Mn.
PE-b-PS (base copolymer) 6.7 × 10⁴ 5.4 × 10⁴ 1.07
PS(10k) 1.0 × 10⁴ 1.09
PS(57k) 5.7 × 10⁴ 1.07
PE(2.3k)-b-PS(50k) 2.3 × 10³ 5.0 × 10⁴ 1.11


The chemical agents used for preparing the nanoporous membranes were p-xylene (98% purity) and fuming nitric acid (FNA) (97% purity) supplied from Wako Chemical in Japan. The D-glucose and bovine serum albumin (BSA) solutions for permeation tests were purchased from Aldrich in the USA.

Membrane preparation

The pure base copolymer or blend samples were dissolved at 1 wt% into p-xylene at its boiling point for 10 min, followed by casting at room temperature. Slow evaporation of xylene under atmospheric conditions gives the precursor film, followed by complete drying under vacuum. The obtained circular films are 90 mm in diameter and 35 μm thick. The thickness of the film was controlled by pouring an amount of solution into a Teflon dish. These membranes were melted at 180 °C and then isothermally crystallized at 90 °C in a vacuum oven for three days. Typical appearance of the precursor film was depicted in Fig. S1 (ESI).

FNA etching of the prepared films was performed at 20 °C for 1–5 min. An excess amount of FNA (10 ml) was added to 0.2 g of the above precursor film in a glass dish with a cover. Nitric acid molecules attack covalent chain bonds of PS components, giving the decomposed styrene monomers. Such styrene monomers are diffusible within nitric acid solution. Here, styrene monomer is also soluble to ethanol, thus the etched membrane was washed by ethanol. Water washing is effective to extract the residual nitric acid stored within the membrane pores. For complete removal of such decomposed styrene and residual acid, washings with water and ethanol were repeated by three times with their excess amounts. Such washed membranes were finally dried well at room temperature.

An asymmetric alumina membrane supplied by Whatman was adopted for comparison. It has a total thickness of 60 μm, but the active layer is limited to 1 μm thickness at the outer surface, with 20 nm pores. The other internal portions contain larger but straight pores 200 nm in diameter. An Advantec hydrophilic poly(tetrafluoroethylene) (PTFE) membrane filter with fibrillar structure (H010A047A) was also used. Its average pore diameter was 100 nm.

Membrane characterization

The morphologies of a series of isothermally crystallized films were observed by an environmental-controlled scanning probe microscopy (SPM) E-Sweep (SII Nanotechnology). SPM observation was performed in dynamic force mode (DFM) in a vacuum. The scanning area was a square with 1500 nm × 1500 nm, operated at 0.5 Hz. The cantilever used was an SII DF-20 equipped with a 10 nm-diameter Si3N4 tip.

The nanoporous morphologies of the etched membranes were observed using a Hitachi field-emission scanning electron microscopy (SEM) S-4800 operated at 1 kV. Both the membrane surface and a cleft edge were observed. The sample was coated with 5 angstrom-thick Pt–Pd before observation. For the latter edge view, the 5 min-etched membranes were selected and cleft within liquid nitrogen, and cross sections were analyzed by SEM observation.

The pore size distributions of the prepared membranes were evaluated from small-angle X-ray scattering (SAXS) profiles obtained using a synchrotron radiation source at BL40XU of SPring-8, Japan. SAXS patterns for the series of nanoporous membranes were recorded on a cooling-type CCD camera coupled with an image intensifier (Hamamatsu Photonics, C4742-98-24 ER and C7876). The wavelength of the synchrotron beam was 0.1 nm. The exposure time for each pattern was 100 ms. The camera length was 3200 mm. The line profiles were extracted from these patterns and calibrated by sample thickness.

The tensile tests were conducted at room temperature. The specimens were cut into 30 mm long and 5 mm wide strips from the prepared PE nanoporous membranes. These strips were tensile-drawn at a constant cross-head speed, corresponding to an initial strain rate of 1 min−1, in an Orientec Tensilon tensile tester RTC-1325A. The tensile strength was calculated from the maximum recorded stress at the breaking point.

Glucose and albumin permeation tests were performed for 24 hours using the test cell having input and output chambers, separated by the porous membrane to be tested (Fig. S2 ESI). A solution with a given concentration of the solute of interest was set in an input chamber, and an output chamber was filled with ultra-pure water for the glucose permeation test, and with 150 mM-NaCl aq. for the albumin retention test, at the beginning of each experiment. Both chambers were stirred by standard Teflon magnetic stirrers throughout the entire experiment. All of the permeation tests were conducted at 23 °C. 24 hour-permeation was defined as a standard condition for comparison of equilibrium molecular permeation characteristics of the prepared membranes.

For the glucose permeation test, 100 mM-D-glucose in an ultra-pure water solution was initially put in an input chamber. The glucose concentration of the liquid in the other output chamber was measured by Atago RX-5000α refractometer using the 589.3 nm sodium D line. The obtained refractive indices were converted to glucose concentrations using a standard calibration line determined by the plots of the refractive indices for known concentrations of glucose in ultra-pure water (Fig. S3A ESI).

In the albumin permeation tests, a 1.0% BSA solution (also containing 150 mM-NaCl) was initially put in an input chamber. The liquid in the output chamber was measured with UV spectroscopy using a Hitachi UV-VIS U-3010 spectrometer. The absorbance at 280 nm was used as an index of the BSA concentration. The standard calibration line was determined by the plots of the absorbance for given concentrations of BSA (Fig. S3B ESI), the same as for the glucose calibration.

Attenuated total reflection (ATR) type Fourier-transformed infrared (FTIR) spectroscopy measurements were performed using a Perkin-Elmer Spectrum Two UATR spectrometer at room temperature. Four scans were deconvoluted for each measurement.

Results and discussion

Four materials were used in this study. The base copolymer was PE(67k)-b-PS(54k) composed of a PE segment with a molecular weight (MW) of 6.7 × 10⁴ and a PS segment with a MW of 5.4 × 10⁴. This base copolymer exhibits a bicontinuous crystalline/amorphous phase arrangement induced by an isothermal crystallization procedure.26,27,29 Three materials were selected as the blending counterparts for preparing a bicontinuous arrangement with a larger amorphous phase. One was a homopolymer PS(57k) with a MW similar to that of the PS component of the base copolymer. Homopolymer PS(10k) was more diffusible, thus the desirable homogeneity with the base copolymer components was anticipated. The third material, PE(2.3k)-b-PS(50k), is a block copolymer composed of PE and PS, but with a lower MW of its PE component than that of the base copolymer. Here, our previous study31 examined blending the same base copolymer and PE(48.6k)-b-PS(5.8k). For such an inverse blending with a larger PE component, the bicontinuous crystalline/amorphous phase arrangement was maintained when the blending ratio of the counter material PE(48.6k)-b-PS(5.8k) was below 15 wt% (namely, 85 wt% of the base copolymer). The total PE component within the whole blend increased 3 wt% from the initial 55 wt% for the base copolymer alone. For the homopolymer PS blending in this study, a 5 wt% addition with base copolymer achieves a corresponding 3 wt% increase in the PS component. Therefore, the blend ratio of the counter material was fixed at 5 wt%. Also, the isothermal crystallization was performed at 90 °C, which is the optimum condition for the base copolymer.26,27,29 The typical thickness of the prepared films was adjusted at 35 μm, which is double of that for the previous studies27,29 because the resultant membrane robustness is beneficial for various applications.

Morphological comparison of isothermally crystallized films

The surfaces of these precursor films were totally flat, thus the usual SEM observation could not detect micro phase separation attributed to base copolymer morphology. Therefore, SPM observation was adopted to characterize the isothermally crystallized films prepared in this study. In particular, DFM can successfully distinguish the PE and PS phases due to the difference in surface stiffness. Fig. 1 presents a set of height (left) and phase images (right) obtained by DFM observations for isothermally crystallized films of pure base copolymer, PE(67k)-b-PS(54k), and a series of blends with homopolymer PS(10k), PS(57k), and the other copolymer, PE(2.3k)-b-PS(50k). In the case of the height images, the dark and bright regions mean the higher and lower levels. In contrast, these regions in the phase image are softer and harder phases. A comparison of these height and phase images suggests that the higher region corresponds to the softer phase and the lower region corresponds to the harder phase, which should be PE or PS components. Considering that the glass transition temperatures of PE and PS are −100 °C and 100 °C,32 the softer (higher) phase corresponds to PE component, and the harder (lower) phase corresponds to PS component for SPM images observed at room temperature.
image file: c4ra01676a-f1.tif
Fig. 1 SPM height images (left) and phase images (right) of the crystallized films prepared from (A and E) pure base copolymer and blends with (B and F) PS(10k), (C and G) PS(57k) and (D and H) PE(2.3k)-b-PS(50k). Scale bar, 200 nm.

The pure base copolymer exhibits typical bicontinuous morphology consisting of PE and PS phases (Fig. 1A and E). In our previous studies,27 a combination of grazing SEM and transmission electron microscopy observations for this base copolymer PE(67k)-b-PS(54k) revealed that both phases are interconnected each other. In contrast, the blend with homopolymer PS(10k) produces the typical phase separation due to enhanced continuity of the PS components (Fig. 1B and F), but the boundaries between PS and PE phases look vaguer than those for pure base copolymer. PS homopolymer blending reduces the relative PE component, leading to the appearance of PE cylinders within the PS matrix. Here, the blending ratio of homopolymer PS is low at 5 wt% with 95 wt% base copolymer, thus the actual component ratio of PS to PE (47.2 wt%) for the blend film increases only 3 wt% from that for the original base copolymer (44.6 wt%). Such 3 wt% difference is obvious change in the phase diagram because the region of the bi-continuous phase separation morphology, c.f. double gyroid structure, in the phase diagram of block copolymers is generally very narrow.33 This means that even 5 wt% blending of counter component can modify the original phase separation morphology of base copolymer.

The second blend with homopolymer PS(57k) exhibited a minor but apparent region of PS aggregation in the SPM image (Fig. 1C and G). This indicates heterogeneous mixing even with the similar MW of 54k for the PS component of the base copolymer. Such coexistence of the aggregated and bicontinuous phase arrangements on the film surface is quite different from their mixture for the blend with the low-MW PS(10k).

A copolymer pair of base copolymer and PE(2.3k)-b-PS(50k) also exhibited a morphology similar to that obtained for the blend with homopolymer PS(10k) (Fig. 1D and H). PE(2.3k)-b-PS(50k) has a MW comparable to the PS component of homopolymer PS(57k), but the MW of the PE component is lower than that of base copolymer, which allows the preferable molecular mixing within the PE components of both copolymers.

Nanoporous morphologies prepared by FNA etching

FNA etching treatments were undertaken to prepare nanoporous PE membranes from the above series of base copolymer blends with homopolymers or the other copolymer. Our previous studies27,29 revealed that extending the etching time collapses the backbone networks composed of PE crystalline components, leading to undesirable fouling of the nanopores. Therefore, short-time FNA etching was applied in this study to improve the membrane robustness, i.e., 1 min and 5 min. As described later, the desirable size-selective diffusion of vital molecules was achieved for the nanoporous PE membranes prepared with these short-time FNA treatments.

The resultant nanoporous morphologies obtained for 1 min- and 5 min-etching are compared in Fig. 2. The SEM observation was adopted because it can detect the internal morphology through nanopores. In contrast, SPM observation emphasizes the surface morphological information for the regions where analyzing tips with 10 nm radius reaches. Therefore, it is usually difficult to identify the pores deeply penetrating from the top surface for SPM observation.


image file: c4ra01676a-f2.tif
Fig. 2 SEM images for nanoporous membranes prepared from (A and E) pure base copolymer and blends with (B and F) PS(10k), (C and G) PS(57k) and (D and H) PE(2.3k)-b-PS(50k). The etched times were 1 min (left) and 5 min (right). Scale bar, 100 nm.

Isolated nanopores are observed for 5 min-etched membrane of pure base copolymer (Fig. 2E), but continuity of such nanopore network is less recognized. For the shorter etching for 1 min, similar but indistinct nanoporous morphology is observed, as depicted in Fig. 2A. This means that the 5 min-etching is not enough for continuous nanopore formation of pure base copolymer membrane.

In contrast, the etched membrane prepared from the blend with the homopolymer PS(10k) exhibited the elongated nanopores, independent of etching time (Fig. 2B and F). This morphology is coincident with the original cylindrical phase separation before etching (Fig. 1B and F). Such rapid nanopore formation indicates that the faster etching penetration for homopolymer PS(10k) than for pure block copolymer gives the desirable continuity of nanopores.

The other homopolymer blend with PS(57k) exhibits the spherical nanopores (Fig. 2C and G). These morphologies are ascribed to the original aggregated homopolymer components with bicontinuous phase separation of the base copolymer (see Fig. 1C and G). As discussed above, etching penetration for homopolymer PS is faster than base block copolymer, thus similar spherical nanopores are observed even for the 1 min-etching, as depicted in Fig. 2C.

In the case of the other asymmetrical copolymer blend with PE(2.3k)-b-PS(50k), the elongated nanopores are emphasized even for 1 min-etching, as depicted in Fig. 2D, but gradually transformed into the bicontinuous networks composed of the wider pore channels (Fig. 2H). Considering that the un-etched morphology in Fig. 1D and H also exhibits the cylindrical phase separation similar to the blend with homopolymer PS(10k), the “two-step” etching is assumable for this blend with PE(2.3k)-b-PS(50k). Here, the MW of PE component for the counter PE(2.3k)-b-PS(50k) is much lower than that for base copolymer. Our previous study34 for blending a pair of homopolymer PE with different MWs suggests that the lower MW component concentrates on the region near the film surface, due to the higher molecular motion during crystallization. A similar concentration of the PE(2.3k)-b-PS(50k) component increases the PS component in the region near the surface of the precursor film, resulting in the elongated nanopores for short-time etching. However, the longer-time etching gradually reveals the wider nanopore networks, similar to those obtained for the complete 30 min-etching for pure base copolymer film obtained in our previous studies.27,29 This means that the surface segregation of the PE(2.3k)-b-PS(50k) component accelerates the nanopore formation even for short-time etching in this study.

In contrast, blending two homopolymer PS with different MW causes homogeneous composition from surface to internal,35 thus each nanopore characteristic for the blend with homopolymer PS(10k) or PS(57k) is independent of the etching time, as discussed above. These comparisons suggest that the morphological heterogeneity across the membrane thickness for the blend with PE(2.3k)-b-PS(50k) is caused by phase separation of PE components originated from base copolymer and blended counter copolymer during melt-recrystallization of the precursor film.

In order to characterize the homogeneity of pore geometry across the membrane thickness, the cross-section of these nanoporous membranes prepared from the blend systems were analyzed by SEM observation. Fig. 3 compares the cleft-edge morphologies obtained for a series of 5 min-etched membranes. Both regions near the surface and internal were compared for each membrane. These results also allow us evaluate the pore continuity from the regions near the surface into the membrane bulk. For pure base copolymer (Fig. 3A and E), the isolated nanopores spread across the whole membrane region, but their connection is less remarkable.


image file: c4ra01676a-f3.tif
Fig. 3 SEM comparison of internal structures for a series of nanoporous membranes prepared from (A and E) base copolymer, and blend with (B and F) PS(10k), (C and G) PS(57k) and (D and H) PE(2.3k)-b-PS(50k). The membranes were cleft within liquid nitrogen, and cross sections were analysed by SEM observation. The regions near the surface and internal membrane were compared for the left and right columns. The etched time was all 5 min. Scale bar, 200 nm.

In contrast, the blend with homopolymer PS(10k) gives the continuous nanopore networks, independent of the position across the membrane thickness, as depicted in Fig. 2B and F. In the case of the blend with homopolymer PS(57k) in Fig. 3C and G, the larger pore pockets are observable here and there within the membrane thickness, corresponding to the spherical aggregation for the initial isothermally-crystallized film (Fig. 1C and G). These pore pockets homogeneously distribute both at the surface and internal regions. The remarkable nanopore morphology observed for the blend with PE(2.3k)-b-PS(50k) (Fig. 2D) is also confirmable for the cleft edge in Fig. 3D and H. The obvious bicontinuous nanopore networks across the membrane thickness was similar to those for the 30 min-etched membrane of the pure base copolymer,27,29 which nanopore size is larger than 5 min-etched membrane of pure base copolymer (Fig. 3A and E). Such morphological uniformity across our nanoporous membranes is quite different from the asymmetrical pore morphology for commercial ultrafiltration membranes.15 The size-selectivity is secured through the entire thickness of such nanoporous membranes, which provides more accurate size-selective permeation of diffusant molecules, as discussed latter.

Recently, Jones et al.36 obtained nanoporous PE thin film prepared from a ternary blend of PE-b-poly(ethylene-alt-propylene) (PE-b-PEP) with PE homopolymer, and PEP copolymer. The blended PEP copolymer is selectively removed by solvent dissolving, but the PEP block in the PE-b-PEP remains. Wong et al.37 also applied blending PS-b-PE-b-PS with PS homopolymer to obtain nanoporous membrane, where PS homopolymer alone is removed by solvent etching. In contrast, our FNA etching can degrade PS components of base copolymer as well as PS homopolymer components within the blends, which is advantageous to control pore size and volume even for bulk membrane with several tens of micrometer thickness.

Pore size evaluation from SAXS measurements

Recently, Wong et al.37,38 estimated the pore size from SAXS profiles obtained for nanoporous membranes prepared by solvent etching. We also analyze both initial phase separations and resultant porous morphologies from SAXS profiles for these series of the blend samples.

Fig. 4 depicts SAXS profiles recorded for the series of un-etched precursor films prepared in this study. Obviously, there are two types of profile shapes; one is sharper for A and D, but the other is broader for C and D. The former type was prepared from pure base copolymer and blend with the other block copolymer, PE(2.3k)-b-PS(50k), meaning that copolymer blending maintains the initial bicontinuous phase separation of pure base copolymer, which is also confirmed from SPM observations in Fig. 1D and H. In contrast, blending with homopolymer PS(10k) or PS(57k) disorders the phase separation, giving the broader long-period peaks. Here, characteristic spherical PS components are observed for the blend with PS(57k) in Fig. 1C and G. The vaguer boundaries of phase separation for the blend with PS(10k), as depicted in Fig. 1B and F, cause the less pronounced long-period peaks in Fig. 4C.


image file: c4ra01676a-f4.tif
Fig. 4 SAXS profiles for a series of isothermally melt-crystallized films prepared from (A) base copolymer, and blend with (B) PS(10k), (C) PS(57k) and (D) PE(2.3k)-b-PS(50k). These profiles were calibrated by the sample thickness.

Fig. 5 compares the SAXS line profiles for a series of 5 min-etched membranes. The data for the 1 min-etched series are also plotted in Fig. S4 (ESI). With increasing etching time, the long period peaks in SAXS profiles are gradually emphasized and shifted into the lower-q side. This means that the pore size shifts to the larger side for 5 min-etched membrane. These changes induced by etching are attributed to selective removal of PS components. Pore formation caused by replacement of PS components enhances the scattering intensity. In contrast, the increasing long-period with etching is ascribed to gradual growth of nanopores, as revealed by SEM observations in Fig. 2 and 3.


image file: c4ra01676a-f5.tif
Fig. 5 Comparison of SAXS profiles for a series of nanoporous membranes prepared from (A) base copolymer, and blend with (B) PS(10k), (C) PS(57k) and (D) PE(2.3k)-b-PS(50k). Etching time was always 5 min.

The averaged pore diameter and its dimensional distribution were estimated from these SAXS profiles, assuming PE cylinders with hexagonal paracrystal lattice arrangement with the interface of residual PS components within the empty matrix space. For this SAXS analysis,39 the following eqn (1) was fitted to the observed profiles for the series of 5 min-etched membranes. It is assumed that the length of the cylinder is sufficiently longer than the diameter, the cylinders are present enough, and randomly orient in a scattering volume. Total scattered intensity Q(q) is described by the following formula:

 
Q(q) ∼ q[〈|f2|〉 − |〈f〉|2 + |〈f〉|2Z1Z2] (1)
where, q is a scattering vector. A function derived the shape of cylinder f is given by
 
image file: c4ra01676a-t1.tif(2)
where, A2Δρ is a constant parameter depending on the apparatus and sample density. J1 is Bessel function of the first kind. R is a radius of the cylinder. σs is a parameter characterizing the interface thickness of the cylinders along their radii. We assume that the distribution of the cylinder radius is given by a Gaussian distribution with a variance σR. Z1 and Z2 are given by
 
image file: c4ra01676a-t2.tif(3)
 
image file: c4ra01676a-t3.tif(4)
where,
 
image file: c4ra01676a-t4.tif(5)

By integrating from 0 to 2π for φ, Q(q) is calculated. a is the distance between cylinders. Δa is associated with paracrystal distortion factor g; (g = (Δ2a/a2)1/2). When a pore exist between the cylindrical backbone, the pore diameter is represented by image file: c4ra01676a-t5.tif. The volume fraction of pore (porosity) are calculated by image file: c4ra01676a-t6.tif.

The fitting example is depicted in Fig. 6 for the 5 min-etched membrane of the blend with PS(10k). There are three peaks in this q range, which are well reproduced in the simulated profile. Similar adequate fittings were achieved for the other 5 min-etched membranes.


image file: c4ra01676a-f6.tif
Fig. 6 Comparison of observed SAXS profile (blue) and the simulated one (red) assuming the cylindrical backbone distribution for the 5 min-etched membrane prepared from the blend with PS(10k).

The obtained pore characteristics are summarized in Table 2. Pore size distribution is evaluated by σR. The g values are similar in the range of 0.15–0.17. The pore diameter and volume for pure copolymer membrane were 15.1 nm and 19.1%, which are both smallest in a series of 5 min-etched membranes prepared in this study. These results are coincident with the pore morphologies shown in Fig. 2E, 3A and E. Also, the interfacial thickness is smallest, ascribed to the sharp boundaries between PS and PE phases in the precursor film, which agrees with the precursor morphology depicted in Fig. 1A and E. In contrast, the blend membranes exhibit the larger values, which are attributed to the enhanced pore continuities. Among these blends, the narrowest pore size distribution is obtained for the blend with PS(10k), as expected in Fig. 2F, 3B and F. In the case of the blend with PS(57k), the heterogeneous spherical pores in Fig. 2G, 3C and G result in the largest pore diameter and volume. The other blend with PE(2.3k)-b-PS(50k) give a little smaller values of pore diameter and volume, but the widest distribution, which are coincident with SEM observations on membrane surface (Fig. 2H) and edge (Fig. 3D and H).

Table 2 Pore characteristics and permeations of albumin and glucose for nanoporous membranes prepared from (A) base copolymer, and blends with (B) PS(10k), (C) PS(57k) and (D) PE(2.3k)-b-PS(50k). Results for (E) commercial alumina nanoporous membrane and (F) porous PTFE membrane filter were also included. Etching treatment for these nanoporous membranes were performed for 5 min
Tested membrane   A B C D E F
a Averaged pore diameters for commercial alumina (E) and PTFE membranes (F) were the catalogue values.
Pore diameter (nm)   15.1 19.8 21.1 20.4 20a 100a
Pore size distribution (nm)   3.4 3.3 3.5 3.6
Interfacial thickness (nm)   4.7 5.8 5.2 5.0
Pore volume (%)   19.1 25.9 29.0 26.5
Permeation (%) Albumin 2 4 10 11 22 32
Glucose 26 95 82 85 92 100


Here, our previous study27 reveals that 30 min etching achieves the resultant 50% porosity for pure base copolymer. This value exceeds PS component volume in the precursor copolymer, which indicates that all the PS components are removed. In contrast, the porosities for the above series of nanoporous membranes prepared from the blends are 20–30%, thus the half of the PS components are remained in the resultant membranes. Namely, mild etching for shorter time in this study does not decompose all the PS components in the precursor films. However, the pores are continued thorough membrane thickness, which is confirmable from the molecular permeation tests, as described below.

Molecular permeation of nanoporous membranes

Molecular permeation tests were performed for the series of nanoporous PE membranes prepared above in order to test the molecular size-selectivity for diffusion or filtration.29 Table 2 summarizes the results obtained for 5 min-etched membranes prepared with various blending counter materials. For comparison, two commercial nanoporous membranes were also tested. One was an alumina membrane composed of straight pores with 20 nm diameter passing through the membrane thickness, and the other was a hydrophilic PTFE membrane filter having network nanopores with 100 nm diameter backbone. The former alumina membrane almost completely passed the glucose molecules (92% permeation), but the albumin molecules were also diffusible (22% permeation). This indicates that a commercial nanoporous alumina membrane cannot separate glucose molecules from albumin molecules. A PTFE membrane filter also completely passes the glucose molecules, but exhibits much greater albumin permeation (32%) than alumina membrane because of its larger pore diameter.

Nanoporous PE membranes prepared from pure base copolymer can block albumin permeation at 2% but also yields the lowest glucose permeation of 26%, which is predictable from the pore volume in Table 2. In contrast, a membrane prepared from a blend with the homopolymer PS(10k) achieved the desirable combination of high glucose permeation (95%) and low albumin permeation (4%). Such enhanced glucose permeation with keeping albumin retention is desirable for rapid and precise sensing the glucose concentration if it is applied as the interface of glucose sensors. This is attributed to the greater pore volume for this blend membrane, which accelerates glucose permeation, while the conjectured narrower nanopore channels still block albumin permeation although the albumin is smaller than the estimated pore diameter of the prepared nanoporous membranes. It should be noted that the pore size distribution is narrowest for this membrane, resulting in the superior size-selective permeation of glucose and albumin molecules.

A nanoporous membrane prepared from a blend with the homopolymer PS(57k) exhibited inferior size selectivity, with 82% glucose permeation and 10% albumin permeation. The characteristic spherical nanopores give the largest pore diameter and volume, which are less effective for the size-selectivity for molecular permeation. Another nanoporous membrane prepared from an asymmetrical copolymer blend with PE(2.3k)-b-PS(50k) produced a similar size selectivity to that for the blend with the homopolymer PS(57k). Leaks of the larger albumin molecules for these membranes prepared from the blends with PS(57k) and PE(2.3k)-b-PS(50k) agree with the larger pore size distribution in Table 2.

These results indicate that narrower pore size distribution is advantageous for the size selectivity in the molecular permeation. Also, the larger pore volume is desirable for the rapid diffusion of glucose molecules. Here, molecular size of albumin is still smaller than the estimated pore diameters listed in Table 2, but diffusion prevented through pore junctions within our nanoporous membranes contributes the size-selectivity for molecular permeation obtained in this study.

Li et al.40 reported that poly(ethylene glycol) molecules in water solution can cause heavy fouling of nanoporous hydrophobic membranes prepared by selective thermal degradation of the counter segments. In contrast, nanopores for our PE membranes are created by FNA etching, which induces hydrophilic groups of –NO2 or –COOH. Such existences of hydrophilic groups are confirmed by ATR-FTIR measurements, as depicted in Fig. 7. With comparison to those for the initial isothermally crystallized films before etching, the peaks assigned to carbonyl and nitro groups newly appear around 1345, 1517, 1598 and 1723 cm−1 after etching. Such hydrophilic chemical structures on the membrane surface and pore walls can prevent albumin fouling on permeation tests applied in this study. For further resistance of biomolecular fouling, the surface modification is considerable using the other hydrophilic groups as reaction sites. Seo et al.41 reported that the PDMS and PE surface can be successfully modified by phospholipid polymer for antifouling and lubrication of artificial knee or hip joints. Very recently, Kato et al.42 modified the hydrophobicity of nanoporous PE by blending the counter block copolymer containing the functional groups. Similar surface modification technology is available for nanopore walls of our PE membranes prepared in this study. Such additional treatments may provide effective control of bio-fouling for our nanoporous PE membranes, but they should be future study.


image file: c4ra01676a-f7.tif
Fig. 7 Comparison of ATR-FTIR spectra for a series of nanoporous membranes prepared from (A) base copolymer, and blend with (B) PS(10k), (C) PS(57k) and (D) PE(2.3k)-b-PS(50k). Etching time was always 5 min. The spectra for membranes B to D were placed every 15% downward, compared to the standard height for membrane A. The arrows indicate the peaks assigned to carbonyl and nitro groups induced by FNA treatments.

Mechanical properties of prepared membranes

The mechanical properties of the resultant nanoporous membranes were finally compared. Fig. 8 depicts the stress–strain curves recorded at room temperature for the series of 5 min-etched membranes. The obtained nanoporous membrane was very flexible, thus the strips cut from the membranes could be knotted without breaking, independent of blend system. Such desirable flexibility was similar to that for the 30 min-etched membrane of pure block-copolymer prepared in our previous study,29 but the tensile strength was remarkably increased in the present study, due to the shorter time of etching. It should be noted that such 30 min-etched membrane of pure base copolymer gives the larger pore diameter (30 nm) and pore volume (50%),27,29 due to the complete removal of all amorphous PE and PS components. For comparison, its stress–strain curve is also included in Fig. 8.
image file: c4ra01676a-f8.tif
Fig. 8 Comparison of stress–strain curves for 5 min-etched membranes prepared from (A) pure base copolymer and blends with (B) PS(10k), (C) PS(57k) and (D) PE(2.3k)-b-PS(50k). For comparison, data for the previous 30 min-etched membrane of pure base copolymer (E) are also included. All tensile tests were made at room temperature.

The maximum tensile strength of 17 MPa was obtained for the 5 min-etched membrane of pure block-copolymer, which is quadrupled from that for the previous 30 min-etched membrane. However, this membrane exhibited inferior permeability of glucose molecules, as depicted in Table 2. Less continuity of nanopores, as depicted in Fig. 2E, 3A and E, is advantageous for the mechanical properties of this membrane, but is not suitable for molecular permeation.

The second strength was 14 MPa for the membrane prepared from the blend with PS(57k). This is also attributed to the heterogeneous morphology composed of the spherical nanopores. Correspondingly, glucose permeation of this membrane is in 80% level, which is inferior to that for the previous 30 min-etched membrane of pure base copolymer. In turn, the polymer matrix is continuous, giving the superior mechanical properties.

The other blends with PE(2.3k)-b-PS(50k) and PS(10k) gave the third and fourth values around 11 MPa, which are still tripled to that for the previous 30 min-etched membrane. Glucose permeation of latter blend is highest in this study, but blockage of albumin permeation is almost perfect. Such a combination of superior size selective permeation and membrane robustness is preferred for the interface of the implantable MEMS devices.

Another possible approach for practical usage of such robust nanoporous membranes is pressurization during permeation testing. For dialysis, the solution is pressurized to shorten the treatment time, which improves the quality of life for diabetic patients. The superior mechanical properties of our nanoporous membranes are also desirable for such pressurized filtration. The flux measurements for the prepared nanoporous membranes are also important, but succeed to the future study.

Although the glucose sensor requires the rapid permeation, the long-term permeation is targeted for drug or nutriment molecular release. The 24 hour-permeation adopted in this study is the intermediate condition for the evaluation of permeation characteristics of the prepared membranes. The shorter and longer permeation tests are also considered in the future study.

Conclusions

A series of the nanoporous PE membranes could be prepared by mild FNA etching the isothermally crystallized films composed of base copolymer and blended PS components. An isothermally crystallized film of the blend with homopolymer PS(10k) produced a cylindrical phase separation. Such morphology narrows the distribution of resultant nanopore size, but preferable pore continuity was confirmed even within the membrane internal, giving the resultant larger pore volume, compared to that for pure base copolymer membrane. In contrast, the blend with the other homopolymer PS(57k) exhibits the aggregation of the blended PS component, due to its higher MW, within the isothermally crystallized film. Therefore, the largest pore diameter and volume were obtained after etching of this blend film. The blend of base copolymer and the other block-copolymer PE(2.3k)-b-PS(50k) also gives a cylindrical morphology after isothermal crystallization, resulting in the elongated nanopore morphology for short-time etching. However, the gradual transformation into the remarkable networks composed of the wider nanopores with longer etching time gives the largest pore size distribution among a series of 5 min-etched membranes in this study. Molecular permeation tests were also conducted for this series of nanoporous PE membranes. A desirable combination of rapid glucose diffusion and stable albumin retention was obtained for the nanoporous membrane prepared from the blend with homopolymer PS(10k), due to the connective nanopore networks with the narrowest pore size distribution. The excellent robustness of these nanoporous membranes was also preferred for various practical applications.

Acknowledgements

This work was financially supported by the Industrial Technology Research Grant Program from the New Energy and Industrial Technology Development Organization (NEDO) of Japan and the Suzuki Foundation. SAXS measurements using synchrotron radiation were performed at SPring-8, Japan Synchrotron Radiation Research Institute (2013A1657). The authors acknowledge to Ms Kiyomi Okada (Perkin-Elmer Japan) for ATR-FTIR measurements of the series of nanoporous membranes.

Notes and references

  1. S. Saha, S. K. Arya, S. P. Singh, K. Sreenivas, B. D. Malhotra and V. Gupta, Biosens. Bioelectron., 2009, 24, 2040 CrossRef CAS PubMed.
  2. C. Boss, E. Meurville, J.-M. Sallese and P. Ryser, Biosens. Bioelectron., 2011, 30, 223 CrossRef CAS PubMed; C. Boss, E. Meurville, J.-M. Sallese and P. Ryser, J. Membr. Sci., 2012, 401–402, 217 CrossRef PubMed.
  3. A. de la Escosura-Muñiz and A. Merkoçi, ACS Nano, 2012, 6, 7556 CrossRef PubMed.
  4. I. Vlassiouk, P. Y. Apel, S. N. Dmitriev, K. Healy and Z. S. Siwy, Proc. Natl. Acad. Sci. U. S. A., 2009, 106, 21039 CrossRef CAS PubMed.
  5. I. Mey, C. Steinem and A. Janshoff, J. Mater. Chem., 2012, 22, 19348 RSC.
  6. X. Liang, A. D. Lynn, D. M. King, S. J. Bryant and A. W. Weimer, ACS Appl. Mater. Interfaces, 2009, 1, 1988 CAS.
  7. Q. Xie, Q. Zhou, F. Xie, J. Sang, W. Wang, H. A. Zhang, W. Wu and Z. Li, Biomicrofluidics, 2012, 6, 016502 CrossRef PubMed.
  8. G. Jeon, S. Y. Yang and J. K. Kim, J. Mater. Chem., 2012, 22, 14814 RSC.
  9. K.-H. Lo, M.-C. Chen, R.-M. Ho and H. W. Sung, ACS Nano, 2009, 3, 2660 CrossRef CAS PubMed.
  10. M.-H. Park, C. Subramani, S. Rana and V. M. Rotello, Adv. Mater., 2012, 43, 5862 CrossRef PubMed.
  11. E. A. Jackson and M. A. Hillmyer, ACS Nano, 2010, 4, 3548 CrossRef CAS PubMed.
  12. X. Qiu, H. Yu, M. Karunakaran, N. Predeep, S. P. Nunes and K.-V. Peinemann, ACS Nano, 2013, 7, 768 CrossRef CAS PubMed.
  13. E. A. Jackson, Y. Lee and M. A. Hillmyer, Macromolecules, 2013, 46, 1484 CrossRef CAS.
  14. D.-H. Choi, Y. D. Han, B.-K. Lee, S.-J. Choi, H. C. Yoon, D.-S. Lee and J.-B. Yoon, Adv. Mater., 2012, 24, 4408 CrossRef CAS PubMed.
  15. C. N. LaFratta and D. R. Walt, Chem. Rev., 2008, 108, 614 CrossRef CAS PubMed.
  16. R. Gasparac, B. J. Taft, M. A. Lapierre-Devlin, A. D. Lazareck, J. M. Xu and S. O. J. Kelley, J. Am. Chem. Soc., 2004, 126, 12270 CrossRef CAS PubMed.
  17. H. Mao and M. A. Hillmyer, Soft Matter, 2006, 2, 57 RSC; S. Guo, J. Rzayev, T. S. Bailey, A. S. Zalusky, R. Olayo-Valles and M. A. Hillmyer, Chem. Mater., 2006, 18, 1719 CrossRef CAS; B. W. Boudouris, C. D. Frisbie and M. A. Hillmyer, Macromolecules, 2008, 41, 67 CrossRef; D. A. Olson, L. Chen and M. A. Hillmyer, Chem. Mater., 2008, 20, 869 CrossRef; W. A. Phillip, M. Amendt, B. O'Neill, L. Chen, M. A. Hillmyer and E. L. Cussler, ACS Appl. Mater. Interfaces, 2009, 1, 472 Search PubMed; L. M. Pitet, M. A. Amendt and M. A. Hillmyer, J. Am. Chem. Soc., 2010, 132, 8230 CrossRef PubMed; M. Vayer, T. H. Nguyen, D. Grosso, C. Boissiere, M. A. Hillmyer and C. Sinturel, Macromolecules, 2011, 44, 8892 CrossRef.
  18. A. Laforgue, C. G. Bazuin and R. E. Prud'homme, Macromolecules, 2006, 39, 6473 CrossRef CAS.
  19. T. S. Bailey, J. Rzayev and M. A. Hillmyer, Macromolecules, 2006, 39, 8772 CrossRef CAS.
  20. M. Zhang, L. Yang, S. Yurt, M. J. Misner, J.-T. Chen, E. B. Coughlin, D. Venkataraman and T. P. Russell, Adv. Mater., 2007, 19, 1571 CrossRef CAS PubMed; D. A. Rider, K. A. Cavicchi, L. Vanderark, T. P. Russell and I. Manners, Macromolecules, 2007, 40, 3790 CrossRef; S. Park, J.-Y. Wang, B. Kim, J. Xu and T. P. Russell, ACS Nano, 2008, 2, 766 CrossRef PubMed.
  21. K.-V. Peinemann, V. Abetz and P. F. W. Simon, Nat. Mater., 2007, 6, 992 CrossRef CAS PubMed.
  22. L. Oss-Ronen, J. Schmidt, V. Abetz, A. Radulescu, Y. Cohen and Y. Talmon, Macromolecules, 2012, 45, 9631 CrossRef CAS.
  23. D. Wu, F. Xu, B. Sun, R. Fu, H. He and K. Matyjaszewski, Chem. Rev., 2012, 112, 3959 CrossRef CAS PubMed.
  24. D. L. Gin and R. D. Noble, Science, 2011, 332, 674 CrossRef CAS PubMed.
  25. L. Li, L. Schulte, L. D. Clausen, K. M. Hansen, G. E. Jonsson and S. Ndoni, ACS Nano, 2011, 5, 7754 CrossRef CAS PubMed.
  26. H. Uehara, T. Yoshida, M. Kakiage, T. Yamanobe and T. Komoto, J. Polym. Sci., Polym. Phys. Ed., 2006, 44, 1731 CrossRef CAS PubMed.
  27. H. Uehara, T. Yoshida, M. Kakiage, T. Yamanobe, T. Komoto, K. Nomura, K. Nakajima and M. Matsuda, Macromolecules, 2006, 39, 3971 CrossRef CAS.
  28. K. M. Bratlie, R. L. York, M. A. Invernale, R. Langer and D. G. Anderson, Adv. Healthcare Mater., 2012, 1, 267 CrossRef CAS PubMed.
  29. H. Uehara, M. Kakiage, M. Sekiya, D. Sakuma, T. Yamanobe, N. Takano, A. Barraud, E. Meurville and P. Ryser, ACS Nano, 2009, 3, 924 CrossRef CAS PubMed.
  30. N. Zhou, F. S. Bates and T. P. Lodge, Nano Lett., 2006, 6, 2354 CrossRef CAS PubMed.
  31. M. Kakiage, M. Sekiya, T. Yamanobe and H. Uehara, Polymer, 2011, 52, 6146 CrossRef CAS PubMed.
  32. B. Wunderlich, Crystal structure, morphology, and defects, in Macromolecular physics, Academic Press, New York, 1973, vol. 1 Search PubMed.
  33. I. Vukovic, T. P. Voortman, D. H. Merino, G. Portale, P. Hiekkataipale, J. Ruokolainen, G. ten Brinke and K. Loos, Macromolecules, 2012, 45, 3503 CrossRef CAS.
  34. J. Suwa, M. Kakiage, T. Yamanobe, T. Komoto and H. Uehara, Langmuir, 2007, 23, 5882 CrossRef CAS PubMed.
  35. T. Aoike, T. Yamamoto, H. Uehara, T. Yamanobe and T. Komoto, Langmuir, 2001, 17, 5688 CrossRef CAS.
  36. B. H. Jones, K.-Y. Cheng, R. J. Holmes and T. P. Lodge, ACS Appl. Mater. Interfaces, 2011, 3, 4101 Search PubMed; B. H. Jones and T. P. Lodge, ACS Nano, 2011, 5, 8914 CrossRef CAS PubMed.
  37. D. T. Wong, C. Wang, K. M. Beers, J. B. Kortright and N. P. Balsara, Macromolecules, 2012, 45, 9188 CrossRef CAS.
  38. D. T. Wong, C. Wang, J. A. Pople and N. P. Balsara, Macromolecules, 2013, 46, 4411 CrossRef CAS.
  39. T. Hashimoto, T. Kawamura, M. Harada and H. Tanaka, Macromolecules, 1994, 27, 3063 CrossRef CAS.
  40. L. Li, P. Szewczykowski, L. D. Clausen, K. M. Hansen, G. E. Jonsson and S. Ndoni, J. Membr. Sci., 2011, 384, 126 CrossRef CAS PubMed.
  41. J.-H. Seo, T. Shibayama, M. Takai and K. Ishihara, Soft Matter, 2011, 7, 2968 RSC; M. Kyomoto, T. Moro, K. Saiga, M. Hashimoto, H. Ito, H. Kawaguchi, Y. Takatori and K. Ishihara, Biomaterials, 2012, 33, 4451 CrossRef CAS PubMed.
  42. T. Kato and M. A. Hillmyer, ACS Appl. Mater. Interfaces, 2013, 5, 291 CAS.

Footnote

Electronic supplementary information (ESI) available: Typical appearances of the base copolymer films, experimental setup for the molecular permeation tests, standard calibration lines obtained from the refractive index and UV absorbance. See DOI: 10.1039/c4ra01676a

This journal is © The Royal Society of Chemistry 2014
Click here to see how this site uses Cookies. View our privacy policy here.