Bioconversion of coal: new insights from a core flooding study

Anil Stephena, Abigail Adebusuyib, Aleksey Baldygina, Jeremiah Shusterc, Gordon Southamc, Karen Budwilld, Julia Foghtb, David S. Nobese and Sushanta K. Mitra*a
aMicro and Nanoscale Transport Laboratory, Department of Mechanical Engineering, University of Alberta, Edmonton, Alberta T6G 2G8, Canada. E-mail: sushanta.mitra@ualberta.ca; Fax: +1 780 492 2200; Tel: +1 780 492 5017
bDepartment of Biological Science, University of Alberta, Edmonton, Alberta T6G-2E9, Canada
cDepartment of Earth Sciences, Western University, London, Ontario N6A-3K7, Canada
dEnergy and Carbon Management, Alberta Innovates Technology Futures, Edmonton, Alberta T6N-1E4, Canada
eOptical Diagnostic Group, Department of Mechanical Engineering, University of Alberta, Edmonton, Alberta T6G-2G8, Canada

Received 24th February 2014 , Accepted 6th May 2014

First published on 7th May 2014


Abstract

A pressurized core flooding experiment was performed to better understand in situ coal bioconversion processes. The core flooding experiment was conducted using a biaxial core holder packed with subbituminous coal particles (250–150 μm grain size) obtained from the Highvale mine in Alberta, Canada. The coal pack was inoculated with a methanogenic microbial culture enriched from coal and was continuously flooded with mineral salt medium and an organic carbon/nitrogen nutrient supplement (tryptone). The changes in the physical properties of the coal pack during the core flooding suggested coal bioconversion to methane under the experimental conditions. Colonization and bioconversion of coal by microbes was evident from the change in core permeability and presence of metabolites and gas (CH4 and CO2) in the effluent. A total of 1.52 μmol of CH4 was produced per gram of coal during the 90 days experiment at 22 °C. Signature metabolites consistent with anaerobic biodegradation of hydrocarbons, e.g., carboxylic acids, were identified in effluent samples throughout incubation. The transient nature of metabolites in effluent samples supports fermentation of coal constituents and nutrient supplement to simple molecules such as acetic acid, which served as a substrate for methanogenesis during the bioconversion process. Accumulation of carboxylic acids such as succinic acid in the effluent also demonstrates that the coal bioconversion process may be used for extraction of other value-added products apart from CH4 generation. Importantly, results presented here suggest that coal bioconversion by biostimulation under reservoir conditions is a scalable technology with potential for energy generation and for overall reduction of greenhouse gas emissions.

1 Introduction

Coal is an abundant and widely distributed energy resource with reserves in more than 70 countries.1 Due to rising energy demand worldwide, it still continues to be used widely as a major energy source for electricity generation and other industrial purposes.2 In addition, coal has high energy content and low cost per unit of energy produced. Coal provides 26.6% of energy produced worldwide, however, it results in a large quantity of green house gas (GHG) emissions, constituting approximately 43.1% of global CO2 emissions.1 Coal-fired power plants are major contributors to these GHG emissions.3 To meet higher energy demand (particularly in China and India), to enable the use of coal in the future and to reduce environmental impacts, low-carbon footprint technologies will play an increasingly important role across the globe. One may ask whether biochemical pathways can convert coal directly to other hydrocarbons with low overall carbon footprint, particularly for scalable field operations. One of the promising low-carbon technologies is the in situ bioconversion of coal to methane as a source of coal bed methane (CBM)3 rather than the direct combustion of coal that results in significant generation of CO2 per unit energy.4,5 Hence, the focus of this work is to demonstrate the feasibility of such bioconversion processes in a laboratory-scale model, previously unexplored in the open literature.

Methane generation in a coal seam can either take place through thermal6–9 or biological formation.10 Thermal production of methane includes the in situ thermocatalytic breakdown of the organic matter at elevated temperature and pressure.6–9 Thermogenic methane generation is predominant only if the coal reaches a certain threshold of thermal maturity.11 For significant thermogenic methane generation, high vitrinite reflectance (>0.8%) of the coal is required and hence this is generally associated with higher-rank coals such as bituminous and anthracite.11 Biogenic methane is a consequence of microbial activity on coal12 that begins during the peatification process (i.e., early stages of coal formation) and continues throughout the coalification process until increased pressure and heat destroys the microbes. Infiltration of meteoric water after uplift and cooling of the coal formation can transport microbes and nutrients into coal aquifers, resulting in the stimulation of secondary biogenic methane generation.13,14 Secondary biogenic methane generation appears to be predominant in lower-rank coals, which usually occur at shallower coal seams.15 However, new drilling and fracturing technologies (i.e., horizontal, multi-lateral drilling) have allowed access to the deeper coal seams (>1000 m deep) for recovery of methane.

Biogenic methane generation is controlled by several factors such as the presence of microbes supporting methanogenesis, bioavailability of coal macromolecules and environmental conditions that influence methanogenesis.12 Laboratory enrichment culture studies using coal samples and coal-bed formation fluid have demonstrated the presence of microbial activity associated with coal methanogenesis.7,13,16–18 Metabolite profiling and analysis of coal bed water have identified metabolism of monoaromatic, n-alkane, cyclic alkane, aliphatic, fatty acid and naphthalene components of coal.17,19

Most studies of coal bioconversion to date have been limited to closed system laboratory culture bottle experiments,7,12,16,17,20–23 which have been performed under low headspace pressures ranging between 106–138 kPa(a)7,17,20 and employing high ratios of medium to coal substrate, which results in greater coal surface contact with these components.7,12,17,20,21,23 Unfortunately, the same degree of coal surface contact with the nutrients and inoculated media is not feasible in reservoir conditions. Also, more importantly such controlled experiments fail to capture the dynamic response of the system, which is a critical operational parameter for field applications. Hence, results from these bottle studies cannot be readily extrapolated for modeling and predicting gas production under field conditions.

To overcome the limitations of bottle experiments, one can treat coal as a porous medium whose pore space varies from a few nanometers up to mm in size24 that can allow migration of gases, fluids and microbial cells. This will allow researchers to perform laboratory core flooding experiments, which are commonly conducted by petroleum reservoir engineers for studies related to the crude oil and gas recovery.25–29 In such cases, the reservoir is mimicked by packing sand particles27–29 or by using an actual core sample from the reservoir.25,26,30 Such a technique provides an effective means to understand and quantify the oil/gas recovery process due to a flooding fluid.

To the best of our knowledge, only one dynamic study31 has been reported so far in the open literature, which describes the use of high-pressure reactors containing packed bituminous coal and sand to examine a different problem, i.e., the potential for CO2 sequestration in coal beds. They detected consumption of CO2 and production of acetate, presumably by indigenous microbial activity, under simulated in situ conditions of temperature (40 °C) and pressure (41 MPa). Therefore, it is an open question in the literature whether dynamic processes occur during the bioconversion of coal to methane. Can one identify specific biochemical pathways that may be taking place in coal seams? We attempted to answer these questions by designing, building and commissioning a core flooding system to investigate the bioconversion of coal into gaseous products and water-soluble metabolites. The core flooding column was packed with crushed subbituminous coal and inoculated with a methanogenic, coal-degrading enrichment culture. The core holder was continuously flooded with mineral salts medium plus tryptone (MSM-tryptone) to provide adequate nutrients required for the growth of the microbes. Methods to collect effluent samples for gas and metabolite analyses and microscopy of coal surfaces were developed and tested and the analyses were used as indicators to establish that the microbes survived the core flooding operation. This core flooding system provides the basis for further investigations of scale-up and simulation of microbial coal bioconversion processes.

2 Materials and methods

2.1 Description of core flooding system

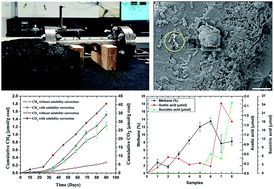
A schematic of the core flooding experimental setup is shown in Fig. 1. The setup and the selection of experimental physical parameters were designed to simulate in situ, anaerobic reservoir conditions of elevated pressure, but ambient temperature (≈22 °C) was used for incubation. Crushed coal-packed core flooding experiments have been conducted at Alberta Innovates Technology Future (AITF).32 Most of the design and operating procedures for the core flooding system described here have been adopted and modified from the AITF system. Water and N2 gas were injected for calculating packed coal porosity and absolute permeability, after which an inoculum suspension and mineral salts medium (MSM) containing tryptone were injected. The experimental setup can be divided into three sections: upstream, core block, and downstream. The upstream section is responsible for driving fluid into the core block. The core block consists of core holder packed with crushed coal and the downstream section is responsible for effluent collection and maintaining back pressure in the system. The detailed description of the components in the upstream, the core block and the downstream sections of the core flooding system are provided in the ESI. Since the process of microbial methane generation can typically take months to complete,7,12,20,23 custom software was developed to monitor the experiment along with the use of a data acquisition unit (DAQ) and serial communication. Core flooding data (e.g., pressure changes) were processed in real time for online display and monitoring by using an in-house built graphical user interface (GUI), which also allowed overall control of the experiment.
image file: c4ra01628a-f1.tif
Fig. 1 Schematic of the core flooding system used for the bioconversion of coal into methane, with three key sections – upstream, core block, and downstream.
2.1.1 Evacuation of core flooding system. Special care was taken to maintain the system under anaerobic conditions to support methanogenesis. An industrial vacuum pump (Model 117, Labconco Corp.) was used to evacuate the entire system to achieve 6.5 kPa(a) (28 in. Hg). The upstream and downstream sides of the system were evacuated by connecting the vacuum pump to the vacuum port, U-VPORT-1, and to valves D-2V-7 and D-3V-2. The vacuum gauge, U-VPG-1, was used to measure the vacuum level. The core holder and the upstream side of the PAs were evacuated for an hour. Each of the flow lines and downstream side of the PAs were evacuated for 15 min. A leak test was performed while evacuating the entire system by monitoring vacuum pressure and using soap solution as a leak detector.

2.2 Coal preparation and packing

Coal samples of subbituminous rank were collected from a mine face at TransAlta's Highvale mine located south of Lake Wabamun, Alberta, Canada. Coal blocks and chips were crushed into smaller pieces using a mortar and pestle. The required mesh size was obtained by grinding these smaller pieces in a bench-top planetary ball mill (PM 100, Retsch GmbH) and by sieving using a Ro-Tap sieve shaker (RX-29, W.S. Tyler Industrial Group). Standard test sieves (Fisher Scientific Co.) with ASTM E-11 specifications were used for grain separation based on different mesh sizes. Two groups of the crushed coal with mesh sizes 60–70 (250–210 μm) and 70–100 (210–150 μm) were used to pack the core holder. The coal pack was then treated as a heterogeneous porous medium. The average size of the packed coal particles inside the core holder, based on the total weight of the crushed coal sample, was 200 μm. In order to obtain a compact packing of the coal, a vibration table (VP-181, FMC Technologies, Inc.) with a vibrator controller (Syntron Power Pulse AC, FMC Technologies, Inc.) was used. The core holder was held vertically and kept under continuous vibrations while the crushed coal particles were being slowly poured into the core holder. The 60–70 mesh size coal particles (125.9 g) were used first to fill 12.5 cm of the void space inside the core holder and thereafter 70–100 mesh size (174.5 g) were used to fill the rest of the core holder. Often studies on the effects of reservoir heterogeneities (reservoir with layers of different permeability) employ such dual size sand grains.33 Also, in an actual reservoir, methane flows from low permeability zones (due to higher overburden pressure as depth increases) to higher permeability zones. Therefore, an attempt has been made to simulate different permeability zones by establishing a lower permeability coal pack at the inlet side and a higher permeability coal pack at the outlet side of the core holder. The packing density (ratio of the mass of the coal packed to the volume of the core holder) was calculated to be 864.64 kg m−3 (53.97 lb ft−3).

2.3 MSM-tryptone and microbial culture preparation

A mineral salts medium, MSM, (WR-86)34 with the nutrient tryptone at 5 g l−1 (MSM-tryptone), was continuously supplied to the coal pack as a growth medium for methanogenesis during the core flooding experiment. Nutrients with high nitrogen content (tryptone contains 13% nitrogen) and amino acids are shown to be effective in stimulating methane generation as compared to other nutrients such as cheese whey, potato starch, yeast extract and soytone.35 It is to be noted that the coal sample was not sterilized at any point and thus was expected to harbour indigenous microbes. However, the coal was exposed to air during processing and packing, which may have rendered strict anaerobes (particularly methanogens) unviable. Hence, an appropriate coal-derived microbial inoculum was required to determine whether microbes would survive and be active during the core flood. In the current work, Quicksilver Resources Ardley Formation (QSAF), a methanogenic culture enriched from coal cuttings sampled from a coal seam in Alberta, as described in the published work by co-author,36 was used, which was the natural consortium isolated from the coal cuttings without any additional strains to the culture. The taxonomic data for the microbial culture are provided in the ESI, Section 11 and Fig. S6. To prepare a sufficient culture volume, QSAF was sub-cultured into replicate serum bottles containing MSM and tryptone16 (Bacto™ Tryptone (Becton, Dickinson and Co.)) at 5 g l−1 MSM, ground coal (Highvale Mine, Alberta), and resazurin as a redox indicator, incubated in the dark at 30 °C for 5 weeks. Methane production in the inoculum bottles was monitored during incubation period and constituted 30–40% of the headspace volume of the culture bottles at the time of inoculation. To prepare the inoculum for introduction into the core system, equal volumes of MSM-tryptone and the inoculum (total 165 ml) were transferred to a clean, sterile U-PA-2.

2.4 Core flooding operation and sampling

The crushed coal was packed inside the core holder and compact packing of the coal was ensured by comparing packing density with published data.37 The entire experimental setup including the core holder was evacuated and leak tested. Permeability of the coal pack was estimated using nitrogen as working fluid. Permeability and porosity were also calculated based on the amount of water injected into the core holder (details given in the ESI).

Three pore volumes of the MSM-trypton solution were injected into the coal pack to fully saturate it followed by inoculation with 1.25 pore volumes of microbial culture. The entire system was then incubated for two weeks at room temperature (22 °C). This long incubation period allows the microbial culture to become established in the core conditions. During that time, the core holder was isolated from the rest of the experimental set-up by closing valves C-2V-3 and C-2V-6. After the incubation period, the coal pack was continuously flooded with the MSM-tryptone solution at 0.006 ml min−1 (0.000305 SCF per day) to feed the microbes.

The effluent was collected in the downstream side of the PAs. Each effluent sample was limited to the volume of the downstream pump, approximately 100 ml, and represented three-fourths of a pore volume (PV). Eight effluent samples were collected before the core flooding experiment was stopped on the 90th day of a continuous flooding cycle. Each sample was then analysed for gas production and composition (after separation from the liquid phase) as well as for the presence of metabolites. A total of 760 ml or 5.75 PV of MSM-tryptone flowed through the core system. Methane production continued until the last day of the experiment. The continuous methane generation in this dynamic system, where nutrients are continuously supplied and waste materials are (intuitively) continuously removed, suggests that the experiment, in principle, could have been carried out for a longer period of time. However, the experimental trends, reported here, may not deviate much beyond a certain time period. Hence, the time span of 90 days was considered a judicious and manageable experimental cycle.

2.5 Analytical methods

2.5.1 Gas analysis. The dissolved gases, generated as a result of in situ coal bioconversion processes, were desorbed from the effluent using the pressure reduction method shown in Fig. S2 (see detailed description in ESI). Gas was collected in a Tedlar bag (Model 22049, Restek Corp.) and its volume was measured using a syringe. The gas was transferred from the Tedlar bag into an evacuated sealed vial having a PTFE septum screw cap. Subsamples (0.1 ml) were transferred from this vial to the gas chromatograph (GC) using a 0.5 ml disposable syringe. Alternatively, 0.1 ml of gas was injected directly from the Tedlar bag into the GC. For each method, three replicate subsamples were injected into the GC to obtain the mean peak area and to ensure precise gas measurements. Gas volume percentages were comparable for both methods, with 0.5–0.6% and 1.8% deviation for CH4 and CO2, respectively.

Gases were analysed for the presence of CH4 and CO2 using two different GC models. CH4 was measured using a 5700A model (Hewlett-Packard Co.) equipped with a flame ionization detector. CO2 was measured using a 5890 series II model (Hewlett-Packard Co.) equipped with a thermal conductivity detector. The measurement standards for both CH4 and CO2 were adopted from the procedure described by Budwill et al.38

For methane analysis, N2 was the carrier gas maintained at a flow rate of 46.1 ml min−1 and H2 and air flow rates were set at 30.7 ml min−1 and 260 ml min−1, respectively. The detector temperature was 200 °C and the injector was at room temperature. The volume percentage of methane in 0.1 ml samples was calculated from the peak area, which was obtained using an integrator connected to the GC (3390A, Hewlett-Packard Co.). For CO2 analysis, helium was the carrier gas. The peak area was obtained using another integrator connected to the GC (3396 series III, Agilent Technologies).

2.5.2 Metabolite profiling. At specified intervals as outlined in Table 1 during core flooding, 5 ml sub-samples were collected from the effluents and acidified to pH < 2 using concentrated HCl to stop microbial activity and protonate the acidic intermediates. Three 5 ml sample replicates of the core flooding fluids as well as an MSM-tryptone control were also processed. An extraction standard, 4-fluoro-1-naphthoic acid, was added before the extraction of acidic metabolites using 5 ml ethyl acetate in each replicate. Extracts were derivatized by reaction with N,O-bis(trimethylsilyl) trifluoroacetamide (Sigma-Aldrich Corp. LLC) at 70 °C. Gas chromatography-mass spectrometry (GC-MS) analysis was performed using a GC (6890N, Agilent Technologies) with an inert mass selective detector (5973, Agilent) fitted with a capillary column (HP-5MS, Agilent) of 30 m length, 0.25 mm ID and 0.25 μm film thickness. Helium was used as the carrier gas. Metabolites were identified based on the comparison of the respective retention times and characteristic ion fragmentation of the authentic standards. The concentration of metabolites in each sample was normalized to the concentration of the surrogate extraction standard, 4-fluoro-1-naphthoic acid, for statistical analysis.
Table 1 List of parameters corresponding to eight effluent samples analyzed during the core flooding experiment
Sample no. Time (days) Back pressure (kPa(g)) Average differential pressure (kPa) Flow rate (ml min−1) Cum. feed injected (PV)
1 10 3447 2.027 0.006 0.640
2 24 3447 2.000 0.005 1.370
3 34 3447 3.757 0.007 2.107
4 45 1724 3.716 0.006 2.804
5 58 1724 3.723 0.006 3.507
6 69 3447 4.192 0.006 4.257
7 80 3447 4.660 0.006 5.000
8 90 69 5.136 0.006 5.757


Statistical relationships of metabolites in effluents at different times versus uninoculated MSM-tryptone medium as a control were determined using a comprehensive web server39 with statistical packages, MetaboAnalyst 2.0. Hierarchical clustering was performed using hclust and presented as a dendrogram visualized through a conventional heat map. Euclidean distances and Ward's linkages40 were used in the hierarchical clustering analysis to measure similarity among samples.

2.5.3 Microbe-coal characterisation. Coal samples were collected aseptically from the inlet, central and outlet locations of the core holder at the termination of the experiment (90 days) to perform electron microscopy. Unincubated crushed coal blocks and chips were used as a control/reference (T = 0) materials for such study. Samples for electron microscopy were fixed immediately using 2%(aq) glutaraldehyde. Aliquots of each fixed sample (ca. 500 μl) were collected on separate, sterile 0.45 μm pore-size membrane filters, dehydrated in a sequential 25, 50, 75 and 3 × 100%(aq) ethanol series, critically-point dried (Samdri-PVT-3B, Tousimis Research Corp.) and placed on aluminium stubs using 12 mm carbon conductive adhesive tabs (Model 77825-12, Electron Microscopy Sciences). A 20 nm osmium coating was deposited on the surface of each sample using a sputter coater (Desk II, Denton Vacuum, LLC) to reduce charging effects while imaging. Grain structure and bacterial characterization of each sample was examined using a Field Emission Gun-Scanning Electron Microscope (FEG-SEM) (1540XB, Carl Zeiss Microscopy Ltd.) operating at an accelerating voltage of either 1 or 3 kV (Western Nanofabrication Facility, Western University).

3 Results and discussion

3.1 Porosity and permeability of the coal pack

The porosity calculated from the water saturation experiment and density balancing method were 38% and 39.2%, respectively (Table S1). The absolute permeability of the coal pack, estimated from three different methods – the Klinkenberg effect, the water injection and the Kozeny–Carman equation, were 13.8, 13.28, 13.4 mD, respectively (see ESI for details). These values yield an average permeability of the coal pack of 13.5 mD. Note that coal fines of smaller size (10–0.2 μm) can block the pores, resulting in decreased pore space (porosity) and permeability. The permeability obtained from the present work was compared with that of Lin et al.41 where a coal pack with mesh size 60 was used and the mean particle size was 250 μm. Their estimated permeability value was 18.3 mD, which corresponds to a particle size of 250 μm using Kozeny–Carman equation.

3.2 Generation of CH4 and CO2

Experimental parameters, such as operating (back) pressure and flow rate for MSM-tryptone supply, chosen for each sample are provided in Table 1. The operating pressure was set at the downstream side of the system at 3447 kPa(g) (500 psig). The pressure was reduced to 1724 kPa(g) (250 psig) for the 4th and 5th samples to investigate the effect of pressure on methanogenesis. For the final sample, the pressure was further reduced to 69 kPa(g) (10 psig) to desorb as much gas as possible from the coal, which was produced during the experiment and adsorbed in the coal matrix. The time-averaged differential pressure across the core was recorded (Table 1) and found to increase gradually throughout the experiment. The flow rate chosen for the experiment was 0.006 ml min−1. Flow rates of 0.005 ml min−1 and 0.007 ml min−1 were chosen for the 2nd and 3rd samples, respectively, to adjust the sample collection time. The cumulative volume of the MSM-tryptone injected into the core during the experiment was 5.75 PV (760 ml). The pH of the effluent sample was measured using a pH meter (AB15, Accumet Engineering Corp.) integrated with an electrode (13-620-104A, Accumet Engineering Corp.). The measured pH values of the effluent samples are listed in Table 2.
Table 2 Cumulative CH4 and CO2 generation and molar ratios (without solubility correction)
Sample no. Time (days) Effluent pH Gas volume collected (ml) Cum. CH4 (μmol) Cum. CO2 (μmol) Molar ratio CO2/CH4
1 10 n/a 4.0 4.6 30.2 6.579
2 24 6.05 5.5 8.4 60.4 7.874
3 34 6.08 10.0 29.0 285.8 10.989
4 45 6.04 16.0 85.1 591.6 5.464
5 58 6.01 17.0 169.5 918.3 3.876
6 69 6.02 15.0 252.6 1235.0 3.802
7 80 5.86 13.3 294.9 1473.3 5.650
8 90 5.93 22.4 371.2 1846.5 4.902


The gas phases generated during the core flooding experiment comprised CH4 and CO2. Other gases such as H2 may have also been generated, but these were not measurable with the available GC. The total volume of gases collected with each effluent sample, cumulative volume of CH4 and CO2 and molar ratios of CH4 and CO2 at each sampling time are listed in Table 2. The error associated with volume measurement of gases transferred from the Tedlar bag to GC was calculated based on the least count of syringe, 1 ml, used for gas transfer. The calibration error was the measurement error associated with preparation of calibration standard and it was calculated based on the least count of syringe, 1 ml, used to prepare the measurement standard. The measurement variation was calculated based on the standard deviation of peak areas obtained when the volume of gas was injected three times into the GC. During the gas analysis, there is a possibility that the air inside the syringe needle could have been mixed with the gas inside the vial. Such mixing would result in negligible error in gas measurements reported here. Also, while transferring the produced gas from the vial to the GC, the possibility of partial gas displacement with air cannot be ruled out.

Here, first we analyse data without considering the solubility of CH4 and CO2 in the effluent sample. During the initial stages of the experiment, the rate of methanogenesis was slow and it can be defined as the lag phase of the methane production. Hence, the quantities of gases generated in the 1st and the 2nd samples were less than the subsequent samples. While comparing the 2nd and 3rd samples, almost three-fold and six-fold increases in the volume production of CH4 and CO2, respectively were observed (Table 2 and S2). Also, from the 3rd sample onwards, the total gas volume and percentage of CH4 showed an increasing trend. Increased CO2 generation in the 3rd sample compared to the 2nd sample indicated the initiation of enhanced metabolic rates.

Overall, more than a five-fold greater percentage of CO2 than CH4 was observed without considering the solubility correction. This higher rate of CO2 production compared to CH4 was likely due to the accumulation of CO2 from bacterial fermentation processes. Coal, a complex mix of large molecular weight aliphatic, aromatic and heterocyclic hydrocarbons, is postulated to be transformed by primary and secondary fermenters to small molecular weight intermediates such as fatty acids, organic acids, alcohols, H2 and CO2.19,42,43 H2-producing acetogenic microbes can convert organic acids such as volatile fatty acids (e.g., butyrate, propionate) into acetate, formate, H2 and CO2.19,43,44 Acetoclastic methanogens produce equimolar concentrations of CH4 and CO2 from acetic acid.45 Note that CO2 can also be produced from the fermentation of tryptone, a possible source of the large amount of CO2 in comparison to CH4. However, CO2 can also be converted to acetate by acetogens or utilized by hydrogenotrophic methanogens to produce CH4.46 The high concentration of CO2 in the effluent gases suggests that such processes are not likely the dominant pathway of CO2 utilization in the present coal core, or that the experiment was not run long enough for hydrogenotrophic methanogens to convert CO2 at high enough rates.

Fig. 2 shows the cumulative production of CH4 and CO2 in μmol per gram of subbituminous coal. The values were corrected to ambient room temperature and atmospheric pressure. The fraction of a gas volume that can still be dissolved in the liquid effluent sample depends on the partial pressure and temperature. Therefore, the total quantity of analysed CH4 and CO2 was corrected further by considering their solubility, calculated using Henry's law,47,48 details of which are provided in the ESI. The error bar for each data point was calculated considering the measurement and calibration errors and the variability in the measurement (details available in the ESI). Since CO2 is more soluble compared to CH4, about 25 times greater percentage of CO2 than CH4 was observed with the consideration of solubility of these components. Without considering these solubility corrections as observed from Fig. 2, there is only 5 fold increase in CO2 production in comparison to CH4.


image file: c4ra01628a-f2.tif
Fig. 2 Effect of solubility on cumulative CH4 and CO2 generation. Each data point corresponds to a sample in Table 1.

The data shown in Table 2 and Fig. 2 suggest that the ratio of CO2 to CH4 increases up to the 3rd sample, followed by a decreasing trend for the subsequent samples (except for last two samples). This indicates that microbial reactions favoured the production of CO2 rather than CH4 at the beginning of methanogenesis. This lag period before methane production occurs also has been observed in static methanogenic culture bottle experiments. With the progression of methanogenesis, more methane started to be produced from the precursors, such as acetate (and possibly CO2). Acetoclastic methanogenesis (acetate to CH4) may have been dominant at the beginning of the core flood and as time progressed hydrogenotrophic methanogenesis (CO2 to CH4) may have become responsible for some of the methane generation. Methanobacterium, a methanogen that uses the hydrogenotrophic pathway for methanogenesis, was indeed detected in the inlet section of the core. Methanosarcina, a methanogen that used the acetoclastic pathway for methanogenesis was also detected but at a lesser relative abundance (Fig. S6 in the ESI). Cumulative CH4 and CO2 generation varied linearly with the core flooding time beyond the 2nd sample (Fig. 2). The CH4 and CO2 were continuously produced until the experiment ceased. The data suggest that CH4 production had not reached its peak, and fermentative bacteria and methanogens were actively involved in the bioconversion of coal and tryptone throughout the experiment. When the final, 8th sample, was collected on the 90th day, the solubility-corrected cumulative CH4 and CO2 production values were 1.52 and 40.57 μmol g−1 coal, respectively, compared to the uncorrected values of 1.24 and 6.14 μmol g−1 coal, respectively. With the consideration of solubility, a 20% increase in CH4 production was observed for each sample.

The degassing of the coal core at the end of experiment presumably should have recovered some of the CH4, which had adsorbed in the coal matrix during the core flooding experiment. By degassing, it was found that solubility-corrected and -uncorrected cumulative CH4 became 1.81 and 1.51 μmol g−1 coal, respectively. The molar ratio of CO2 to CH4 was 4.16, which was comparable with values obtained from the core flooding experiment (see Table 2).

The reason for increased amount of CO2 production during the experiment, as compared to the CH4, can be also attributed to the viability of methanogens as compared to fermentative microbes (Clostridiales). The taxonomy analysis of different sections of the core holder (Fig. S6 in the ESI) suggest that in general there is greater abundance of fermentative microbes as opposed to methanogens. This restricts the possible biological pathway of converting CO2 to CH4 and hence we observe more amount of CO2 throughout the experiment.

It was found that there was a negligible decrease in pH from an average of 6.04 for 2nd–6th samples to an average of 5.90 for 7th–8th samples, which may be due to the accumulation of carboxylic acids. The pH measurement was performed within an hour after effluent was transferred from PA to Tedlar bag and gasses separated from the effluent. Due to the high CO2 concentration, the pH may have changed from the time of collection to the time of measurement. Thus, the measured values may not accurately reflect the in situ values. Improvements in pH measurement technique need to be developed.

Closed, static and low pressure culture bottle experiments reported in the literature demonstrated that the total methane production from the coal sample depends on the ratio of volume of inoculated medium to the mass of coal.7,12,17,20–23 Increases in this ratio result in substantial increase in the contact surface area between coal, medium, nutrients and microbes, which in turn results in more methane generation. Such bottle experiments can be distinguished from the current core flooding experiments in many aspects. The sample preparation, experimental methods and quantity of medium and nutrient and/or compounds such as H2/CO2 and acetate, added during the bottle experiment were different from that carried out for the core flooding experiment. The commonly adopted method and the range of compounds used in several bottle experiments, available in the literature, are summarized here. In ‘typical’ bottle experiments, the sample was prepared in such a way that the quantity of coal (0.5–10 g) was added to a serum bottle and the medium and inoculum were added at a specified ratio of volume of medium in ml to mass of coal in grams (1.5–12.5).7,12,17,20,23 The head space volume was flushed with N2/CO2 or H2/CO2 with this ratio generally equalling 4[thin space (1/6-em)]:[thin space (1/6-em)]1 and pressurized to a value between 106–138 kPa(a).7,12,17,20,23

Subsurface environments are often deficient in nutrients required for microbial growth. Therefore, microbial metabolism of organic compounds, and hence, the rates of in situ methanogenesis, can potentially be improved by the addition of nutrients.7,12,16,21 The addition of yeast extract, milk, vitamins,49 carboxylate compounds, phosphate, ammonia,50 tryptone, and Brain Heart Infusion16 to coal cultures have been reported. A substantial increase in methane production was reported with the addition of tryptone to coal in a mineral salts medium than nutrient-only (4-fold increase) or coal-only (55-fold increase) cultures.16 Additions of organic nutrients, such as tryptone supplements, assist in more rapid biodegradation of the metabolic intermediates.16 A 30-fold increase in methane generation was observed with the addition of tryptone at 5 g l−1 compared to coal-only culture.36 Almost 4-fold more methane generation was observed after 55 days of incubation in cultures containing both the coal and tryptone than cultures amended with only tryptone.36 Hence, tryptone is an appropriate nutrient amendment for this laboratory trial, but being expensive, its use (continuous or discontinuous injection) for field trials needs to be further evaluated. It is very well conceivable from microcosm studies36 that the CH4 and CO2 production observed in the core flood originated partially or even entirely from the fermentation of the tryptone. Control experiments using inert packing material and continuous feeding with MSM-tryptone should be done to account for CH4 from tryptone only.

In contrast to the bottle experiments (microcosm studies), the quantity of the coal sample used in this core flooding experiment was 300.4 g. At any time, the coal pack was in contact with a single pore volume of microbial suspension, i.e., MSM-tryptone. In bottle experiments, the contact surface area of coal sample with nutrient-rich inoculated medium was higher compared to the core flooding experiment. In contrast, coal packing was denser in the core flooding experiment and the operating pressure was higher than those in the bottle experiments. The gas generated in the bottle experiment could easily move to the headspace; while for the core flooding experiment, gas can be adsorbed by the coal matrix. The recovery of CH4 after pressure reduction during the sampling process confirmed this hypothesis. Hence, the recovery of the analysable gas from the core flooding experiment was less due to the gas adsorption compared to that from the bottle experiment. In the core flooding experiment, achieving an even distribution of microbes inside the coal pack could be a challenge, which could limit the coal bioavailability. In bottle experiments, the quantity of added carbon sources such as acetate, formate, bicarbonate and CO2 could contribute to the overall methane yield,7,13,20 which may cause an overestimation of the microbial degradation capability of coal. For these reasons, results from the core flooding experiment and those from the bottle studies available in literature could not be directly compared. The core flooding experiment can be characterized as a system having a more natural ‘quantity’ of coal, with less direct surface contact of coal with microbes, and less contact with enriched nutrient solution, i.e., lower bioavailability. The maximum production of CH4 in the present study was 13.51 vol% observed on 69th day (Table S2 in ESI), as compared to 10.1% on 49th day reported by Toledo et al.22 and around 8.7% on 155th day reported by Luca Technologies Inc.51

3.3 Changes in coal permeability

Permeability changes were observed for the coal pack after inoculation and during continuous flooding operations with MSM-tryptone. Fig. 3 shows the variation in absolute permeability of the coal pack corresponding to the time averaged pressure drop measured at each sampling cycle of the core flooding experiment. The permeability of the core calculated at the 1st sampling was 13.27 mD, which was comparable to the permeability estimated from the water injection, the Klinkenberg effect and the Kozeny–Carman equation. This suggests that no significant changes in permeability occurred during the initial inoculation of the coal pack. However, permeability decreased as the experiment progressed. The most significant decrease in permeability was observed during the 3rd sampling period. This significant change in permeability may have been due to a combination of microbial growth52,53 and gas adsorption,26,41,54 which might have facilitated the collapse of void space inside the core holder. Microbial growth on the surface of coal particles results in the formation of areas of biofilm and the adherence of an increased number of microbial cells on the coal surface (Fig. 5a).52,53,55 Hence, the decrease in coal permeability over time may be due in part to the blocking of a coal pores by microbial biofilms on the coal surface52 or accumulation of discrete microcolonies in the pore spaces.53
image file: c4ra01628a-f3.tif
Fig. 3 Permeability variation of the coal pack as a function of flooding time.

It should be noted that the volume of total gas measured in the 3rd sample was double compare to that of the 2nd sample (Fig. 2). When the coal pack is saturated with produced gases, the adsorption of these gases (depending on their partial pressure) results in the swelling of coal.26,41,54 This swelling effect of the coal core may lead to the decrease in permeability over time. The swelling effect due to CO2 sorption is more pronounced than CH4 or N2 adsorption.26,41,54 The microbial growth and the gas generation in subsequent samples resulted in further decreases in the permeability, as shown in Fig. 3. The rate of decrease in permeability from the 5th sample onwards was less in comparison to the previous samples, since there was no significant increase in the volume of gas generated and the coal matrix may be saturated with gases generated from the 4th sample onward. Permeability was reduced to almost half of its initial value at the end of the 4th sampling and further reduced to 5.75 mD at the end of the 8th sample.

3.4 Structural characterisation of coal and bacterial–coal interactions

Coal grains from the time zero un-inoculated control were 100 μm in size (Fig. 4a), possessing smooth and articulated surface textures that were coated with 10 μm and μm-scale coal fines (Fig. 4b). Porous space of some coal grains was in-filled with fine-grained, coal-derived material (Fig. 4c). SEM examination of samples collected at the 90th day demonstrated that the inlet to the coal pack had a significant large bacterial colony (Fig. 5a). These rod-shaped bacteria were attached to both smooth and articulated coal surfaces suggesting that no preferential bacterial attachment to coal occurred, and were also found to produce exopolymer (Fig. 5a, see circle), which for some grains obscured the presence of any underlying bacteria (Fig. 5b). At high magnification, individual strands of exopolymer facilitated adhesion of bacteria to the coal surface and trapped sub-μm coal particles were observed (Fig. 6). The resulting network of bacteria, exopolymer and coal fines are presumably responsible for the decrease in coal pack permeability, discussed earlier. Note that exopolymer was not observed in the control samples (Fig. 4). A second, ‘dominant’ bacterial morphotype (see Fig. 7) was also observed throughout the coal pack. The inoculum, QSAF, is compromised of more than 100 species.
image file: c4ra01628a-f4.tif
Fig. 4 Representative scanning electron micrographs of T = 0 uninoculated control coal fragments. (a) Approximately 10 μm coal-fines coated surface of the coal grain; (b) a higher magnification of location indicated by the arrow on previous image. Approximately μm-size coal fines coated surface of coal grain; (c) coal fines filled residual liptinite macerals (plant structures) within the coal. Scale bars equal 100 μm, 5 μm, and 50 μm, respectively.

image file: c4ra01628a-f5.tif
Fig. 5 Scanning electron micrographs of coal maceral at the inflow (at the 90th day). (a) The growth of rod-shaped bacteria on the surface of the coal (indicated by bacteria undergoing binary fission), note the initial stages of exoploymer formation (circle); (b) other macerals possessed extensive exopolymer, bound to the surface of the coal and obscuring the presence of bacteria. Scale bars equal 2 μm.

image file: c4ra01628a-f6.tif
Fig. 6 High magnification SEM micrograph highlighting the attachment of bacteria to coal macerals via exopolymer formation. Scale bar equals 1 μm.

image file: c4ra01628a-f7.tif
Fig. 7 Scanning electron micrographs of a long (approximately 2 μm), narrow (200 nm diameter) bacterial morphotype that was observed in low numbers (relative to the rod-shaped bacteria in the coal pack inflow region) throughout the coal pack. (a) Sample from the inflow; (b) sample from centre of the coal pack; (c) sample from the outflow. Scale bars equal 1 μm.

It is to be noted that anaerobic conditions for the microbes were successfully maintained inside the core flooding system. This is evident from Fig. 5–7 suggesting the viability of the microbial colonies. Further, we have obtained taxonomic data of the microbial population associated with coal sample at inlet, centre and outlet locations of the core column, which was obtained from the sequencing of 16S rRNA gene and matched to known sequenced microbes, as shown in Fig. S6 in the ESI. This data further supports that anaerobic microbes were present in the coal pack until the experiment was stopped. Also, the entire experiment was conducted at an elevated pressure (1724–3447 kPa(g)) and no leaks were observed during experiment, which provides negligible chances for the outside air to get entrained within the designed core flooding system.

3.5 Signature metabolites in the effluent

Fig. 8 shows the relative concentrations of different putative metabolites detected in uninoculated MSM-tryptone (sample # 0) prior to injection and also for effluents collected at different intervals during the core flooding (samples # 1–8, corresponding to Table 2). The suite of analytes detected is presented as a heat map39 for three replicates of each samples. A dendrogram at the top of heat map shows the clustering of metabolites based on the similarity of their occurrence in the samples. The relative concentration of each metabolite was graded (from −2 to 4) using color codes in the heat map. Low concentration values of metabolites tend towards light blue color while higher concentration values tend towards dark red color. The concentration of a compound in a sample is relative to its concentration in other samples. The numbers (1–8) indicated on the left panel of the map correspond to the effluent sample number represented in Table 2. These numbers are independent of those used for grading the metabolite concentrations (located at the top of heat map). The samples were also grouped according to the stage of methanogenesis. The lag phase corresponds to low CH4 yields in the early stage of the core flood. The active phase corresponds to the increase in CH4 production, while the late phase correspond to the continued production of CH4.
image file: c4ra01628a-f8.tif
Fig. 8 Heat map showing the relative concentration of compounds detected in uninoculated MSM-tryptone (0) and core flooding effluent samples (1–8). The relationships between samples are described using hierarchical clustering. Concentration of compounds increase from blue to red and the concentration of each compound in a sample is relative to its concentration in other samples. Each sample block consists of three technical replicates of each sample.

GC-MS analysis of ethyl acetate extracts of the effluent samples (1–8) compared to the MSM-tryptone control (0) showed the appearance, disappearance or accumulation of various chemical compounds over time. Most of the compounds identified in the core flooding effluent samples have been reported to be signature metabolites of anaerobic and/or aerobic biotransformation of hydrocarbon compounds suggesting that microbial transformation of hydrocarbon constituents within coal took place. However, since control experiments of the inoculum grown on only MSM-tryptone were not conducted, it cannot be ruled out that some of the metabolites detected could be due to the transformation of the growth medium (tryptone) into signature compounds and not from the bulk coal itself. As well, the possibility of abiotic transformation (e.g., solubilization) of coal constituents during the continuous flooding of the coal core could have occurred.

Mono-, di- or aromatic carboxylic acids of C2–C11 were the main putative hydrocarbon intermediates detected in the core flooding effluents, which may indicate the metabolism of larger molecular weight hydrocarbons. Phenylacetate, benzoate and glutarate present in high concentration in MSM-tryptone (pre-injection phase) were likely utilized by microbes in the core, though they could have potentially been produced over time. The appearance of alkylsuccinic acid, methyl succinate and p-tolylacetate in the lag phase (labelled as sample # 1) effluent (within 10 days residence time in the coal pack) may have been as a result of the early transformation of simple coal constituents such as alkanes and monoaromatics or from tryptone itself. The appearance of metabolites, such as naphthoic acids, in subsequent samples was likely indicative of the relatively slower transformation of polycyclic aromatic hydrocarbons. The transient nature of most of the metabolites was observed in Fig. 8, which is typical of the production and utilization of pathway intermediates by various species of microbes in a microbial consortium. 16S rRNA gene sequencing revealed the dominance of Clostridial species (Fig. S6 in the ESI). These organisms are known for their fermentative capabilities of a wide variety of substrates. The majority of metabolites accumulated at relatively higher concentrations in the later samples (late-phase, between 70–90 days), suggesting that microbial activity increased with the incubation period within the coal core. These compounds may be transient in nature and if the core had been operated for a longer period of time, these metabolites may have been converted eventually to methane.

The range of compounds detected, identified and quantified in this work was limited. Nevertheless, the compounds detected were consistent with anaerobic degradation of coal constituents and have been shown to be present in situ within coal seams.17,56 The presence of alkylsuccinic acid (methyl succinate) may indicate the transformation of alkane compounds via addition to fumarate.57,58 In addition, the detection of hexanoic and fatty acids may be indicative of alkane biodegradation. The aromatic constituents of coal may have been degraded based on the detection of toluic acids, phthalic acids and cresols. The presence of naphthoic acids may also be indicative of the biodegradation of the polycyclic aromatic hydrocarbon. The increased diversity of intermediates available for and resulting from microbial metabolism over time may reflect the effect of increasing biomass.

Among the metabolites accumulated in the core flooding effluent, succinic acid is a value added product that can be used as a precursor in the production of polyesters, as a nutraceutical compound and in pharmaceutical preparations.59 This suggests that, in addition to methane, other valuable products such as organic acids may be produced in the core flooding effluents. It was observed that the succinic acid production increased hundred-fold (from sample # 5–8) as methanogenesis progressed (Fig. 6 and S5). The plot of the percentage of methane present in the effluent gases and concentrations of acetic acid (Fig. S5 in the ESI) shows the inverse correlation between methane production and acetic acid concentration. Acetic acid, a methanogenic intermediate substrate, was inversely proportional to methane generation, i.e., it was present in high concentrations for the 2nd sample and its concentration decreased in the subsequent samples (3–6) while CH4 production increased (Fig. 8 and S5), indicating that it may have been used by acetoclastic methanogens for enhanced methane production. The concentration of acetic acid increased in the 7th sample, which corresponds to the decline in the methane generation. For the 8th sample, the decrease in the concentration of acetic acid again correlated to the increase in methane generation. These results indicated that acetic acid was utilized by methanogens as a substrate for the methane generation. Hence, the acetoclastic reaction was likely the dominant methanogenic pathway for the bioconversion process observed during the core flooding experiment described here. However, stable isotopic data of the CH4, CO2 and effluent sample are required for the validation of the predominant methanogenic pathways involved in the present study. The formation of acetic acid from tryptone fermentation cannot be ruled out, hence simultaneous running of bottle experiments with and without the addition of coal to the microbial culture containing MSM-tryptone can be used to support the metabolite formation from coal bioconversion. However, there may be other inhibitory or stimulatory properties affecting the use of acetate (from coal) as a substrate for methanogenesis.

4 Conclusions

In order to simulate the bioconversion process at in situ coal bed conditions, a core flooding system has been designed and commissioned. The core flooding experiment has been carried out in a core holder packed with crushed coal (150–250 μm grain size), operated at elevated pressure (1724–3447 kPa(g)) and with a continuous injection of nutrient-rich MSM-tryptone into the coal pack for 90 days. The experimental design and procedure ensured that anaerobic conditions were maintained during the entire core flooding cycle, which is one of the requirements for simulating methanogenesis in laboratory conditions. A typical heterogeneous coal seam has been replicated by packing the core holder with two different sizes of crushed coal samples. The present study indicated that by supplying nutrients, keeping endemic microbes growing and removing metabolites that inhibit the methanogenesis, biogenic CH4 production can be accelerated. The decrease in the molar ratio of CO2 to CH4 overtime indicated that methanogenic reactions favoured the production of CH4 in the subsequent samples. Running the experiment for an extended period of time might result in the CH4 production surpassing the CO2 production. The observed decrease in the permeability of the coal pack was likely due to a combination of biofilm and extracellular polymeric substance formation, gas adsorption into the coal matrix, and coal fines accumulation. An increase in the production of CH4 with a decrease in the concentration of acetic acid suggests that acetoclastic methanogens utilized acetate as a substrate for CH4 production. The SEM image analysis of the core sample at different locations after the completion of the core flooding study (at the 90th day) demonstrates microbial colonization of the coal. High rates of methane generation from coal is controlled by the bioavailability of coal, which in turn depends on the microbial distribution along the coal pack and contact between coal surface and microbial cell. Analysis of metabolites performed on effluent collected at different stages of incubation showed early transformation of alkane and monoaromatic compounds and slower transformation of polycyclic aromatic hydrocarbons. More controlled studies are required to differential metabolites formed form tryptone fermentation and coal degradation. The direct conversion of the nutrient (tryptone) to CH4 and CO2 cannot be ruled out under the experimental procedure used. The metabolite analysis also suggests that value-added products (e.g., succinic acid) can be recovered apart from CH4 during the coal bioconversion process. This demonstrates a successful laboratory core flooding experiment was achieved. The excess amount of CO2 produced during the coal methanogenesis can be utilized in number of ways rather than venting it to the atmosphere, which is a common practise for energy derived from fossil fuels. The fraction of this CO2 produced might be adsorbed in the coal matrix and remaining can be captured and then be sequestered in underground saline reservoirs or injected into adjacent oil reservoirs for enhanced oil recovery. The core flooding system can be used to understand and optimize coal bioconversion as a scalable, field deployable process while at the same time elucidating key biochemical pathways for the process.

Acknowledgements

The authors gratefully acknowledge financial support from Carbon Management Canada (CMC), Canada Foundation for Innovation and NSERC Discovery Grants for this work. We are thankful to Twyla Malcolm, Stephanie Trottier and Wanyu Chen at Alberta Innovates Technologies Future (AITF) for their help in the preparation of MSM-tryptone and inoculum. We thank Anh Dao and Annie Wong in the Department of Biological Sciences, University of Alberta, for their assistance in GC analysis. We thank Carmen Li in the Department of Biological Sciences, University of Alberta, for her work in generating the pyrotag sequences. We also thank Arnab Guha for elemental analysis of coal and Shadi Ansari for useful discussions regarding chemical reactions and pathways. We also thank TransAlta and Sherritt Coal for providing the subbituminous coal.

References

  1. Center for Climate and Energy Solutions, U.S.A., October 15 2013, http://www.c2es.org/energy/source/coal#Mining.
  2. M. E. Boot-Handford, J. C. Abanades, E. J. Anthony, M. J. Blunt, S. Brandani, N. M. Dowell, J. R. Fernandez, M.-C. Ferrari, R. Gross, J. P. Hallett, R. S. Haszeldine, P. Heptonstall, A. Lyngfelt, Z. Makuch, E. Mangano, R. T. J. Porter, M. Pourkashanian, G. T. Rochelle, N. Shah, J. G. Yao and P. S. Fennell, Energy Environ. Sci., 2014, 7, 130–189 CAS.
  3. International Energy Agency, CO2 Emissions from Fuel Combustion Highlights, 2012, http://www.iea.org/co2highlights/co2highlights.pdf Search PubMed.
  4. A. Burnham, J. Han, C. E. Clark, M. Wang, J. B. Dunn and I. Palou-Rivera, Environ. Sci. Technol., 2012, 46, 619–627 CrossRef CAS PubMed.
  5. T. J. Skone, Life cycle greenhouse gas inventory of natural gas extraction, delivery and electricity production, 2011, http://www.netl.doe.gov/energy-analyses/pubs/NG-GHG-LCI.pdf Search PubMed.
  6. J. L. Clayton, Int. J. Coal Geol., 1998, 35, 159–173 CrossRef CAS.
  7. S. H. Harris, R. L. Smith and C. E. Barker, Int. J. Coal Geol., 2008, 76, 46–51 CrossRef CAS PubMed.
  8. N. Siefert, D. Shekhawat, S. Litster and D. Berry, Energy Environ. Sci., 2012, 5, 8660–8672 CAS.
  9. D. J. Roddy and P. L. Younger, Energy Environ. Sci., 2010, 3, 400–407 CAS.
  10. K. T. Klasson, M. D. Ackerson, E. C. Clausen and J. L. Gaddy, Fuel, 1993, 72, 1673–1678 CrossRef CAS.
  11. A. R. Scott, Int. J. Coal Geol., 2002, 50, 363–387 CrossRef CAS.
  12. E. J. P. Jones, M. A. Voytek, P. D. Warwick, M. D. Corum, A. Cohn, J. E. Bunnell, A. C. Clark and W. H. Orem, Int. J. Coal Geol., 2008, 76, 138–150 CrossRef CAS PubMed.
  13. M. S. Green, K. C. Flanegan and P. C. Gilcrease, Int. J. Coal Geol., 2008, 76, 34–45 CrossRef CAS PubMed.
  14. J. C. Pashin, Appl. Geochem., 2007, 22, 2257–2272 CrossRef CAS PubMed.
  15. D. D. Rice and G. E. Claypool, Am. Assoc. Pet. Geol. Bull., 1981, 65, 5–25 CAS.
  16. T. J. Penner, J. M. Foght and K. Budwill, Int. J. Coal Geol., 2010, 82, 81–93 CrossRef CAS PubMed.
  17. B. Wawrik, M. Mendivelso, V. A. Parisi, J. M. Suflita, I. A. Davidova, C. R. Marks, J. D. V. Nostrand, Y. Liang, J. Zhou, B. J. Huizinga, D. Str[a with combining cedilla]poć and A. V. Callaghan, FEMS Microbiol. Ecol., 2012, 81, 26–42 CrossRef CAS PubMed.
  18. B. Ünal, V. R. Perry, M. Sheth, V. Gomez-Alvarez, K. J. Chin and K. Nüsslein, Front. Microbiol., 2012, 3, 175 Search PubMed.
  19. D. Str[a with combining cedilla]poć, M. Mastalerz, K. Dawson, J. Macalady, A. V. Callaghan, B. Wawrik, C. Turich and M. Ashby, Annu. Rev. Earth Planet. Sci., 2011, 39, 617–656 CrossRef.
  20. G. Ulrich and S. Bower, Int. J. Coal Geol., 2008, 76, 25–33 CrossRef CAS PubMed.
  21. E. J. P. Jones, M. A. Voytek, M. D. Corum and W. H. Orem, Appl. Environ. Microbiol., 2010, 76, 7013–7022 CrossRef CAS PubMed.
  22. G. V. Toledo, T. H. Richardson, U. Stingl, E. J. Mathur and G. Venter, US Pat., US20100047793 A1 , 2010.
  23. L. K. Gallagher, A. W. Glossner, L. L. Landkamer, L. A. Figueroa, K. W. Mandernack and J. Munakata-Marr, Int. J. Coal Geol., 2013, 115, 71–78 CrossRef CAS PubMed.
  24. P. D. Gamson, B. B. Beamish and D. P. Johnson, Fuel, 1993, 72, 87–99 CrossRef CAS.
  25. N. Hadia, L. Chaudhari, S. K. Mitra, M. Vinjamur and R. Singh, Energy Sources, Part A, 2008, 30, 1604–1618 CrossRef CAS.
  26. S. Mazumder, K. H. A. A. Wolf, P. Hemert and A. Busch, Transp. Porous Media, 2008, 75, 63–92 CrossRef CAS.
  27. P. Shen, J. Wang, S. Yuan, T. Zhong and X. Jia, SPE J., 2009, 14, 237–244 CAS.
  28. V. Santosh, S. K. Mitra, M. Vinjamur and R. Singh, Energy Fuels, 2007, 21, 3353–3359 CrossRef CAS.
  29. M. Nobakht, S. Moghadam and Y. Gu, Energy Fuels, 2007, 21, 3469–3476 CrossRef CAS.
  30. N. J. Hadia, S. K. Mitra and M. Vinjamur, Exp. Therm. Fluid Sci., 2012, 40, 177–184 CrossRef PubMed.
  31. Y. Ohtomo, A. Ijiri, Y. Ikegawa, M. Tsutsumi, H. Imachi, G. Uramoto, T. Hoshino, Y. Morono, S. Sakai, Y. Saito, W. Tanikawa, T. Hirose and F. Inagaki, Frontiers in Microbiology, 2013, 4(361), 1–17 Search PubMed.
  32. Alberta Innovates Technology Futures (AITF), Safe Operating Procedures CEM-003-003-02, Continuous Flow Through Columns, unpublished data, 2010.
  33. L. Chaudhari, N. J. Hadia, S. K. Mitra and M. Vinjamur, Energy Sources, Part A, 2011, 33, 948–958 CrossRef CAS.
  34. P. M. Fedorak and S. E. Hrudey, Water Res., 1984, 18, 361–367 CrossRef CAS.
  35. K. Budwill and T. Malcolm, US Pat. US0252255 A1, 2010.
  36. K. Budwill, S. Koziel and J. Vidmar, Society of Petroleum Engineers - Canadian Unconventional Resources Conference 2011, 2011, vol. 2, pp. 1621–1629 Search PubMed.
  37. J. G. Speight, Coal-fired power generation handbook, Scrivener Publishing and John Wiley & Sons, Inc, 2013 Search PubMed.
  38. K. Budwill, W. J. Page and P. M. Fedorak, J. Environ. Polym. Degrad., 1996, 4, 91–102 CrossRef CAS.
  39. J. Xia, R. Mandal, I. V. Sinelnikov, D. Broadhurst and D. S. Wishart, Nucleic Acids Res., 2012, 40, W127–W133 CrossRef CAS PubMed.
  40. J. J. H. Ward, J. Am. Stat. Assoc., 1963, 58, 236–244 CrossRef.
  41. W. Lin, G. Q. Tang and A. R. Kovscek, SPE Reservoir Eval. Eng., 2008, 11, 792–802 CAS.
  42. P. D. Warwick, F. C. Breland Jr and P. C. Hackley, Int. J. Coal Geol., 2008, 76, 119–137 CrossRef CAS PubMed.
  43. R. M. Flores, C. A. Rice, G. D. Stricker, A. Warden and M. S. Ellis, Int. J. Coal Geol., 2008, 76, 52–75 CrossRef CAS PubMed.
  44. M. J. Whiticar, E. Faber and M. Schoell, Geochim. Cosmochim. Acta, 1986, 50, 693–709 CrossRef CAS.
  45. J. G. Ferry, Curr. Opin. Biotechnol., 2011, 22, 351–357 CrossRef CAS PubMed.
  46. G. Jean-Louis, O. Bernard and W. B. Whitman, The Prokaryotes, Springer, New York, 2006, pp. 208–230 Search PubMed.
  47. E. Wilhelm, R. Battino and R. J. Wilcock, Chem. Rev., 1977, 77, 219–262 CrossRef CAS.
  48. D. A. Wiesenburg and N. L. Guinasso Jr, J. Chem. Eng. Data, 1979, 24, 356–360 CrossRef CAS.
  49. S. Jin, A. E. Bland and H. S. Price, US Pat., US20090246849 A1 , 2009.
  50. R. S. Pfeiffer, G. A. Ulrich and M. Finkelstein, US Pat., US7696132 B2 , 2010.
  51. Active biogenesis of methane in Wyoming's Powder River Basin, Luca Technologies Inc., 2004 Search PubMed.
  52. S. W. Taylor, P. Milly and P. R. Jaffe, Water Resour. Res., 1990, 26, 2161–2169 CrossRef.
  53. P. Vandevivere and P. Baveye, Appl. Environ. Microbiol., 1992, 58, 1690–1698 CAS.
  54. S. Mazumder and K. Wolf, Int. J. Coal Geol., 2008, 74, 123–138 CrossRef CAS PubMed.
  55. N. H. Hazrin-Chong and M. Manefield, J. Microbiol. Methods, 2012, 90, 96–99 CrossRef CAS PubMed.
  56. K. E. Duncan, L. M. Gieg, V. A. Parisi, R. S. Tanner, S. G. Tringe, J. Bristow and J. M. Suflita, Environ. Sci. Technol., 2009, 43, 7977–7984 CrossRef CAS PubMed.
  57. L. M. Gieg and J. M. Suflita, Environ. Sci. Technol., 2002, 36, 3755–3762 CrossRef CAS.
  58. V. A. Parisi, G. R. Brubaker, M. J. Zenker, R. C. Prince, L. M. Gieg, M. L. B. D. Silva, P. J. J. Alvarez and J. M. Suflita, Microb. Biotechnol., 2009, 2, 202–212 CrossRef CAS PubMed.
  59. J. G. Zeikus, M. K. Jain and P. Elankovan, Appl. Microbiol. Biotechnol., 1999, 51, 545–552 CrossRef CAS.

Footnote

Electronic supplementary information (ESI) available. See DOI: 10.1039/c4ra01628a

This journal is © The Royal Society of Chemistry 2014
Click here to see how this site uses Cookies. View our privacy policy here.