Facile method to synthesize silver nanoparticles on the surface of hollow glass microspheres and their microwave shielding properties

Zheng Huang*ab, Bo Chia, Jianguo Guanc and Yaqing Liub
aCenter for Fuel Cell Innovation, State Key Laboratory of Material Processing and Die & Mould Technology, School of Materials Science and Engineering, Huazhong University of Science & Technology, Wuhan, 430074, China. E-mail: hznuc@163.com; Fax: +86 27 87558142; Tel: +86 27 87558142
bResearch Center for Engineering Technology of Polymeric Composites of Shanxi Province, School of Materials Science and Engineering, North University of China, TaiYuan, 030051, China
cState Key Laboratory of Advanced Technology for Materials Synthesis and Processing, Wuhan University of Technology, Wuhan, 430070, China

Received 24th February 2014 , Accepted 26th March 2014

First published on 27th March 2014


Abstract

In this paper, a facile method for the fabrication of hollow glass microspheres–Ag composite particles with core–shell structures is investigated. Ag-coated hollow glass microspheres with raspberry morphology have been prepared by an in situ composite technique in the presence of polyvinylpyrrolidone (PVP). The as-prepared composite particles are characterized by XRD, SEM, EDS, TEM, IR, and XPS. The results show that 3-aminopropyltriethoxysilane (APTS) coupling can remarkably improve the adhesion between the palladium colloid particles and the surface of hollow glass microspheres, increasing the amount of active sites on such surfaces. With the increase in pH value, the equilibrium of the [Ag(NH3)2]+ solution is destroyed, which is beneficial to the output of Ag nanoparticles. The shell thickness of silver-coated hollow glass microspheres increases from 30 nm to 52 nm with an increase in the concentration of the [Ag(NH3)2]+ solution. The shielding property of the composite particles increases gradually and shows an obvious increase in the range of 30% to 35% with an increase in the volume fraction of the composite particles. When the volume fraction of the filler reaches 35%, electromagnetic shielding effectiveness is between 70 dB and 80 dB with the frequency of electromagnetic wave ranging from 2 GHz to 12 GHz. These results indicate that the Ag-coated glass microsphere's core–shell particles could have extensive applications in the electromagnetic compatibility field.

1. Introduction

As the use of electronics, communication devices and instruments increases, electromagnetic interference among devices, such as foldable cellular phones, wearable computers, and radios can degrade their performance.1 The shielding or blocking of electromagnetic signals is an effective technique to meet the working requirements of such devices, and it is a possible solution to the growing concerns about the effects of electromagnetic irradiation and interference in society.2–4 Many electromagnetic shielding materials such as metals,5 carbon-based materials,6,7 and electrically conductive polymer composites8–10 have been intensively studied in both fundamental and applied research fields to prevent undesirable effects.

Traditionally, metals are considered to be the best materials for electromagnetic shielding, but they often suffer from disadvantages such as heavy weight and ease of corrosion, which restricts their widespread use in these materials.11 Carbon-based materials such as carbon nanotubes,12 carbon black,13 and carbon fibers14 are often used as conducting fillers. These materials are incorporated into polymers to make efficient electromagnetic shielding materials that are light weight, flexible, corrosion resistant, and effective. Nevertheless, carbon materials and polymers at low temperature are vulnerable to oxidation, which restricts some of their applications when used in oxidizing atmospheres. It should be noted that electrically conductive polymers are currently expensive, difficult to process, and need considerable improvements in mechanical properties.15–17 On the other hand, the use of polymers for housing electronic devices is popular because they are light weight, flexible and inexpensive. However, polymers are electrically insulating and transparent to electromagnetic radiation, i.e. their inherent electromagnetic shielding effectiveness is practically zero.

Thin sheets or films, which are two-dimensional (2-D) structures and hold unique planar properties with remarkable advantages such as light weight, mechanical flexibility and easy processing, have attracted significant attention in the application of electromagnetic shielding coatings on working parts.18 Park et al. have prepared CNT thin films in polymeric composites by a vacuum bagging process, followed by fabrication into sandwich structures. The as-obtained structures showed increasing electromagnetic shielding by adjusting the layers of the composite films in the range of 2–18 GHz.19 Wang et al. used screen printing to fabricate CNT-based films, which exhibited much higher electromagnetic shielding effectiveness than graphite- and carbon black-based films in the megahertz region.20 In order to shield against electromagnetic interference, various materials are selected for use in different microelectronics devices depending on their shielding effectiveness over different frequency ranges.21–24 They are also used in microwave applications for avoiding unwanted interference from electromagnetic waves. Thus, a number of researchers have endeavored to prepare electrically conductive composites as effective electromagnetic shielding materials.25–30

As an important raw material of electromagnetic shielding materials, Ag powder is widely used in the electronic industry and military affairs.31 However, Ag is a noble metal of low abundance; therefore, preparation of Ag-coated core–shell composite particles is proposed in order to decrease the amount of Ag and density of Ag powder.32–35 The composite particles with hollow structures have low density and can control the electromagnetic parameters of such materials by adjusting the configuration parameters of the composite particles within a certain range.36–38 There are many methods for deposition of Ag nanoparticles on substrates, such as the seed-mediated growth technique,39–42 chemical plating,43 and chemical self-assembly monolayer technique.44–49 However, most of these methods lead to non-autocatalytic metal plating in the bulk solution and result in coarse suspensions that cause major metal precursor consumption and necessitate their regeneration. Uneven distribution or lower metal coverage on the core surface was obtained.50 Moreover, the shell thickness of composite particles cannot be controlled easily.

Based on the autocatalytic redox reaction occurring at the interface between solution and hollow glass microspheres, herein, we report nanostructured composite particles consisting of Ag-nanoparticle-coated hollow glass microspheres with even and compact shells, prepared by an in situ composite technique in the presence of PVP. The core–shell composite particles have good electrical properties and effective shielding without high cost or weight. This indicates that the Ag-coated hollow glass microspheres could have extensive applications in the electromagnetic compatibility field.

2. Experimental results

2.1 Materials

Hollow sodium borosilicate glass spheres with a size range of 2.5–100 μm were used as substrates for silver shell deposition, which were purchased from Shanghai Green Sub-Nanoscale Material Co., Ltd. 3-Aminopropyltriethoxysilane (APTS) was purchased from Wuhan University Organosilicon New Material Co., Ltd and vacuum distilled before usage. Silver nitrate (Aldrich, 99.9%) and glucose (Aldrich, 99.9%) were used for Ag shells, which was produced via simple chemical reduction. All other chemicals used in the experiments were obtained from commercial sources as analytical reagents and used without further purification.

2.2 Preparation of Ag-coated hollow glass microspheres

Prior to use, three surface treatment steps were used in order to improve the surface properties of hollow glass microspheres: (1) all substrates were cleaned by boiling in 10% (wt%) sodium hydroxide solution for 10 min, then filtered and rinsed with deionized water and ethanol, and dried at 80 °C overnight; (2) the as-prepared substrates were immersed into an APTS coupling agent solution for 2 h and dried at 60 °C; and (3) the as-prepared coupling substrates were immersed into a colloid palladium activator solution for 4 h and dried at 80 °C. Briefly, according to literature,51 1.0 g PdCl2 was dissolved in 1000 mL deionized water, then 20 mL HCl (37 wt%) was added under magnetic stirring for 30 min.

For the preparation of Ag-coated hollow glass microspheres, Ag nanoparticles were prepared by the reduction of AgNO3 solution in a glucose (C6H12O6) solution in the presence of PVP. AgNO3 (3.5 g) was dissolved in 60 mL deionized water, then 0.1 M NH3·H2O (28 wt%) was added until the solution again became transparent to form [Ag(NH3)2]+ solution. Reducing solution was prepared by mixing 45 g C6H12O6, 1.5 g PVP, 100 mL ethanol and 1 L deionized water. Functionalized hollow glass microspheres (1.5 g) were dispersed in 50 mL of 1 wt% sodium dodecyl sulfonate (SDS) of [Ag(NH3)2]+ solution for 30 min. Then, silver-coated hollow glass microspheres were obtained by mixing the [Ag(NH3)2]+ solution and reducing solution in a 1/1 (v/v) ratio dropwise with magnetic stirring for 6 h. The final products were collected by centrifugation (8000 rpm per 10 min), washed with ethanol and deionized water, and dried under vacuum at 80 °C.

2.3 Characterization

To reveal detailed information about the chemical composition and crystallographic structure, powder X-ray diffraction (XRD) was carried out by using an X'Pert PRO X-ray diffractometer with CuKα radiation of wavelength 0.154056 nm at a scan speed of 10° min−1. The surface morphology and the structure of composites were examined by transmission electron microscopy (TEM) with a Philips CM12 microscope operated at 80 kV and field emission scanning electron microscopy (FESEM) with a Zeiss DSM940 instrument operated at an accelerating voltage of 20 kV. The component analysis of the samples was carried out by energy-dispersive spectroscopy (EDS). The functional groups of composite particles were examined by infrared (IR) with scanning in the range of 4000 cm−1 to 400 cm−1. The compositions of composite particles were examined by X-ray photoelectron spectroscopy (XPS) (Perkin-Elmer, PHI-5300) using MgKα source at 1253.6 eV. The X-ray powder supply was operated at 250 W (12.5 kV, 20 mA) and the pressure in the analysis chamber during scans was kept below 2 × 10⁻⁷ Pa.

2.4 Electrical conductivity and EMI shielding measurement

The volume resistivity (ohm cm) of composites with a high resistivity ≥108 ohmcm was measured using a Hewlett-Packard high-resistance meter (model 4329A), coupled with a Hewlett-Packard (model 160084) resistivity cell. For composites having low resistivity, the volume resistivity was measured by a four-probe technique using the van der Pauw method as described in the literature.52 To measure the volume resistivity at a constant temperature, the entire electrode system was placed in an oven, in which the temperature could be monitored and controlled. The resistivity data used were the average of results of three samples (samples were produced as well-dispersed mixtures at the same volume percentage using solid paraffin).

The complex permittivity of 2–12 GHz was determined with a coaxial cell on a Hewlett-Packard 8510C Vector Network Analyzer. The core–shell particles were processed as well-dispersed mixtures. For example, the mixtures containing 30% (in volume, the same below) core–shell microspheres sample and 70% solid paraffin as an adhesive, resulted in a coaxial cylindrical sample with the following characteristics: outer diameter of 7.00 mm, inner diameter of 3.02 mm and thickness of about 3.5 mm. The shielding effectiveness of the coating was measured according to ASTM-ES-7. A network analyser (4396B; Agilent Technologies, Inc., Santa Clara, CA, USA) and an S-Parameter test set (Agilent; 85046A) were employed, and a coaxial sample holder was designed according to ASTM D4935-10. The electromagnetic shielding coatings were processed by mixing various quantities of shielding filler (Ag-coated hollow glass microspheres) into an epoxy resin adhesive. Then, the coated samples were processed at 100 °C for 10 h. The diameter of the load specimen was 13.5 cm.

3. Results and discussion

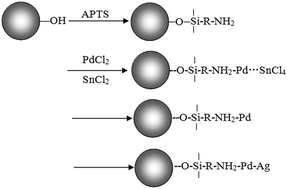
Fig. 1 shows the schematic illustration of the formation process of Ag nanoparticles decorating hollow glass microspheres. It has been demonstrated that glass microspheres tend to carry negative charges in a basic solution due to its isoelectric point (IEP) at ∼2 and its zeta potential profile.16 APTS coupling agent has two functional groups, i.e. ethoxy group and amino group. Generally, chemical deposition reaction of Ag occurs at the adsorbed palladium's catalytically active centers on nonmetallic substrates.53 The surface of hollow glass microspheres with a large amount of hydroxyl groups can interact with ethoxy groups of silane coupling agent via hydrogen bonds. Moreover, another amino group, which has a pair of nonbonded electrons, could form a complex with Pd2+, which has an electron figuration of 4d85s05p0 in the outermost orbital. Such a bridging function of APTS coupling agent could remarkably improve the adhesion between the palladium colloid particles and the surface of hollow glass microspheres, increasing the amount of active sites on such surfaces.
image file: c4ra01617c-f1.tif
Fig. 1 A schematic illustration of the procedure for generating silver-decorated hollow glass microspheres.

Fig. 2 displays the EDS spectrum of the hollow glass microspheres, after they were added to a colloid palladium activator solution, with and without APTS coupling agent. It can be found that the palladium surface content of hollow glass microspheres pretreated with APTS coupling agent exceeds that without pretreatment. The surface property of hollow glass microspheres pretreated by APTS coupling agents is beneficial for the adsorption of palladium. Therefore, it leads to an increase in the active sites on the surface of hollow glass microspheres and forms an ideal deposition on such surfaces.


image file: c4ra01617c-f2.tif
Fig. 2 EDS spectrum of pretreated hollow glass microspheres with and without coupling.

Fig. 3 shows the IR spectra of hollow glass microspheres coupled by different concentrations of APTS (0, 0.001, 0.002, and 0.003 mol L−1). The intensity of the absorption peak weakened at 3400 cm−1 and 1600 cm−1 with an increase in the concentrations of APTS; that is, the quantity of physically adsorbed water and Si–OH groups decreased. The absorption peak of CH2 is observed clearly at 1630 cm−1, and the absorption peak of C[double bond, length as m-dash]N appears at 1550 cm−1 after hollow glass microspheres are coupled by APTS coupling agent, which indicates that the surface of hollow glass microspheres were truly coupled. The characteristic absorption peak of SiO2 (1100 cm−1, 797 cm−1 and 471 cm−1) does not have any distinct variation. The physical form and crystal configuration of hollow glass microspheres cannot be changed by adding APTS coupling agents because the partial hydroxide group bonds with the silane coupling agent to create an Si–O bond.


image file: c4ra01617c-f3.tif
Fig. 3 IR spectra of hollow glass microspheres coupled by different concentrations of APTS. (a) 0, (b) 0.001 mol L−1, (c) 0.002 mol L−1, (d) 0.003 mol L−1.

XRD patterns of Ag-decorated hollow glass microspheres with APTS coupling agents at different pH values (12, 12.5, 13, 13.5, and 14) are shown in Fig. 4. The pH value of the solution is adjusted by NaOH solution. It can be seen that Ag-decorated hollow glass microspheres diffraction peaks around 38.10°, 44.26°, 64.44°, and 77.42° are found for Ag(111), Ag(200), Ag(220), and Ag(311), respectively, which indicates that the Ag has been decorated on the hollow glass microspheres. The 2θ angle agrees with the normal 2θ angle of Ag comparing with normal card (PDF:040783), which indicates that Ag nanoparticles decorating the surface of hollow glass microspheres have intact, face-centred cubic structures. Because an equilibrium exists in the [Ag(NH3)2]+ solution with an instability coefficient, Kβ = 107.05, the concentration of Ag+ in the [Ag(NH3)2]+ solution is very low during the coating process. When the reducing solution is added to the [Ag(NH3)2]+ solution, a small portion of Ag+ in the solution can be reduced. Ag nanoparticles that act as seeds can form localized nucleation sites on the surfaces of hollow glass microspheres. With an increase of pH value, the equilibrium is destroyed. The output of Ag becomes greater, and the diffracted intensity of Ag becomes stronger.


image file: c4ra01617c-f4.tif
Fig. 4 XRD patterns of silver-coated hollow glass microspheres obtained under varying pH.

The sample's purity and elemental composition are determined by XPS.35 Fig. 5 shows the XPS spectra for the Ag–hollow glass microspheres. The binding energies obtained in the XPS analysis are standardized for specimen charging by using C1s as the reference at 284.6 eV. No peaks of any other elements except C, O, Si and Ag were observed in the survey spectrum. The binding energies are 368.26 eV for Ag3d5/2, 103.36 eV for Si2p and 532.56 eV for O1s, and these are assigned to the elements in silica and Ag metal.


image file: c4ra01617c-f5.tif
Fig. 5 XPS analysis of silver-coated hollow glass microspheres.

A pretreatment method was used in order to obtain ideal chemical deposition of Ag nanoparticles on hollow glass microspheres. The pretreatment includes surface treatment, APTS coupling, and colloid palladium activation. Fig. 6 shows the typical SEM photographs with and without Ag nanoparticles decorating the hollow glass microspheres prepared via pretreatment. It is found from Fig. 6a that some rough holes appear on the shells of hollow glass microspheres, and some broken glass microspheres can be observed. Fig. 6b shows that a few Ag nanoparticles decorate hollow glass microspheres, which are pretreated by a colloid palladium activator solution, without APTS coupling. Fig. 6c shows that numerous Ag nanoparticles decorate hollow glass microspheres, which are pretreated by a colloid palladium activator solution, with APTS coupling (same as the above pretreatment). The amount of palladium increases with APTS coupling. In order to investigate the element composition, Ag nanoparticles decorating hollow glass microspheres are analyzed by EDS, as shown Fig. 6d. It can be found that the composition of Ag, Si, O, Mg, and Al can be observed in the sample, which can be assigned to hollow glass microspheres. No other impure element is detected, which is almost consistent with the XRD results.


image file: c4ra01617c-f6.tif
Fig. 6 Morphology of hollow glass microspheres with and without silver-coated nanoparticles. (a) Etched by sodium hydroxide; (b) reaction for 4 h without coupling; and (c) reaction for 8 h with coupling and EDS spectrum of composite particles.

Fig. 7 shows the effect of the concentration of the [Ag(NH3)2]+ solution on the shell thickness of Ag-coated hollow glass microspheres in the presence of PVP. The pristine hollow glass microspheres exhibit slick sphericity, whereas the composite particles exhibit raspberry morphology. The shell thickness is about 30 nm when the concentration of the [Ag(NH3)2]+ solution is 0.2 M, and Ag nanoparticles are increasingly produced with an increase in the concentration of the [Ag(NH3)2]+ solution. The renascent Ag nanoparticles have very high activity, and the subsequent Ag nanoparticles are formed on the interfaces, which have high active potential location; thus, the size of Ag-coated hollow glass microspheres becomes larger. The shell thicknesses of silver-coated hollow glass microspheres increases from 30 nm to 52 nm with an increase in concentration of the [Ag(NH3)2]+ solution.


image file: c4ra01617c-f7.tif
Fig. 7 TEM photographs of silver-coated hollow glass microspheres obtained under different concentrations of [Ag(NH3)2]+ in the presence of PVP. (a) 0, (b) 0.2 mol L−1, (c) 0.4 mol L−1 and (d) 0.6 mol L−1.

Fig. 8 shows the electromagnetic shielding effectiveness curve for mixtures with different volume fraction of particles in the range of 2.0 GHz to 12.0 GHz. Compared with coating material with excessive volume fraction for fillers, inadequate fillers will lead to inferior electrical properties in the coating. According to the Schelkunoff theory, shielding material with perfect electrical properties will have perfect electromagnetic shielding properties. These perfect electrical properties contribute to strong reflection and absorbance losses in the shielding effectiveness of electromagnetic shielding material. With increasing volume fraction of composite particles, the shielding effectiveness of composites increases gradually and shows an obvious increase in the range from 30% to 35%. The conductive particles cannot form catenarian morphology in the mixture with a decrease in the volume fraction of particles. When the volume fraction of particles increases, the particles cannot form an effective conductive net due to the loose structure of the mixture.


image file: c4ra01617c-f8.tif
Fig. 8 The shielding effectiveness curve of mixtures with different volume fraction under the frequency of microwave ranging from 2.0 GHz to 12.0 GHz.

4. Conclusions

In summary, a facile method for the fabrication of hollow glass microspheres–Ag composite particles with core–shell structures is investigated. Ag-coated hollow glass microspheres with raspberry morphology have been prepared by an in situ composite technique in the presence of PVP. The as-prepared composite particles are characterized by XRD, SEM, EDS, TEM, IR, and XPS. The results show that 3-aminopropyltrimethoxysilane (APTS) coupling can remarkably improve the adhesion between the palladium colloid particles and the surface of hollow glass microspheres, increasing the amount of active sites on such surfaces. With an increase in pH value, the equilibrium of the [Ag(NH3)2]+ solution is destroyed, which is beneficial to the output of Ag nanoparticles. The shell thicknesses of silver-coated hollow glass microspheres increases from 30 nm to 52 nm as the concentration of the [Ag(NH3)2]+ solution increases. The shielding property of the composite particles increases gradually and shows an obvious leap in the range from 30% to 35% with increase in the volume fraction of the composite particles. When the volume fraction of the filler reaches 35%, the shielding effectiveness is between 70 dB and 80 dB, and the frequency of electromagnetic wave ranges from 2 GHz to 12 GHz. These results indicate that the Ag-coated glass microsphere core–shell particles could have extensive applications in the electromagnetic compatibility field.

Acknowledgements

The authors would like to thank Program for National Ministry of Education “New Century Excellent Person with Ability Auspice Program” (no. WCET-05-0660) for financial support and Materials Characterization Center of Wuhan University of Technology and North University of China for samples characterization assistance.

References

  1. N. C. Das, D. Khastgir, T. K. Chaki and A. Chakraborty, Composites, Part A, 2000, 31, 1069–1081 CrossRef.
  2. T. K. Gupta, B. P. Singh, R. B. Mathur and S. R. Dhakate, Nanoscale, 2014, 6, 842–851 RSC.
  3. F. Ye, L.-T. Zhang, X.-W. Yin, X.-F. Liu, Y.-S. Liu, J.-M. Xue and L.-F. Cheng, J. Alloys Compd., 2014, 589, 579–589 CrossRef CAS PubMed.
  4. H. Azizi, F. T. Belkacern, D. Moussaoui, H. Moulai, A. bendaoud and M. Bensetti, J. Electromagn. Waves Appl., 2014, 28, 494–514 CrossRef.
  5. M. Yang, W.-C. Zhou, F. Luo, D.-M. Zhu, Y.-C. Qing and Z.-B. Huang, J. Mater. Sci., 2014, 49, 1527–1536 CrossRef.
  6. T. W. Yoo, Y. K. Lee, S. J. Lim, H. G. Yoon and W. N. Kim, J. Mater. Sci., 2014, 49, 1701–1708 CrossRef CAS.
  7. S. Varshney, A. Ohlan, V. K. Jain, V. P. Dutta and S. K. Dhawan, Mater. Chem. Phys., 2014, 143, 806–813 CrossRef CAS PubMed.
  8. A. Das, J. Krishnasamy, R. Alagirusamy and A. Basu, Fibers Polym., 2014, 15, 169–174 CrossRef CAS.
  9. X.-C. Wang, Z. Liu and Z. Zhou, International Journal of Applied Electromagnetics and Mechanics, 2014, 44, 87–97 Search PubMed.
  10. D. Soyaslan, O. Goktepe and S. Comlekci, Sci. Eng. Compos. Mater., 2014, 21, 129–135 Search PubMed.
  11. Y.-M. Wang, Int. J. Mater. Res., 2014, 105, 3–12 CrossRef CAS.
  12. M. S. Kim, J. Yan, K. H. Joo, J. K. Pandey, Y. J. Kang and S. H. Ahn, J. Appl. Polym. Sci., 2013, 130, 3947–3951 CAS.
  13. T. Zhai, L.-Z. Di and D.-A. Yang, ACS Appl. Mater. Interfaces, 2013, 5, 12499–12509 CAS.
  14. W.-L. Song, M.-S. Cao, M.-M. Liu, B. Song, C.-Y. Wang, J. Liu, J. Yuan and L.-Z. Fan, Carbon, 2014, 66, 67–76 CrossRef CAS PubMed.
  15. W. B. Ko, Y. J. Oh and B. H. Cho, Asian J. Chem., 2013, 25, 4657–4660 CAS.
  16. W. Wang, Z.-P. Li, B.-H. Gu, Z.-Y. Zhang and H.-X. Xu, ACS Nano, 2009, 3, 3493–3496 CrossRef CAS PubMed.
  17. B. Zhang, L.-P. Zheng, W.-Y. Li and J.-W. Wang, Curr. Nanosci., 2013, 9, 363–370 CrossRef CAS.
  18. X.-S. Zhang, J.-X. Wang, K. Xu, Y.-A. Le and J.-F. Chen, J. Nanosci. Nanotechnol., 2011, 11, 3481–3487 CrossRef CAS PubMed.
  19. J. G. Park, J. Louis, Q. Cheng, J.-W. Bao, J. Smithyman and R. Liang, Nanotechnology, 2009, 20, 1–7 Search PubMed.
  20. L.-L. Wang, B. K. Tay, K. Y. See, Z. Sun, L. K. Tan and D. Lua, Carbon, 2009, 47, 1905–1910 CrossRef CAS PubMed.
  21. A. Kudelski and S. Wojtysiak, J. Phys. Chem. C, 2012, 116, 16167–16174 CAS.
  22. L. V. Mathieu and D. Brouard, J. Phys. Chem. C, 2011, 115, 2974–2981 Search PubMed.
  23. S. Okada, S. Ikurumi, T. Kamegawa, K. Mori and H. Yamashita, J. Phys. Chem. C, 2012, 116, 14360–14367 CAS.
  24. C.-Y. Li, Y.-H. Zhu, X.-Q. Zhang, X.-L. Yang and C.-Z. Li, RSC Adv., 2012, 2, 1765–1768 RSC.
  25. J. C. Flores, V. Torres, M. Popa, D. Crespo and J. M. Calderon, J. Non-Cryst. Solids, 2008, 354, 52–54 CrossRef PubMed.
  26. M. L. Viger, L. S. Live, O. D. Therrien and D. Boudreau, Plasmonics, 2008, 3, 33–40 CrossRef CAS.
  27. B. P. Bastakoti, S. Guragain, S. Yusa and K. Nakashima, RSC Adv., 2012, 2, 5938–5940 RSC.
  28. B.-L. Lv, Y. Xu, H. Tian, D. Wu and Y.-H. Sun, J. Solid State Chem., 2010, 183, 2968–2973 CrossRef CAS PubMed.
  29. F. Tang, F. He, H.-C. Cheng and L.-D. Li, Langmuir, 2010, 26, 11774–11778 CrossRef CAS PubMed.
  30. P.-Y. Yuan, Y.-H. Lee, Z.-P. Guan and Q.-H. Xu, Nanoscale, 2012, 4, 5132–5137 RSC.
  31. D. Mongin, V. Juve, P. Maioli, A. Curt and F. Vallee, Nano Lett., 2011, 11, 3016–3021 CrossRef CAS PubMed.
  32. G.-X. Gu, J.-X. Xu, Y.-F. Wu, M. Chen and L.-M. Wu, J. Colloid Interface Sci., 2011, 359, 327–333 CrossRef CAS PubMed.
  33. J. P. Yang, F. Zhang, Y.-R. Chen, S. Qian, P. Hu, W. Li and Y.-H. Deng, Chem. Commun., 2011, 47, 11618–11620 RSC.
  34. T. Liu, D.-S. Li, D.-R. Yang and M.-H. Jiang, Chem. Commun., 2011, 47, 5169–5171 RSC.
  35. T.-Y. Zhang, X.-Q. Li, S.-Z. Kang, L.-X. Qin, G.-D. Li and J. Mu, J. Mater. Chem. A, 2014, 2, 2952–2959 CAS.
  36. J.-J. Liang, Y. Wang, Y. Huang, Y.-F. Ma, Z.-F. Liu, J.-M. Cai, C.-D. Zhang, H.-J. Gao and Y.-S. Chen, Carbon, 2009, 47, 922–925 CrossRef CAS PubMed.
  37. S. Kwon, R.-J. Ma, U. Kim, H. R. Choi and S. Baik, Carbon, 2014, 68, 118–124 CrossRef CAS PubMed.
  38. W.-L. Song, P. Wang, L. Cao, A. Anderson, M. J. Meziani and A. J. Farr, Angew. Chem., Int. Ed., 2012, 51, 6498–6501 CrossRef CAS PubMed.
  39. M.-J. Hu, J.-F. Gao, Y.-C. Dong, K. Li, G.-C. Shan and S.-L. Yang, Langmuir, 2012, 28, 7101–7106 CrossRef CAS PubMed.
  40. D.-X. Yan, P.-G. Ren, H. Pang, Q. Hu, M.-B. Yang and Z.-M. Li, J. Mater. Chem., 2012, 22, 18772–18774 RSC.
  41. W.-L. Song, M.-S. Cao, M.-M. Lu, J. Yang, H.-F. Ju and Z.-L. Hou, Nanotechnology, 2013, 24, 115708 CrossRef PubMed.
  42. P. Saini, V. Choudhary, N. Vijayan and R. K. Kotnala, J. Phys. Chem. C, 2012, 116, 13403–13412 CAS.
  43. X.-M. Kong, Q. Yu, X.-F. Zhang, X.-Z. Du and H. Gong, J. Mater. Chem., 2012, 22, 7767–7774 RSC.
  44. B. S. Villacorta, T. H. Hubing and A. A. Ogale, Compos. Sci. Technol., 2013, 89, 158–166 CrossRef CAS PubMed.
  45. G. Mondin, F. M. Wisser, A. Leifert, N. N. Mohamed, J. Grothe, S. Dorfler and S. Kaskel, J. Colloid Interface Sci., 2013, 411, 187–193 CrossRef CAS PubMed.
  46. J. A. Andres, N. P. Gonzalez, C. Fonseca, E. Perez and M. L. Cerrada, Mater. Chem. Phys., 2013, 142, 2–3 Search PubMed.
  47. B. Shen, W.-T. Zhai, M.-M. Tao, J.-Q. Ling and W.-G. Zheng, ACS Appl. Mater. Interfaces, 2013, 5, 11383–11391 CAS.
  48. S. Ryu, C. B. Mo, H. Lee and S.-H. Hong, J. Nanosci. Nanotechnol., 2013, 13, 7669–7674 CrossRef CAS PubMed.
  49. S. G. Pardo, L. Arboleda, A. Ares, X. Garcia, S. Dopico and M.-J. Abad, Polym. Compos., 2013, 34, 1938–1949 CrossRef CAS.
  50. L.-Y. Zhang, L.-B. Wang, K. Y. See and J. Ma, J. Mater. Sci., 2013, 48, 7757–7763 CrossRef CAS.
  51. R. K. Goyal, Mater. Chem. Phys., 2013, 142, 195–198 CrossRef CAS PubMed.
  52. J. Arranz-Andres, E. Perez and M. L. Cerrada, Sci. Adv. Mater., 2013, 5, 1524–1532 CrossRef CAS PubMed.
  53. J. Huang, Q. Li, L. Denian, Y. Wang, L.-J. Dong, H.-A. Xie, J. Wang and C.-X. Xiong, Langmuir, 2013, 29, 10223–10228 CrossRef CAS PubMed.

This journal is © The Royal Society of Chemistry 2014
Click here to see how this site uses Cookies. View our privacy policy here.