DOI:
10.1039/C4RA01570C
(Paper)
RSC Adv., 2014,
4, 23853-23860
Tuned surface area and mesopore diameter of ordered mesoporous carbon: ultrahigh decontamination of di(2-ethylhexyl)phthalate
Received
23rd February 2014
, Accepted 11th April 2014
First published on 15th April 2014
Abstract
Synthesis of carbon materials with enhanced surface areas, and regular and tuned pore diameters is always a great challenge. In this report, ordered mesoporous carbons (OMCs) were synthesized by the one-step assembly of tri-constituents, and the OMCs were applied as an adsorbent for the removal of the highly hazardous water pollutant di(2-ethylhexyl)phthalate (DEHP). Phloroglucinol–formaldehyde based carbon precursor was in situ prepared during the assembly of the tri-constituents, and the surface area and mesopore diameter of the OMCs were tuned by variation of the molar ratio of formaldehyde to phloroglucinol. Small angle X-ray diffraction patterns revealed that the obtained carbons are highly ordered, which is in agreement with the measuring results of transmission electron microscopy at low and high resolution. Scanning electron microscopy images demonstrate that OMC-F2.0 has a hierarchical morphology. Nitrogen adsorption–desorption measurements revealed that the surface area of the OMCs (956–1801 m2 g−1) was dependent on the molar ratio of the carbon precursor constituents (formaldehyde to phloroglucinol). By varying the molar ratio of formaldehyde to phloroglucinol from 1.0 to 4.0, the mesopore diameter of the OMCs was shifted to the higher side, from 2.1 to 3.1 nm. DEHP was efficiently removed from a model water pollutant by the OMCs. OMC-F2.0 achieved the highest adsorption capacity of 364 mg g−1 for the removal of DEHP. The adsorption equilibrium data were treated with the two mathematical models of Langmuir and Freundlich, and the results revealed that decontamination was more favorable with the Langmuir model. This concludes that the removal of DEHP by OMCs depends on the surface area, and the DEHP molecules occupied the porous space of the OMCs in a monolayer manner.
1. Introduction
Water is essential for survival of life; but on the contrary it has become a major source of disease because the water stream is becoming exponentially contaminated.1 Increasing human dependency on plastic materials resulted in the use of di(2-ethylhexyl)phthalate (DEHP) as a preferred plasticizer. DEHP is a water contaminate that is highly threatening to the health of living beings, even at very low concentration, and is considered as an endocrine disruptive chemical.2 Prolonged contact with DEHP contaminated water can lead to damage of reproductive capability, memory loss and many others diseases.3 The International Agency for Research on Cancer considered DEHP as possibly carcinogenic to humans (Group 2B).4 Sources of water contamination by DEHP are discharge wastewater from manufacturing units of DEHP, tubes, tires, soft plastics, and leaching from landfill sites containing plastic materials. DEHP is increasingly being detected in water bodies.3,5,6 DEHP has a persistent nature, thus conventional treatment methods are not feasible for the removal of DEHP from contaminated water and wastewater.7,8 Therefore it is very important to remove DEHP from polluted water and wastewater by using effective treatment technology.
Adsorption is one of the potential methods for the removal of soluble and insoluble water pollutants.1,9 Activated carbon (AC) is widely used as an adsorbent for water and wastewater treatment because of its high surface area and chemically inert nature. However, AC has small and irregular micropores (<2 nm), which dramatically limits its capability for the removal of large molecules such as DEHP (Table 1). Several studies revealed that the abundant micropores of AC limit the access of big molecules to the large internal porous area.10–12 In this regards, the development of adsorbents with large and regular pore diameters has evoked great interest. Ordered mesoporous carbons (OMCs) have been extensively investigated as modern porous materials and considered as promising adsorbents due to their high surface area, large pore volume and uniform pore diameter.13 These features of OMCs allow the free movement of atoms, ions and molecules throughout the material and allow them to occupy the large available internal area.9,14
Table 1 Chemical structure and physical properties of DEHP
| Pollutant IUPAC name |
Chemical structure |
Molecular weight (g mol−1) |
Molecular width (nm) |
Molecular length (nm) |
Ref. |
| DEHP |
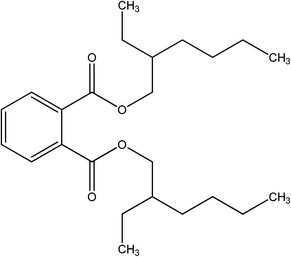 |
390.56 |
0.525 |
1.658 |
27 |
With regards to adsorption, surface area has always been the main attractant.1,15 Under this consideration, several techniques have been applied via a soft template approach to tune the surface area of OMCs.11,16 Generally, soft template based methods involve a two step assembly process of the constituents, and have multistep processing flaws, like hard templates.17 For example, Zhao’s group has always used the pre-polymerized carbon precursor ‘resol’ in a tri-constituent system,16,18–21 and many other groups also used resol as a carbon precursor.22,23 The groups of Dai and Yuan developed a single step synthesis process of OMCs, but failed to tune the surface area.24,25 Herein we attempted a one-step approach to assemble the tri-constituents via evaporation induced self assembly (EISA) for the tuning of the surface area and pore diameter of the OMCs. During the one-step assembly of the tri-constituents, the carbon precursor phloroglucinol–formaldehyde was in situ prepared during the assembly of the tri-block copolymer, inorganic precursor and carbon precursor. The surface area and pore diameter of the OMCs were tuned by varying the molar ratio of formaldehyde to phloroglucinol. The resultant OMCs were used as environmental adsorbents for the removal of DEHP from water. The molecular distribution of DEHP in the pore channels of the OMCs was studied by using two mathematical models, i.e., Langmuir and Freundlich.
2. Experimental
2.1. Chemicals
Pluronic F127 (Mw = 12600, PEO106PPO70PEO106) was purchased from Aldrich. Tetraethyl orthosilicate (TEOS) and phloroglucinol were purchased from Aladdin. Formaldehyde, ethanol, hydrochloric acid and DEHP were purchased from Sinopharm Chemical Co., Ltd. All chemicals were used as received without any further purification.
2.2. Synthesis of OMCs
An evaporation induced self assembly (EISA) method was applied to assemble the tri-constituents in a one-step process. The structure directing agent Pluronic F127 (1.6 g) was dissolved in an acidic ethanol solution, which was prepared by using 20.0 g ethanol and 1.0 g hydrochloric acid of 0.1 M. This was followed by addition of 2.0 g of the inorganic precursor tetraethyl orthosilicate (TEOS). Further, 4 mmol phloroglucinol and 1–4 mmol formaldehyde were added and the mixture was stirred for 60 min at room temperature. All three constituents were assembled in a one-step process. After 60 min of stirring, the assembled mixture was transferred into a dish and placed at room temperature for ∼5 h to evaporate the ethanol. After the evaporation of ethanol, thermal polymerization was conducted at 100 °C for 24 h in an electric oven, and a thin layer membrane was obtained. The membrane was scratched from the dish and was carbonized in a N2 flow tubular furnace at 350 °C for 3 h and 800 °C for 8 h with the following temperature program: 1 °C min−1 below 600 °C and 5 °C min−1 above 600 °C.26 After carbonization, a natural cooling process was performed. The resultant carbon–silica composites were immersed in 10% HF solution for 24 h to etch the silica, followed by water washing until a neutral pH was reached. The obtained wet carbon was placed in oven at 100 °C overnight for drying. The resultant carbon was denoted as OMC-Fx, where x stands for the molar ratio of formaldehyde to phloroglucinol.
2.3. Characterization
Nitrogen adsorption and desorption isotherms were measured at −196 °C using a Micromeritics Tristar 3000 gas adsorption analyzer. Before measurement, the samples were degassed in a vacuum at 200 °C for at least 4 h. The Brunauer–Emmett–Teller (BET) method was utilized to calculate the specific surface area (SBET) by using adsorption data in a relative pressure range from 0.05 to 0.25. Mesopore diameters and total pore volumes (Vt) were calculated using the Barret–Joyner–Halenda (BJH) model and the micropore volumes (Vmic) were calculated from t-plots. Powder small angle X-ray diffraction (SAXRD) was carried out by using an X-ray diffractometer (Bruker AXS, D8 Advance). The structural morphologies of the resultant OMCs were observed by using transmission electron microscopy (TEM, JEM-2100) and scanning electron microscopy (SEM, Hitachi, S-4800).
2.4. Adsorption studies
The batch adsorption experiments of the OMCs were performed using DEHP (the chemical structure and physical properties of DEHP are shown in Table 1) as a water pollutant. Since DEHP is poorly dissolved in water, the stock solution of DEHP was prepared by dissolving 1.0 g of DEHP in 1000 mL of ethanol. Further, different concentrations of water soluble model pollutants of DEHP were prepared from 20 to 285 mg L−1 by dissolving the stock solution in distilled water. The adsorption capacities of the OMCs were measured by varying the initial DEHP concentration. In a typical experiment, 0.010 g of adsorbent was mixed with 25 mL of the aqueous solutions with different concentrations of DEHP (20 to 285 mg L−1). The mixture of pollutant and adsorbent was agitated at 150 ± 5 rpm until an equilibrium was reached, at a temperature of 25 ± 0.1 °C. Prior to analysis, the suspension was separated using a 0.45 μm membrane filter. The concentration of the DEHP solution was determined using a calibration curve obtained using a high-performance liquid chromatography (HPLC, Agilent 1260 Infinity) system with an Agilent ZORBAX SB-C18, 5 μm, 4.6 × 250 mm column and a UV absorbance detector (G1314B) operated at 235 nm. The flow of the mobile phase was 1.0 mL min−1 of 90% acetonitrile and 10% methanol (HPLC grade). The amount of adsorbed DEHP, Qe (mg g−1), was calculated by| |
 | (1) |
where C0 and Ce are the initial and equilibrium concentrations (mg L−1), respectively, V is the volume of DEHP aqueous solution (L), and W is the weight (g) of the OMC adsorbent.
3. Results and discussion
3.1. Synthesis of OMCs
OMCs were synthesized by the one-step self assembly of tri-constituents via an EISA method. As it is shown in Fig. 1, the structure directing agent (Pluronic F127), organic precursor (phloroglucinol–formaldehyde) and inorganic precursor (TEOS) are self assembled via hydrogen bonding in acidic ethanol solution. Formaldehyde acted as a bridging agent between two phloroglucinol molecules via electrophilic substitution and elimination of H2O.28 In the competitive cooperative self-assembly of organic–organic (phloroglucinol–formaldehyde–Pluronic F127) and organic–inorganic (phloroglucinol–formaldehyde–TEOS and Pluronic F127–TEOS), the hydrogen bonding played a vital role. On the one hand, phloroglucinol has three meta hydroxyl groups (positions 1, 3, and 5), which are considered as favorable towards hydrogen bonding.26 On the other hand, Pluronic F127 has a long PEO domain, which could allow formation of the organic–organic self assembly via enhanced hydrogen bonding (as shown in Fig. 1),24 and it favours the organization of ordered nanocomposite mesostructures.16 In the self assembly process, the PPO domain of Pluronic F127 forms the core of the assembled constituents.29 The evaporation of ethanol and thermal polymerization lead to formation of a 3D hexagonal array of all three assembled constituents.16 The carbon precursor of phloroglucinol–formaldehyde was in situ prepared, instead of using pre-polymerized carbon precursor. By varying the molar ratio of formaldehyde to phloroglucinol, it was possible to tune the surface area of the OMCs. A carbon–silica composite was obtained after the carbonization of the assembled hexagonal polymeric array of tri-constituents at a higher temperature in a nitrogen flow atmosphere. The inorganic precursor (TEOS) was used to prevent shrinkage during the carbonization process16 and also for the generation of micropores in the mesopore walls of the OMCs after the etching of silica from the carbon–silica composites. The etching of silica from the carbon–silica composite formed OMCs with attractive textural features.
 |
| | Fig. 1 Schematic representation of OMC-Fx synthesis. | |
3.2. Evaluation of surface area, pore diameter and pore volume of OMCs
The surface area, pore volume and pore diameter of the OMCs were evaluated by nitrogen adsorption–desorption analysis. The N2 adsorption–desorption isotherms of the OMCs are presented in Fig. 2a. All the OMCs are assigned to type IV with a H1 hysteresis loop according to the International Union of Pure and Applied Chemistry (IUPAC) classification.30,31 A type IV curve and H1 hysteresis indicate the presence of high level and uniform mesoporosity in the OMCs.30 The steep increase at low relative pressures (P/P0) of 0.008–0.025 could be related to nitrogen molecular adsorption in the micropores of the OMCs. This initial process has been related to monolayer adsorption on each micropore wall, therefore a single layer or double layers can be formed between two walls.32 On the other hand, the well define H1 loop at high relative pressure (P/P0 0.5 to 0.85) is attributed to condensation in the mesopores of the OMCs. All hysteresis fits to H1 with little difference, for example, OMC-F2.0 has parallel steep adsorption–desorption isotherms, which could be assigned to a uniform mesopore diameter throughout the material. The uniformity of the pore diameter of OMC-F2.0 can be seen in the pore size distribution curve in Fig. 2b. By gradually increasing the molar ratio of formaldehyde to phloroglucinol, the hysteresis shifted to the higher relative pressure side, which could be attributed to an increase in the pore size, and the pore size distribution curve was in agreement with the hysteresis shift towards the higher side of Fig. 2b. The pore diameter was increased from 2.1 to 3.1, as shown in Table 2. While up to a molar ratio of 2.0, there was no major increment noticed. In our previous study, the microporosity of ordered carbon derived from tri-constituent assembly enormously depended on the removal of silica from the carbon–silica composite.13 In this work, silica also played a similar role, and its removal from the carbon–silica composites after the carbonization of the assembled tri-constituents results in the high microporosity of the OMCs. The microporosity was also affected by the molar ratio of formaldehyde to phloroglucinol, as shown in Table 2 and Fig. 2b. Beyond the optimum molar ratio (2.0), the micropore volume was decreased from 0.8 to 0.2 cm3 g−1. This could be due to the collapse of the open framework of the formaldehyde–phloroglucinol at high ratios. On the other hand, no major increment in mesoporosity was observed. However, the maximum total pore volume (2.1 cm−3 g−1) was observed in OMC-F3.0, and was a little higher (0.1 cm−3 g−1) than that of OMC-F2.0 prepared at the optimum molar ratio. Importantly, the surface area was also dependent on the molar ratio of formaldehyde to phloroglucinol in the one-step assembly process of the tri-constituents, as were other texture features. The surface area was calculated by using the BET method at relative pressures, P/P0, from 0.07 to 0.20, and in this range all the OMCs followed a straight line and the reported correlation coefficient was 1. As the molar ratio of formaldehyde to phloroglucinol was increased to higher values (form 1.0 to 2.0) the uptake volume of N2 was also increased (form 344 and 445 cm3 g−1 to 364 and 476 cm3 g−1), which contributed to the high surface area of the OMCs. However, increasing the molar ratio of formaldehyde to phloroglucinol after the optimum molar ratio of 2.0 failed to enhance the surface area. This is mainly based on bulk porosity, and it was assumed that the optimum molar ratio of formaldehyde to phloroglucinol in the one-step assembly process of the tri-constituents made open and smaller size hydrocarbon networks, which generated high porosity33 and contributed to the high surface area. Dai and Yuan used phloroglucinol–formaldehyde based precursor to synthesise OMCs24,25 but in their work, the surface area was not high enough to use as adsorbents. The above assumption is supported by the micropore area and external surface area, as shown in Table 2.
 |
| | Fig. 2 N2 adsorption–desorption isotherm of OMC-F1.0–4.0 (a) and the corresponding pore size distribution curves (b). | |
Table 2 Surface area, pore size/volume and adsorption capacities of the OMCs
| Adsorbent |
SBET (m2 g−1) |
Micropore area (m2 g−1) |
External surface area (m2 g−1) |
VTotal (cm3 g−1) |
Vmeso (cm3 g−1) |
Vmicro (cm3 g−1) |
D (nm) |
Qe (mg g−1) |
| OMC-F1.0 |
1660 |
1101 |
559 |
1.7 |
0.9 |
0.8 |
2.1 |
276 |
| OMC-F2.0 |
1801 |
1065 |
736 |
2.0 |
1.2 |
0.8 |
2.3 |
364 |
| OMC-F3.0 |
1644 |
684 |
960 |
2.1 |
1.4 |
0.7 |
2.9 |
241 |
| OMC-F4.0 |
956 |
110 |
846 |
1.5 |
1.3 |
0.2 |
3.1 |
187 |
3.3. Structure and morphology features of the OMCs
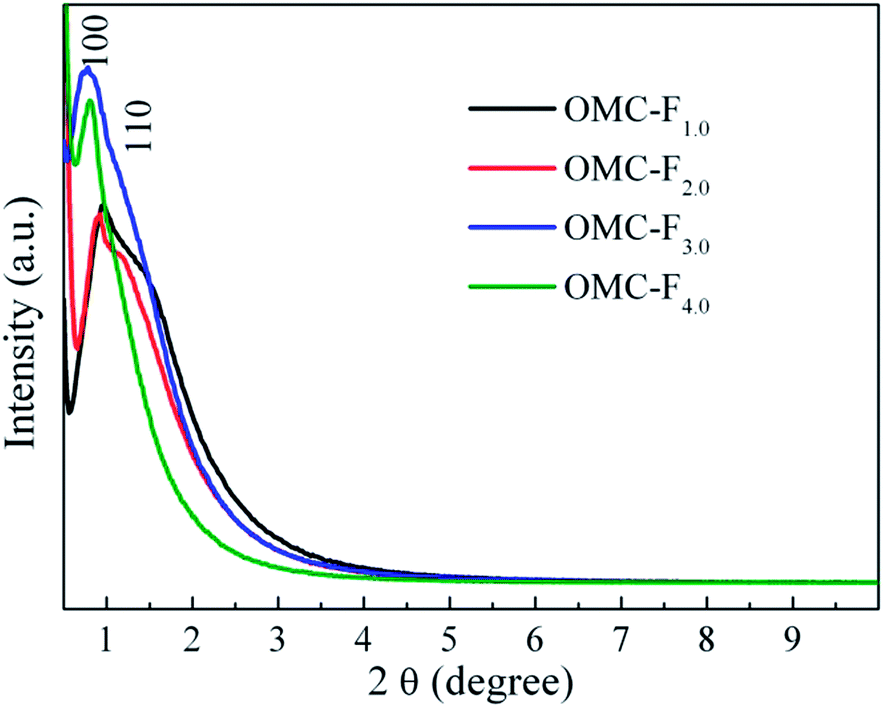
SAXRD patterns of the OMCs are presented in Fig. 3. All the OMCs had one strong and one weak peak, which can be indexed to (100) and (110) reflection, corresponding to a 2D hexagonal ordered mesostructure with space group P6mm symmetry.34 The effect of the molar ratio of formaldehyde to phloroglucinol was also seen in the order structure of the OMCs. When increasing the molar ratio from 1.0 to 2.0, the (100) and (110) indexed peaks become narrow, suggesting that the ordered hexagonal mesostructure was retained and becomes better. With further increment of the molar ratio after the optimum molar ratio (2.0), the (100) indexed peak was shifted to the left side and the visibility of (110) indexed peak became poorer. At the molar ratio of 4.0, the (100) indexed peak became sharper and narrower and the (110) indexed peak was very poorly visible. This indicated the partial collapse of mesostructure regularity,35 which might have occurred due to such a high molar ratio of formaldehyde to phloroglucinol in the one-step assembly process of the tri-constituents.
 |
| | Fig. 3 Small angle X-ray diffraction patterns of OMC-F1.0–4.0. | |
The surface morphology and order structure of OMC-F2.0 are presented in Fig. 4. Fig. 4a reveals that the large domain of OMC-F2.0 has uniform mesopore channels. Fig. 4b reveals that some of the mesopores have collapsed with each other and formed wide mesopores, which could be attributed to the etching of silica from the mesopore walls. It was noted that there were no changes observed in the structure due to the etching of silica, as it is shown in Fig. 3. Furthermore, the obtained mesopore diameter of OMC-F2.0 from the BJH method was also in correlation with the FESEM images (Fig. 4b). The order morphology of OMC-F2.0 can be seen in the TEM image (Fig. 4c). This reveals that large segments are ordered and it is in agreement with the SAXRD patterns. The irregularity in the ordered channel can be seen in the HRTEM image (Fig. 4d), indicating the etching of silica from the wall of the carbon–silica composites. This confirms that the etching process was responsible for enhancing the surface area without destroying the ordered morphology.
 |
| | Fig. 4 SEM (a and b) and TEM (c and d) images of OMC-F2.0. | |
3.4. Adsorption capacity evolution of OMCs and surface area effect on adsorptive removal of DEHP
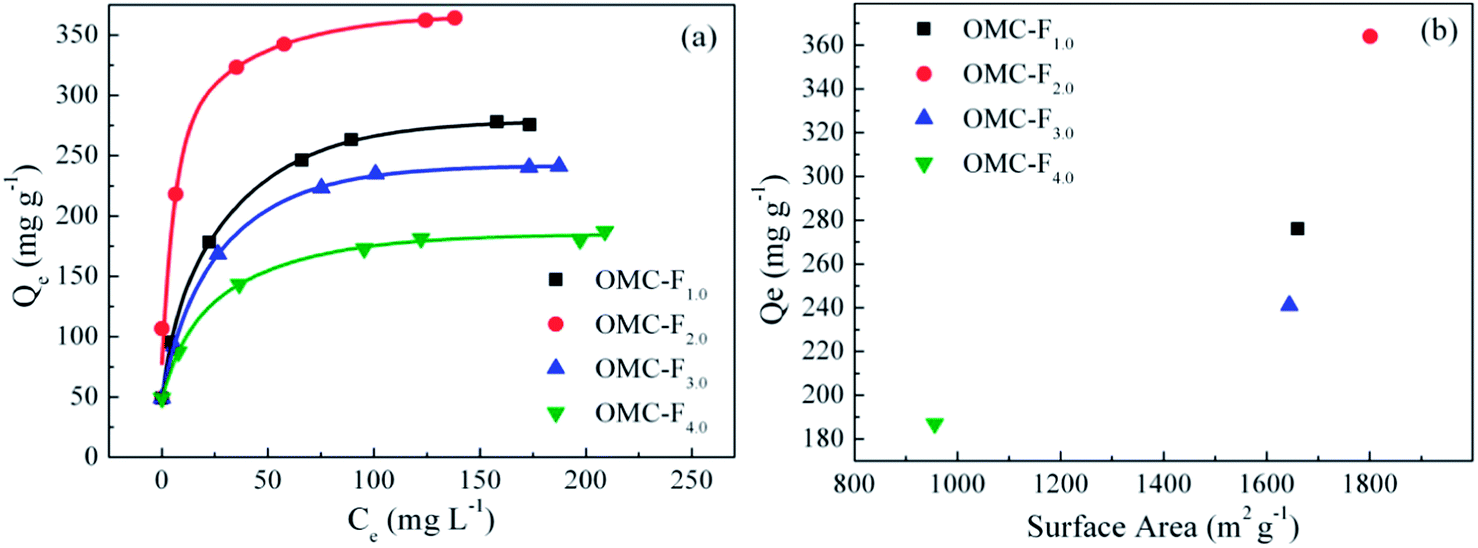
The adsorption behavior of adsorbents depends on many aspects, such as surface area, pore volume, pore diameter, size of guest adsorbate and surface chemical properties. Here we mainly looked at the effect of the surface area of the OMCs towards the adsorptive removal of a DEHP model water pollutant. Equilibrium adsorption experiments were performed to determine the adsorption capacity of the OMCs for the removal of DEHP water contaminate. Fig. 5a represents the equilibrium adsorption curves of four different adsorbents for the removal of DEHP. It can be seen that the adsorption capacity of OMC-F1.0, OMC-F2.0, OMC-F3.0 and OMC-F4.0 increased from 49 to 276, 364, 241 and 187 mg g−1, respectively, with increasing the equilibrium concentration of DEHP from 20 to 284 mg L−1, and reached saturation progressively. This could be due to the increase in the driving force of the concentration gradient, as an increase in the initial DEHP concentration could accelerate the diffusion of DEHP into the porous channels of the OMC adsorbents.31 As can be seen in Fig. 5b and Table 2, with increasing the surface area of OMC-F1.0 and OMC-F2.0 from 1660 to 1801 m2 g−1, the adsorption capacities were increased from 276 to 364 mg g−1, respectively. Similarly, with the decrease in surface area of OMC-F3.0 and OMC-F4.0 from 1644 to 956 m2 g−1, the adsorption capacities were decreased from 241 to 187 mg g−1. OMC-F2.0 had the highest surface area (1801 m2 g−1) and exhibited the highest adsorption capacity (364 mg g−1) amongst all the four OMCs. This suggests that the adsorption capacity of the OMCs for the removal of DEHP depended on surface area. Importantly, OMC-F1.0 and OMC-F3.0 do not have large surface area differences (1660 and 1644 m2 g−1, respectively) but the adsorption capacity differences were noted to be a bit higher (276 and 241 mg g−1). This could be due to the difference of the micropore area and the external surface area, as is presented in Table 2. Since the molecular size of DEHP is in the nano range, less than 2 nm, the uniform micropore area can also welcome the DEHP molecule to occupy the place in the internal area developed by the micropores. However, the micropore area difference of OMC-F1.0 and OMC-F3.0 was very high, 1101 and 684 m2 g−1, respectively, and this is not in correlation with the adsorption capacity data. On the other hand, the external surface area of OMC-F1.0 and OMC-F3.0 increased from 559 to 960 m2 g−1, respectively, and this is also not in correlation with the adsorption capacity. As can be seen in Table 2, a large part of the BET surface area of OMC-F4.0 is generated by mesopore volume and similar trends are noted in all the other three OMCs. Therefore, the adsorption capacity for the removal of DEHP from water was mainly dependent on the BET surface area of the OMCs.
 |
| | Fig. 5 (a) Adsorption capacity evaluation curve of OMC-F1.0–4.0 by varying the concentration gradient of model water pollutant DEHP and (b) a comparative plot of surface area vs adsorption capacity of OMC-F1.0–4.0. | |
3.5. Mathematical model fitting for decontamination of DEHP by OMCs
The obtained adsorption equilibrium data of the OMCs from the decontamination of DEHP water pollutant were treated with two mathematical models, Langmuir and Freundlich. The Langmuir model assumes that adsorption occurs onto the homogeneous surfaces by monolayer coverage and that there is no transmigration of the adsorbate in the plane of the surface.36 The straight line equation is as follows:| |
 | (2) |
where Ce is the equilibrium concentration of the adsorbate (mg L−1), Qe is the amount of adsorbate adsorbed per unit mass of adsorbent (mg g−1), KL is the Langmuir adsorption constant (L mg−1) and Qm is the theoretical maximum adsorption capacity (mg g−1). The essential characteristics of the Langmuir equation can be expressed in terms of a dimensionless separation factor RL,31 which is defined as:| |
 | (3) |
where KL is the Langmuir isotherm constant (L mg−1) and C0 is the initial DEHP concentration (mg L−1). The RL value indicates the type of isotherm to be either favorable (0 < RL < 1), unfavorable (RL > 1), linear (RL = 1) or irreversible (RL = 0).
The Freundlich model assumes that adsorption occurs at the heterogeneous surface and can allow the guest object to adsorb in a multilayer manner. The logarithmic straight line equation is as follows:
| |
 | (4) |
where
KF (L mg
−1) is the Freundlich constant and 1/
n is the heterogeneity factor.
KF is defined as an adsorption or distribution coefficient representing the amount of adsorbate adsorbed on an adsorbent for a unit equilibrium concentration, while 1/
n gives an indication of how favorable the adsorption process is. The 1/
n range between 0 and 1 is a measure of adsorption intensity or surface heterogeneity. If the value of 1/
n gets closer to zero, it becomes more heterogeneous. A 1/
n value below one indicates adsorption following the Langmuir model, while a value of 1/
n above one indicates cooperative adsorption.
37
The experimental data for the removal of DEHP by OMCs were well fitted by the Langmuir model (Fig. 6a). From Fig. 6b it appears that the present adsorption process does not ideally follow the Freundlich isotherm model and exhibits deviation from linearity over the entire concentration range. However, if the total concentration range is divided into several regions, good fits to the experimental data can be noted, especially in the lower concentration range. Therefore, the Freundlich equation cannot describe the adsorption process at higher concentration ranges for the removal of DEHP by OMCs. The parameters calculated from both models as above explained are presented in Table 3. Comparatively, the correlation coefficient (R2) of the Langmuir model was better than that of the Freundlich model, especially the values of 0.9987 and 0.8521 for OMC-F2.0. This indicates that adsorption occurred in a monolayer manner in the high surface area OMCs. Moreover, the calculated maximum monolayer adsorption capacity (Qm) of 370 mg g−1 from the Langmuir model was near to the experimental adsorption capacity of 364 mg g−1. This also indicates that the adsorptive removal of DEHP by the OMCs depended on the surface area. The dimensionless separation factor (RL) of the Langmuir model calculated from eqn (3) is presented in Table 3. The obtained RL values of all the OMCs for the Langmuir model were between 0.008–0.287, which indicates that adsorption is more favorable rather than irreversible. The 1/n values calculated from the Freundlich model of all the OMCs were between 0.2537–0.3376, which is below one and not very close to zero indicating a high affinity to Langmuir adsorption. Therefore, the Langmuir model is thus found to give better prediction for the adsorptive removal of DEHP at all concentrations.
 |
| | Fig. 6 Mathematical model fitting of the experimental data for the adsorptive removal of DEHP by OMC-F1.0–4.0: the Langmuir model (a) and the Freundlich model (b). | |
Table 3 Langmuir and Freundlich calculated parameters of DEHP adsorption on OMCs
| Adsorbent |
Langmuir |
Freundlich |
| Qm |
KL |
RL |
R2 |
KF |
1/n |
R2 |
| OMC-F1.0 |
286 |
0.13 |
0.027–0.287 |
0.9962 |
55 |
0.3376 |
0.9755 |
| OMC-F2.0 |
370 |
0.40 |
0.008–0.110 |
0.9987 |
83 |
0.3353 |
0.8521 |
| OMC-F3.0 |
250 |
0.13 |
0.025–0.275 |
0.9973 |
53 |
0.3119 |
0.975 |
| OMC-F4.0 |
189 |
0.14 |
0.023–0.260 |
0.9975 |
52 |
0.2537 |
0.9799 |
4. Conclusion
We report the one-step assembly of tri-constituents via an EISA method for the synthesis of high surface area OMCs. The organic precursor of phloroglucinol–formaldehyde was in situ prepared during the one-step assembly of the tri-constituents. By varying the molar ratio of formaldehyde to phloroglucinol from 1.0 to 4.0, it was possible to tune the surface area of the OMCs from 956 to 1801 m2 g−1. Small angle XRD patterns and TEM images demonstrated that the OMCs were highly ordered materials with hexagonal space symmetry of P6mm and SEM images revealed that OMC-F2.0 was a highly mesoporous material. The batch adsorption experimental studies for the decontamination of DEHP by all four OMCs of different surface area and adsorption capacity were evaluated and revealed that decontamination of DEHP depended on the surface area. The maximum adsorption capacity of 364 mg g−1 was observed at the highest surface area of 1801 m2 g−1 of OMC-F2.0. The treatment of the experimental data with two well know mathematical adsorption models, the Langmuir and Freundlich models, revealed that adsorption of DEHP occurred in a monolayer manner and followed the Langmuir adsorption isotherms in the high surface area mesoporous ordered carbons. Therefore, we believe that adsorptive decontamination of DEHP water pollutant depended on the surface area and mesoporosity and the OMCs derived by the one-step assembly method have great future prospects for the removal of various hazardous environmental pollutants.
Acknowledgements
This work was financially supported by the National Natural Science Foundation of China (21207099, 21273162), the Science and Technology Commission of Shanghai Municipality, China (11nm0501000, 12ZR1451100), the Key Subject of Shanghai Municipal Education Commission (J50102) and the Fundamental Research Funds for the Central Universities (2011KJ023). Pranav K. Tripathi acknowledges the Chinese Scholarship Council, Govt. of China and Ministry of Higher Education, Govt. of India for the research fellowship.
References
- I. Ali, Chem. Rev., 2012, 112, 5073–5091 CrossRef CAS PubMed.
- P. Roslev, K. Vorkamp, J. Aarup, K. Frederiksen and P. H. Nielsen, Water Res., 2007, 41, 969–976 CrossRef CAS PubMed.
- E. Yuwatini, N. Hata and S. Taguchi, J. Environ. Monit., 2006, 8, 191–196 RSC.
- International Agency for Research on Cancer, Overall evaluations of carcinogenicity, Lyon, 1987 Search PubMed.
- M. M. Abdel daiem, J. Rivera-Utrilla, R. Ocampo-Pérez, J. D. Méndez-Díaz and M. Sánchez-Polo, J. Environ. Manage., 2012, 109, 164–178 CrossRef CAS PubMed.
- L. Zhang, L. Dong, L. Ren, S. Shi, L. Zhou, T. Zhang and Y. Huang, J. Environ. Sci., 2012, 24, 335–342 CrossRef CAS.
- C. Dargnat, M. J. Teil, M. Chevreuil and M. Blanchard, Sci. Total Environ., 2009, 407, 1235–1244 CrossRef CAS PubMed.
- S. E. P. Agency, http://apps.sepa.org.uk/spripa/Pages/SubstanceInformation.aspx?pid=32.
- P. K. Tripathi, L. Gan, M. Liu and N. N. Rao, J. Nanosci. Nanotechnol., 2014, 14, 1823–1837 CrossRef CAS PubMed.
- C. He and X. Hu, Chem. Res., 2011, 50, 14070–14083 CAS.
- X. Zhuang, Y. Wan, C. Feng, Y. Shen and D. Zhao, Chem. Mater., 2009, 21, 706–716 CrossRef CAS.
- G. M. Walker and L. R. Weatherley, Chem. Eng. J., 2001, 83, 201–206 CrossRef CAS.
- P. K. Tripathi, M. Liu, L. Gan, J. Qian, Z. Xu, D. Zhu and N. N. Rao, J. Mater. Sci., 2013, 48, 8003–8013 CrossRef CAS.
- M. E. Davis, Nature, 2002, 417, 813–821 CrossRef CAS PubMed.
- M. Teng, J. Qiao, F. Li and P. K. Bera, Carbon, 2012, 50, 2877–2886 CrossRef CAS PubMed.
- R. Liu, Y. Shi, Y. Wan, Y. Meng, F. Zhang, D. Gu, Z. Chen, B. Tu and D. Zhao, J. Am. Chem. Soc., 2006, 128, 11652–11662 CrossRef CAS PubMed.
- Z. Li, X. Wang, C. Wang and L. Yin, RSC Adv., 2013, 3, 17097–17104 RSC.
- W. Gao, Y. Wan, Y. Dou and D. Zhao, Adv. Energy Mater., 2011, 1, 115–123 CrossRef CAS.
- Y. Zhai, Y. Dou, X. Liu, S. S. Park, C.-S. Ha and D. Zhao, Carbon, 2011, 49, 545–555 CrossRef CAS PubMed.
- Y. Huang, H. Cai, T. Yu, F. Zhang, F. Zhang, Y. Meng, D. Gu, Y. Wan, X. Sun, B. Tu and D. Zhao, Angew. Chem., Int. Ed., 2007, 46, 1089–1093 CrossRef CAS PubMed.
- J. Wang, C. Xue, Y. Lv, F. Zhang, B. Tu and D. Zhao, Carbon, 2011, 49, 4580–4588 CrossRef CAS PubMed.
- K. Hou, A. Zhang, M. Liu and X. Guo, RSC Adv., 2013, 3, 25050–25057 RSC.
- B. You, Z. Zhang, L. Zhang, J. Yang, X. Zhu and Q. Su, RSC Adv., 2012, 2, 5071–5074 RSC.
- C. Liang and S. Dai, J. Am. Chem. Soc., 2006, 128, 5316–5317 CrossRef CAS PubMed.
- L. Liu, F. Y. Wang, G. S. Shao, T. Y. Ma and Z. Y. Yuan, Carbon, 2010, 48, 2660–2664 CrossRef CAS PubMed.
- P. K. Tripathi, M. Liu, Y. Zhao, X. Ma, L. Gan, O. Noonan and C. Yu, J. Mater. Chem. A, 2014, 2, 8534–8544 CAS.
- M. Bodzek, M. Dudziak and K. Luks-Betlej, Desalination, 2004, 162, 121–128 CrossRef CAS.
- P. K. Tripathi, L. Gan, M. Liu, X. Ma, Y. Zhao, D. Zhu, Z. Xu, L. Chen and N. N. Rao, Mater. Lett., 2014, 120, 108–110 CrossRef CAS PubMed.
- L. Bromberg and E. Magner, Langmuir, 1999, 15, 6792–6798 CrossRef CAS.
- K. S. W. Sing, D. H. Everett, R. A. W. Haul, L. Moscou, R. A. Pierotti, J. Rouquerol and T. Siemieniewska, Pure Appl. Chem., 1985, 57, 603–619 CrossRef CAS.
- N. Mohammadi, H. Khani, V. K. Gupta, E. Amereh and S. Agarwal, J. Colloid Interface Sci., 2011, 362, 457–462 CrossRef CAS PubMed.
- A. Gil, Adsorption, 1998, 4, 197–206 CrossRef CAS.
- A. P. Katsoulidis and M. G. Kanatzidis, Chem. Mater., 2011, 23, 1818–1824 CrossRef CAS.
- C. C. Ting, Y. C. Pan, S. Vetrivel, D. Saikia and H. M. Kao, RSC Adv., 2012, 2, 2221–2224 RSC.
- D. D. Zhou, Y. J. Du, Y. F. Song, Y. G. Wang, C. X. Wang and Y. Y. Xia, J. Mater. Chem. A, 2013, 1, 1192–1200 CAS.
- I. Langmuir, J. Am. Chem. Soc., 1916, 38, 2221–2295 CrossRef CAS.
- K. Fytianos, E. Voudrias and E. Kokkalis, Chemosphere, 2000, 40, 3–6 CrossRef CAS.
|
| This journal is © The Royal Society of Chemistry 2014 |
Click here to see how this site uses Cookies. View our privacy policy here.