Starch-based polymer–IL composites formed by compression moulding and supercritical fluid foaming for self-supported conductive materials

R. Craveiroa, M. Martinsbc, G. B. Santosa, N. Correiaad, M. Dionísioa, S. Barreirosa, A. R. C. Duartebc, R. L. Reisbc and A. Paiva*a
aREQUIMTE/CQFB, Departamento de Química, Faculdade de Ciências e Tecnologia, Universidade Nova de Lisboa, 2829-516 Caparica, Portugal. E-mail: alexandre.paiva@fct.unl.pt; Fax: + 351 212 948 385; Tel: +351 212 949 681
b3B's Research Group-Biomaterials, Biodegradable and Biomimetic, University of Minho, Headquarters of the European Institute of Excellence on Tissue Engineering and Regenerative Medicine, Avepark 4806-909 Taipas, Guimarães, Portugal
cICVS/3B's PT Government Associated Laboratory, Braga, Guimarães, Portugal
dUnité Matériaux et Transformation (UMET), UFR de Physique, UMR CNRS 8207, BAT P5, Université Lille 1, 59655 Villeneuve d'Ascq, France

Received 18th February 2014 , Accepted 19th March 2014

First published on 27th March 2014


Abstract

In this work, blends of starch and poly-ε-caprolactone (PCL) doped with different concentrations of 1-butyl-3-methylimidazolium acetate ([BMIM]Ac) or 1-butyl-3-methylimidazolium chloride ([BMIM]Cl) were studied. The blends were characterized by mechanical analysis, infra-red spectroscopy (FTIR), differential scanning calorimetry (DSC) and dielectric relaxation spectroscopy (DRS), evaluating the IL doping effect. The samples were subjected to supercritical carbon dioxide foaming and the morphology of the structures was assessed. DSC shows a single glass transition and melting endotherm for foamed and unfoamed samples, having no effect upon IL doping, and DRS shows increased molecular mobility for blends with higher IL concentrations, and some hindrance for lower ones. The conductivity for SPCL doped with 30% [BMIM]Cl, before and after foaming, is comparable to the conductivity of the IL but exhibits more stable conductivity values, opening doors for applications as self-supported conductive materials.

Introduction

Natural polymers have attracted attention in recent years due to their high strength and stiffness combined with being carbon neutral, and their biocompatibility, renewability and sustainability. However, due to the strong inter and intra-molecular hydrogen bonds, many of these polymers are extremely difficult to dissolve in water or organic solvents. Ionic liquids (IL), known as organic salts liquid at room temperature, when mixed with polymer matrices gains advantageous properties. IL have the possibility to decrease intramolecular forces on polymeric network, increasing the flexibility and/or decreasing in melting temperature. Also, the low vapor pressure of ILs is another interesting property which enables them to remain inside the polymer composite. ILs are also reported to be suitable solvents of natural polysaccharides, namely, cellulose, lignocellulosic materials, starch, chitin and chitosan,1–3 nevertheless, most of the published work focus on the dissolution of cellulose.2,4,5 There are several studies dealing with the modification and functionalization of natural based polymers, i.e., cellulose and starch, in IL media.4–8 Further studies have been performed in order to understand the interactions between IL and polymer. Moyna confirmed the interactions between the anion of ILs and cellulose by NMR spectroscopy,9 Ning et al. also discuss the interactions between starch and ionic liquid in terms of hydrogen bonding, studied by infrared spectroscopy10 and Wu et al. found that [BMIM]Ac is a good solvent for native chitins from different origins.11 Moreover, IL may be used in applications different from dissolution agents. In fact, there are a few articles reporting the performance of some ILs as plasticizers when mixed with polymer materials.12–14 Snedden et al. have reported the changes in the porosity of cross-linked polymers with IL.15 The physical modification of natural-based polymers can be enhanced when combining ILs with supercritical fluid (SCF) technology. In SCF foaming, the polymer is exposed to carbon dioxide which plasticizes the polymer by reducing its glass transition temperature (Tg). On venting carbon dioxide by depressurization, the thermodynamic instability causes the supersaturation of CO2 dissolved in the polymer matrix, and hence nucleation occurs. The efficiency of SCF foaming depends of the solubility of carbon dioxide on the polymer.16,17 In previous work the ability to foam polymeric matrices using ILs and supercritical carbon dioxide (scCO2) was reported.18 The IL has a plasticizing effect on the biopolymer, which coupled with the increased solubility of scCO2 in IL, in comparison with the polymer, highly increases the foaming efficiency.19

Supercritical fluid foaming (SCF foaming) constitutes an alternative to conventional processes to design and processing 3D structures with high porosity, interconnectivity and uniform distribution. This technology has many advantages, for example, avoiding the use of organic solvents and high temperature and decrease saturation time compared with conventional methods. Polymeric foams are used in a wide variety of applications from the automotive to the chemical industry or biotechnology.

It is clear that ILs constitute a generation of solvents which have an enormous potential as “green” recyclable substitutes to organic solvents. Furthermore, they can improve the properties of the materials by conferring them different characteristics, such as conductivity. It has been reported the use of ionic liquids coupled with biopolymers, such as gelatin, to form efficient solid electrolytes to be used in solid-state batteries.20 Therefore by doping IL in natural-based polymers it is possible to create self-supported conductive materials. Further treatment by SCF foaming, may increase the efficiency of the final material.

In this work, we will focus our attention in imidazolium-based ionic liquids (IBILs) composed by alkylimidazolium as a cation, paired with a counter-ion (chlorine and acetate). The effect of IL doping in the mechanical, thermal and conductivity characteristics of the natural-based polymer, starch/poly-ε-caprolactone (SPCL), was studied. The effect of SCF floaming in the properties of SPCL and doped SPCL was also efficiency.

Material and methods

Materials

The polymer used in this work was a blend of corn starch with poly-ε-caprolactone (SPCL 70 wt%) in granular form was obtained from Biocycle. The ionic liquids used were 1-butyl-3-methylimidazolium acetate ([BMIM]Ac) and 1-butyl-3-methylimidazolium chloride ([BMIM]Cl) obtained from Sigma Aldrich. Carbon dioxide (99.998 mol%) was supplied by Air liquid.
Sample preparation. The SPCL–IL samples were prepared by mechanical mixing in a mortar, weighing the appropriate amounts of SPCL and each IL, to obtain the final SPCL samples with 10 and 30 wt% of ILs. The final mixtures were all homogeneous blends without phase separation. Disc shaped samples of SPCL and SPLC with 10 wt% and 30 wt% of [BMIM]Ac and [BMIM]Cl were prepared using stainless steel rings (12 × 2 mm) as a mould. The homogeneous mixture was poured in the mould and the samples were compression moulded using a Moore Hydraulic Press (UK) at 80 °C, 6 MPa for 15 min. Heating is required to facilitate material moulding. The final sample is a homogeneous composite of polymer and IL. Table 1 summarizes the materials prepared.
Table 1 Description and references of SPCL and SPCL + IL samples
Sample IL IL concentration (wt%) Designation
SPCL SPCL
[BMIM]Ac 10 SPCL10Ac
30 SPCL30Ac
[BMIM]Cl 10 SPCL10Cl
30 SPCL30Cl
SPCL + SCF foaming SPCLF
[BMIM]Ac 10 SPCL10AcF
30 SPCL30AcF
[BMIM]Cl 10 SPCL10ClF
30 SPCL30ClF


Characterization

Water content determination – Karl Fischer titration. Water content of all samples was determined by Karl Fischer titration using a 831 KF Coulometer with generator electrode without diaphragm with Hydranal Coulomat AG as the analyte. The results presented are an average of a minimum of three experiments.
Compressive and tensile mechanical analysis. Compressive and tensile mechanical analysis of the materials produced were measured using an INSTRON 5540 (Instron Int. Ltd, High Wycombe, UK) universal testing machine with a load cell of 1 kN.

Compression testing was carried out at a crosshead speed of 2 mm min−1, until a maximum reduction in sample weight of 60%. The compressive modulus is defined as the initial linear modulus on the stress/strain curves. The data presented is the result of the average of at least five measurements.

In tensile mode, the dimensions of the specimens used were 60 mm of length, 1 mm width and 3 mm of thickness. The load was placed midway between the supports with a span (L) of 30 mm. The crosshead speed was 1[thin space (1/6-em)]:[thin space (1/6-em)]5 mm min−1. For each condition the specimens were loaded until core break.

Supercritical fluid foaming. The porous matrices were prepared by supercritical fluid foaming (SCF) at 20.0 MPa and 40 °C for one hour. The samples were loaded in the high pressure vessel, heated to the desired temperature by means of an electric thin band heater (OGDEN) connected to a temperature controller. Carbon dioxide was pumped into the vessel using a high pressure piston pump (P-200A Thar Tecnologies) until the operation pressure was attained, and the pressure inside the vessel was measured with a pressure transducer. The system was closed for one hour in order to promote the foaming of the matrixes. Afterwards, the system was depressurized.
Scanning electron microscopy (SEM). Porous matrixes prepared were observed by a Leica Cambridge S360 Scanning Electron Microscope (SEM). Cross sections of the specimens were examined after fracturing in liquid nitrogen. The matrices were fixed by mutual conductive adhesive tape on aluminum stubs and covered with gold palladium using a sputter coater.
Micro-computed tomography (micro-CT). The morphological structure and the calculation of the morphometric parameters that characterize the samples were evaluated by micro-computed tomography (micro-CT) using Scanco 20 equipment (Skyscan 1702, Belgium) with penetrative X-rays of 53 keV and 189 μA, in high resolution mode with a pixel size of 11 μm and 1.5 s of exposure time. A CT analyzer (v1.5.1.5, SkyScan) was used to calculate the parameters from the 2D images of the matrices.
Statistical analysis. Statistical analysis of the data was conducted using Shapiro–Wilk test to evaluate the normality of the data sets and non-parametric tests to infer statistical significant differences. Kruskal–Wallis test was performed. The analysis was carried out using IBM SPSS Statistics version 20 software. Differences between the groups with p < 0.05 were considered to be statistically significant.
Infrared spectroscopy (FTIR-ATR). The infrared spectra of SPCL with and without IL was obtained in transmittance mode, using a Shimadzu-IR Prestige 21 spectrometer equipped with an attenuated total reflection (ATR) system in spectral region of 4400–800 cm−1 with a resolution of 4 cm−1 for 32 scans.
Differential scanning calorimetry (DSC). The study of SPCL and SPCL + IL samples by differential scanning calorimetry (DSC) was performed on a Q2000 isothermal differential calorimeter (TA Instruments, USA) in the range of −150 to 200 °C at a heating rate of 10 °C min−1. The DSC analysis of ILs and samples submitted to foaming with scCO2 was carried out in the range of −90 to 200 °C. The cycle list includes (except for the neat ILs): cooling down to −90 °C, heating to −70 °C (10 °C min−1), keeping at −70 °C for 120 min, cooling to −90 °C and final heating to 40 °C (30 °C min−1).
Dieletric relaxation spectroscopy (DRS). For the dielectric spectroscopy measurements, discs of 10 mm of diameter and 2.1 mm of thickness for each of the samples (SPCL and SPCL + IL, with and without SCF foaming) were placed between two stainless steel electrodes in a parallel plate capacitor. IL samples were placed between two gold electrodes using two 50 μm silicon spacers to maintain sample thickness. The sample cell was mounted on a cryostat BDS 1100. The temperature control was assured by a Quatro Cryosystem and performed within ±0.5 °C (all modules supplied by Novocontrol). Measurements were carried out using an Alpha-N analyzer also from Novocontrol GmbH, covering a frequency range from 10−1 Hz to 1 MHz. After a first cooling ramp from room temperature to −120 °C, isothermal spectra were collected from −120 to 5 °C in steps of 2 °C, from 5 to 50 °C in steps of 5 °C and from 50 °C to 120 °C in steps of 10 °C.

Results and discussion

Starch based blends doped with ionic liquids could be an interesting approach to generate polymeric materials with improved properties. In this work, a semi-crystalline polymer, namely, SPCL was blended in a mortar with two different ionic liquids [Bmim]Ac and [Bmim]Cl at different concentrations (10 and 30%). Posteriorly, SPCL samples blended with IL were prepared by compression moulding and characterized using different techniques. The effect of these ILs on foaming process of SPCL samples will be discussed hereafter. Upon mixing the SPCL with the IL, a homogeneous powder was obtained. Due to the small content of IL in the polymer it was adsorbed in the matrix and the mixture could be handled without any loss of IL. After the compression moulding processes the obtained disc remained homogeneous. All the IL remained in the mixture and no leak was observed during the experiments.

Water content

As it is well known, ILs are hygroscopic ([BMIM]Cl is especially hygroscopic), and starch has a hydrophilic nature. So, in order to know the moisture content in each of the samples under analysis, Karl Fischer titration was performed. The water amount present in mixtures of SPCL with [BMIM]Ac was 1.9% and with [BMIM]Cl 2.6%, respectively. The water content was controlled throughout the experiments. Karl Fischer titrations were performed before and after any experiment and the water content had a maximum variation of 1%.

Mechanical properties

The increase mobility of the polymeric chains, which is a result form the interactions of polymers and ionic liquids will have an impact on the mechanical properties of the matrices prepared. Mechanical tests were performed on compression moulded samples in compressive and tensile mode in order to quantify this effect. A summary of the mechanical properties of the materials is presented in Table 2, and results are depicted in Fig. 1.
Table 2 Summary of the mechanical properties of the materials determined in compression and tensile mode
Sample Compression Tensile
E (MPa) E (MPa) Elongation at break (%)
SPCL 6.2 ± 0.7 352 ± 44.6 5.7 ± 1.4
SPCL10Cl 2.2 ± 0.3 114 ± 35.8 5.0 ± 1.1
SPCL30Cl 0.8 ± 0.3 104 ± 26.4 4.7 ± 0.5
SPCL10Ac 5.2 ± 0.5 223 ± 29.3 8.9 ± 1.9
SPCL30Ac 2.6 ± 0.4 133 ± 53.3 8.0 ± 2.1


image file: c4ra01424c-f1.tif
Fig. 1 Effect of ionic liquid and ionic liquid concentration of the Young modulus of the matrices in (a) compressive and (b) tensile mode.

The results presented demonstrate that the Young modulus is statistically different in the case of the raw material and in the mixture with IL. This was observed for both compressive and tensile tests, which indicates that the use of ionic liquid has indeed an effect on the polymeric chain mobility. The compressive tests, showed in SPCL with 30% of [BMIM]Cl the Young modulus is lower than the other samples (Table 2). Lowest concentration of [BMIM]Ac seems not to affect the mechanical properties of the matrix prepared. The tensile tests revealed higher elongation at break for SPCL with [BMIM]Ac in comparison with both unmodified samples and those containing [Bmim]Cl, which is another indication of stronger interactions between these IL and the polymer.

The compressive and tensile tests were carried out at a different crosshead speeds to assure that crystalline morphology does not depends on the stimulus to which the samples are being submitted to; no differences in the compression modulus calculated were observed.

Supercritical fluid foaming process

The ability to foam the polymeric blends prepared by compression moulding was evaluated at 20.0 MPa and 40 °C for one hour, as these conditions have lead to successful results on our previous work.21

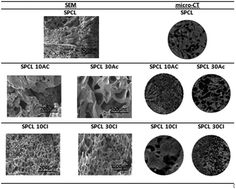
The cross-section of the samples was analyzed by scanning electron microscopy (SEM) and the morphological parameters of the samples were determined by micro-computed tomography. Fig. 2 shows the cross-section images of the structures after supercritical fluid foaming. These images showed in presence of ionic liquid there is an improvement on porosity of the blends which is dependent of ionic liquid concentration used. Moreover, the blends doped with 30% of [Bmim]Ac, seemly present a pore size higher than the blends doped with 30% of [Bmim]Cl (Table 3).


image file: c4ra01424c-f2.tif
Fig. 2 SEM and micro-CT 2D images of the cross section on polymeric foamed samples.
Table 3 Morphological characteristics of the materials foamed at 20.0 MPa and 40 °C for different soaking time (ST) conditions, obtained by Micro-CT
Sample ST Morphological parameters
  0 Porosity
SPCL 0.2 ± 0.3
SPCL10Cl 6.2 ± 3.3
SPCL30Cl 3.8 ± 1.4
SPCL10Ac 2.4 ± 0.7
SPCL30Ac 2.1 ± 0.9
SPCLF 1 14.3 ± 1.9
SPCL10ClF 20.0 ± 3.4
SPCL30ClF 38.8 ± 1.0
SPCL10AcF 32.8 ± 4.5
SPCL30AcF 40.9 ± 4.8


Micro-CT experiments

From these results it was noticeable that the foaming process increases the porosity of samples, especially when the IL is present. The polymeric blend of SPCL revealed more morphological changes concerning porosity in presence of 30% of [Bmim]Cl when processed at 200 MPa, 40 °C, during 1 hour. It seems reasonable to conclude that the presence of IL is essential for the enhancement of the foaming process.

The supercritical fluid foaming technique relies on the ability of CO2 to decrease the glass transition temperature of the polymer, plasticizing it.22,23 In the case of SPCL, without the presence of IL the foaming process produces matrices with a much lower porosity when compared with the ones doped with ionic liquid. On the other hand the presence of [BMIM]Ac and [BMIM]Cl greatly enhance the formation of a porous structure in order to 40%. A number of different works reported in the literature refer the high solubility of carbon dioxide in imidazolium-based ionic liquids.24 A previous work has demonstrated that the enhancement of the solubility of carbon dioxide in polymeric matrices doped with IL promotes the foaming of the structures.19 Therefore, we suggest that the foaming ability is in this case related with the higher or lower solubility of carbon dioxide in either [BMIM]Ac or [BMIM]Cl. In this work we evaluate the effect of the anion on the foaming ability as well as the effect of the concentration of the IL in the polymeric matrix.

FTIR-ATR

The interactions between the polymer and IL were evaluated by infra-red spectroscopy in attenuated total reflectance mode (FTIR-ATR). Table 4 indicates the characteristic peaks of starch, poly-ε-caprolactone, [BMIM]Ac and [BMIM]Cl. In Fig. 3 the collected spectra are depicted and the main peaks which demonstrate the interactions between polymer and IL are highlighted.
Table 4 FTIR characteristic peaks
Material Wavenumber (cm−1) Characteristic peak Ref.
Starch 1080; 1362–1338 C–O stretching 26
1413 O–H bending
1456 CH2 bending
925 CH2 rocking
Poly-ε-caprolactone 961 CH2 rocking 26
1366 C–O stretching
1418 O–H stretching
1471 C–H bending
[Bmim]Ac 1173 C[double bond, length as m-dash]C deformation 27
1379 C–O acetate carboxylate
1578 C[double bond, length as m-dash]O acetate carboxylate
[Bmim]Cl 1173 C[double bond, length as m-dash]C deformation  


image file: c4ra01424c-f3.tif
Fig. 3 FTIR-ATR spectra of (a) SPCL, (b) SPCL10Ac, (c) SPCL10Cl, (d) SPCL30Ac and (e) SPCL30Cl.

The analysis of the spectra reveals a characteristic peak of the C–O–H groups of starch at 1080 cm−1 when IL is present, which is valid for both ILs studied, [BMIM]Cl and [BMIM]Ac.25,10 This peak confirms the occurrence of interactions between the polymer and IL. Furthermore, is known that ionic liquids are extremely hydroscopic and can easily catch water from air, nevertheless the water content of the samples was always less than 3%. Thus, another indication of these interactions is the decrease on the intensity of this peak, when ionic liquid is present at higher concentration which is more evident in case of [Bmim]Ac.

Hanke et al. reported that each ion pair of the ionic liquid forms complex interactions with the polymer.28 In the case of imidazolium-based ILs the ions will interact, more specifically with the C–O–H groups of starch. While the anion interacts with hydrogen, the cation will interact with the oxygen atom. These interactions will decrease the ability of the polymeric matrix to form hydrogen bonds and promoting hereafter a higher mobility of the polymer chains.

DSC

In order to evaluate the thermal behavior of SPCL and SPCL doped with ILs, differential scanning calorimetry (DSC) was performed. Fig. 4 presents the thermograms obtained for the different ILs, SPCL and SPCL + IL. The analysis was preceded by a 1st cooling run (run 1 not shown) from 40 °C down to −150 °C.
image file: c4ra01424c-f4.tif
Fig. 4 DSC thermograms of SPCL and SPCL + IL, (a) melting (endothermic) and crystallization (exothermic) events can be observed, (b) scale up of the glass transition region for each sample detected after annealing at −70 °C, (c) allows a clear vision of the melting correspondent to the 2nd heating scan, (d) is a scale up of the glass transition region for the IL [BMIM]Ac before (run 2) and after (run 6) water removal promoted upon several heating scans.

The thermogram collected upon the subsequent heating run (run 2) is dominated by an endothermic transition at ca. 60 °C for all samples. The SPCL blend without ionic liquid also exhibits an endothermic peak in the same temperature region, so this peak is attributed to SPCL melting. Moreover, its temperature location is in close agreement with the value reported for poly-ε-caprolactone,29 so it should be due to the melting of the PCL constituent. Upon further cooling (run 3), all the samples crystallize around 30 °C, as seen by the emergence of a sharp exothermic peak in the thermogram. Subsequent melting occurs again around below 60 °C (Tm of 57 °C estimated in the minimum of the melting peak for SPCL, Fig. 4(c)).

The temperature of the minimum of the melting is slightly shifted towards lower temperatures for the blends containing ionic liquid, which could be related with relatively lower spherulites size and/or spherulites thickness in these materials30 or even less dense crystalline regions; this can be due to the incorporation of the ionic liquid that interferes with the chain packing, as defects.

The effect of water content is observed in Fig. 4(d). With the removal of water the Tg increases about 15 °C. This is due to the plasticizing effect of water.

Furthermore, a close inspection in the low temperature region reveals a discontinuity in the heat flux typical of the Tg, evident in both cooling and heating runs. To allow a better comparison with the results reported for samples submitted to foam, all the samples were annealed at −70 °C. The glass transition that emerges in subsequent heating run becomes enhanced due to an accentuation in the heat flux jump; Fig. 4(b) is a scale-up of the Tg observed upon heating for the annealed samples (the curves were vertically displaced for better comparison).

The simultaneous exhibition of melting and glass transition, occurring on amorphous regions, indicates that all samples are semi-crystalline.

The Tg of the SPCL matrix itself, −64.05 °C determined from the midpoint, does not seem to undergo significant changes upon IL doping. The Tg value is in good accordance with the Tg provided for PCL in literature.29 Therefore the thermal behavior of the SPCL blends is mainly determined by the presence of PCL constituent, as seen by the agreement between both Tg and Tm values of PCL and SPCL.

No other heat flux step is observed in the SPCL + IL thermograms that could be assigned to the glass transition of ILs; the glass transition in the first heating scan is located under −90 °C for [BMIM]Cl and around −74 °C for [BMIM]Ac (Fig. 4(d)). This can be interpreted as no “rich-like” regions of IL exist, at least, until the limit of the DSC detection. Moreover, for the ionic liquids, upon water removal it is obvious a shift of the glass transition to higher temperatures as evidenced in the thermograms taken before and after heating up to 200 °C for [BMIM]Ac, where a deviation of ca. 10 °C occurs (Fig. 4(d)); the effect is much more pronounced for [BMIM]Cl as will be shown by DRS in the next section. The same effect is not observed for the glass transition detected at temperatures around −60 °C in the SPCL + IL samples, confirming that it is associated with the PCL constituent rather than to the ionic liquid.

Although FTIR-ATR analysis confirms IL-matrix interactions, those are not evident from DSC analysis. In fact, the infrared spectra reveals that the C–OH vibration is altered in the presence of IL showing that the IL anion interacts with the C–OH moiety of the starch component. Since DSC for the SPCL + IL composite is blind to starch, and the only transformations are originated by PCL, it is not surprising that no changes in the thermogram occur. Moreover, the invariance in the glass transition detected in both SPCL and SPCL + IL blends, can be interpreted as the IL presence not interfering with the cooperative mechanism that is in the origin of the Tg of SPCL. In spite of some decrease in melting temperature of the SPCL + IL, meaning that crystallization is slightly affected by the incorporation of the IL, after thermal treatment by heating at 200 °C, neither crystallization nor further melting appear to be influenced by the presence of IL.

DSC thermograms of samples submitted to SCF foaming (Fig. 5) were also collected under a similar thermal treatment, the only difference being the lowest temperature attained upon cooling (−90 °C for foamed samples instead of −150 °C).


image file: c4ra01424c-f5.tif
Fig. 5 DSC thermograms of samples SPCLF and SPCL + ILF; (a) melting and crystallization can be observed, (b) allows a clear view of the Tg for each sample detected after physical ageing at −700 °C, (c) allows the observation of melting after subsequent heating run (run 4).

As before, the thermograms are dominated by the melting and crystallization peaks. The endothermic broad band emerging at ca. 100–120 °C is related to the evaporation of residual water, being more evident for SPCL10AcF and SPCL30ClF.

A close inspection of the low temperature region seems to reveal the typical discontinuity of the heat flux associated with the glass transition, although ill-defined. To enhance this transition, samples that were submitted to SCF foaming were submitted to annealing at −70 °C, after which a temperature scan was carried out. The obtained thermograms are included in Fig. 5(b) confirming the presence of the Tg at ca. −63 °C. As observed previously for the samples not submitted to foaming, the glass transition region does not undergo significant changes between the different materials.

A detailed analysis of the melting region by analyzing Tm taken at the mid-point, reveals a slight shift of the minimum towards lower temperatures for SPCL10AcF and SPCL30ClF; the higher Tm occurs near 62.2 °C (SPCLF) while the lower at 58.2 °C SPCL30ClF. These alterations were already observed for the unfoamed materials. After the first heating scan (run 2) all the samples undergo crystallization near 30 °C (run 3). Both crystallization and further melting occur at temperatures very near to which was observed previously for the unfoamed materials. Therefore, this seems to be caused by the presence of the ionic liquid rather than by foaming.

Dielectric studies (DRS)

Dielectric relaxation spectroscopy (DRS) was used to probe both molecular mobility and conductivity. DRS probes orientational and interfacial polarization and charge transport as the response of a sample to a time dependent electric field.31 The use of DRS for the study of polysaccharides and IL has been employed by other authors, and there are several studies concerning dielectric properties of starch and ionic liquids32–35 and on the impact of the incorporation of plasticizing agents in conductivity in electrolyte polymers.36

The initial water content of the samples was measured and with values between 1.9% and 3.0%. Naturally that it is expected that the water present in the samples will have a slight influence in the conductivity measurements. Nevertheless the influence of water content in conductivity is expected to be relatively constant in all samples.

The property under measurement is the complex dielectric function,

 
ε*(ω) = ε′(ω) − ′′(ω) (1)
whose real part is related with energy stored by the system, while the imaginary part accounts for the energy dissipated inside the material; ω = 2πf is the angular frequency and f refers to the frequency of the outer electrical field. Alternative representations of the dielectric response are the complex conductivity,37
 
σ*(ω) = iωε0ε*(ω) (2)
and the complex dielectric modulus,
 
M*(ω) = 1/ε*(ω) (3)

Since the propagation of mobile charge carriers also contribute to the complex function,37 it can be advantageous to analyze the dielectric response through the complex conductivity function,

 
σ*(ω) = σ′(ω) + ′′(ω) (4)

To get an insight on dipolar polarization due to reorientational motions of permanent dipoles, the imaginary part of the complex electric modulus, M*(ω)

 
M*(ω) = M′(ω) + iM′′(ω) (5)
will be analyzed being related with the real and imaginary components of the complex dielectric permittivity, by the following expression,
 
image file: c4ra01424c-t1.tif(6)

Spectra of real conductivity, σ′(f) of SPCL and SPCL + IL were collected in order to evaluate the effect of the IL presence. Fig. 6 shows the conductivity isotherms at −80 °C and for 0 °C respectively.


image file: c4ra01424c-f6.tif
Fig. 6 Conductivity spectra of SPCL and SPCL with [BMIM][Ac] and [BMIM][Cl] in different percentages. The isothermal curves refer to data collected at (a) −80 °C, (b) 0 °C, (c) −80 °C after SCF foaming and (d) 0 °C after SCF foaming. Spectra were collected in presence of residual water.

As seen previously by DSC, SPCL is a semi-crystalline material and, at −80 °C, it is below its glass transition temperature. This means that at this temperature no appreciable cooperative motions of the matrix exist, which may explain why no significant conductivity (σ′) is noticed for SPCL with no exhibition of a plateau due to dc conductivity. The same is observed for SPCL + [BMIM]Ac samples since at this temperature, [BMIM]Ac is below its Tg. By other side, at −80 °C, [BMIM]Cl is above its Tg and the conductivity in SPCL10Cl and SPCL30Cl is higher, even showing a conductivity plateau meaning that dc conductivity takes place. Therefore, in the [BMIM]Cl doped samples, the conductivity is dominated by the IL response increasing with its concentration. This means that the charge transport mechanism, in which conductivity is based, is not correlated or even enabled by the segmental motion of the polymer matrix itself.

At 0 °C, both SPCL matrix and ILs are above their glass transitions (confirmed by DSC) which reflects in a conductivity enhancement also in samples doped with [BMIM]Ac, nevertheless, it is clear that [BMIM]Cl has a more significant effect in the material conductivity. According to the work of Ramesh et al.38 the doping of IL in polymer matrices weakens the interactions within the starch polymer chains via H-bonds; this was confirmed in the present work for SPCL + IL by FTIR-ATR analysis. The increase in conductivity is a consequence of the higher polymer flexibility and enhanced segmental mobility, which facilitates ionic transport, providing more conductive pathways.38

It is interesting to note that, at 0 °C, the conductivity of SPCL30Cl is very close to the pure ionic liquids with the advantage of exhibiting more stable conductivity values overall the tested frequency range; the measurements for the ionic liquids are repeatedly affected by electrical interferences. The SPCL matrix, although not contributing significantly to conductivity, acts as a solid support to the ionic liquid allowing obtaining a self-sustained conductive material. This opens doors to different applications of the produced materials.

An identical behavior is observed in the isothermal curves collected by DRS experiments, at both −80 °C and 0 °C, for the samples that were submitted to SCF foaming (Fig. 6(c) and (d)). This can be taken as a further evidence of the interconnected structure of the porous matrix, otherwise the conductivity pathways would be interrupted disabling the dc conductivity and decreasing the measured σ′.

An alternative way to compare the dielectric response of the different materials is through the modulus which temperature dependence of the imaginary part (M′′(T)) for all the tested samples is presented in Fig. 7(a) at 1 kHz; data taken from the dielectric spectra measured isothermally.


image file: c4ra01424c-f7.tif
Fig. 7 Representation of the imaginary part of the modulus: (a) taken at 1 kHz for the different SPCL + IL samples including neat ILs (in logarithmic scale to allow comparison since it varies several orders of magnitude between the different materials) and, (b) SPCL before and after SCF foaming at 1 kHz, (c) depicts the temperature dependence for the neat ILs at a lower frequency (100 Hz) before and after heating up to 120 °C to evaluate the effect of water removal.

It is important to note that the dielectric response of a material to an alternating electrical field has contributions from dipolar relaxation, i.e., reorientational polarization of permanent dipoles and from conductivity, besides interfacial polarization. The study of the dielectric response of a material trough the dielectric modulus is advantageous since it suppresses the electrode polarization effect, due to the blocking of charges in the electrode–dielectric sample interface, and facilitates the identification of dipolar relaxation phenomenon.37 The dipolar contribution emerges at the lower temperatures while conductivity is felt at the higher temperatures (corresponding to the lowest frequencies in the isothermal dielectric spectra).

In Fig. 7(a) the peaks that are observed in the temperature region from −100 to −25 °C are due to dipolar relaxation from which it is possible to infer about the molecular mobility that originates the dynamical glass transition, going further on the analysis relative to DSC. In this plot, subtle differences arise which were not seen in the calorimetric measurements. First, the maximum of the M′′(T) peak obtained for [BMIM]Cl is located at the lowest temperatures. In Fig. 7(c) the modulus is plotted at a lower frequency, 100 Hz, in which the maximum emerges around −100 °C confirming its low Tg and the reason why it was not detected by calorimetry in runs starting at −90 °C; with the water removal (heating up to 120 °C) it significantly shifts to higher temperatures up to ca. −70 °C, undergoing a stronger effect upon drying relatively to [BMIM]Ac, included also in Fig. 7(c), and as seen previously by calorimetry.

Secondly, it is possible to observe that, in the first heating run, the blends with 10% of IL either [BMIM]Cl or [BMIM]Ac, are slightly shifted to higher temperatures relatively to the SPCL polymer blend and to the neat IL, indicating some mobility hindrance. This can be caused by the interaction of the ionic liquid with the starch moiety which slows down the dipoles reorientational motions. On the other hand, the composites containing 30% of IL are slightly shifted to lower temperatures denoting some molecular mobility enhancement. This can be attributed to water that interacts mainly with the IL; the plasticizing effect of water in the glass transition of the ionic liquids was calorimetrically demonstrated for [BMIM]Ac (Fig. 4(d)) and now for [BMIM]Cl by a clear shift of Tg to higher temperatures upon water removal. Therefore, some care must be taken on evaluating the effect of addition/blending ionic liquids with polymers in the case of high IL hydrophilicity.

At the highest temperatures, the dielectric response is mainly determined by the conductivity contribution. This is shown in Fig. 7(b) for SPCL and foamed SPCL where the dielectric response increases significantly on approaching melting, clear seen as a discontinuity in M′′(T) ca. 60 °C; the region of the glass transition emerges as a well-defined peak for both materials. It is possible to observe that, besides intensity, caused by thickness differences between the tested samples (the foamed ones being thicker), the overall dielectric behavior is essentially the same for both materials as the calorimetric measurements have previously shown as well.

Conclusions

The approach presented in this works allows the creation of materials that have applications as self-supported conductive materials, based on natural polymers. The presence of an ionic liquid blended with SPCL combining with foaming process has proven to be essential in order to obtain structures with good morphological characteristics.

FTIR-ATR spectroscopy has shown some molecular interactions between the ionic liquids used and the polymeric blend. Mechanical properties have also demonstrated the same effect.

The calorimetric analysis of the SPCL blends doped with ionic liquids revealed a glass transition and melting at temperatures, respectively Tg and Tm, close to the homologous transitions in poly-ε-caprolactone (PCL), with no phase transformation assigned to the starch constituent. In the SPCL + IL samples, melting occurs at slightly lower temperatures relative to SPCL which could indicate that the incorporated ionic liquid impairs a so closely packing in the crystalline PCL phase. The glass transition undergoes no effect upon IL addition. This goes against to what is described as a usual effect in literature, where the addition of low molecular weight compounds, including ILs, could lower the glass transition temperature due to a plasticizer effect. A possible reason for this behavior could be due to a greater influence of the IL over the starch constituent to which DSC is insensitive. The interaction of the IL mainly with starch was confirmed by FTIR analysis. Plasticization was instead proved for water over the ILs, with a stronger effect for [BMIM]Cl.

The dielectric measurements revealed some subtle differences in the mobility of the different materials. It confirmed the lower Tg for [BMIM]Cl compared with all tested materials, and a mobility enhancement relatively to SPCL blend for SPCL doped with the higher IL concentrations. Oppositely, for blends mixed with the lower IL contents, some hindrance in the mobility was observed probably due to the interaction of ILs dipolar moieties with starch.

In what concerns the conductivity, an appropriate comparison should take in account the glass transition of the IL additive and the water content. It was observed that conductivity of SPCL + IL depends mostly on the IL without being enabled by the segmental motion of the matrix. For SPCL doped with 30% [BMIM]Cl the conductivity was comparable to the one of the neat IL, without being affected by the IL electrical interferences upon measuring, which opens up novel potential applications as self-supported conductive system.

Scanning electron microscopy (SEM) and micro-computerized tomography (micro-CT) revealed some morphological changes, upon SCF foaming, concerning porosity. In presence of [BMIM]Cl, the morphological characteristics seem to improve and materials with a higher porosity were obtained. It is postulated, hereafter that, the increase in porosity in the presence of IL may be due to the high solubility of carbon dioxide in the IL which favors the foaming process.

The increase in porosity after the foaming process increases the interconnectivity of the porous matrix thus allowing for a continuous conductivity pathway.

Acknowledgements

The research leading to these results has received funding from Fundação da Ciência e Tecnologia (FCT) through the project ENIGMA - PTDC/EQU-EPR/121491/2010 and from the European Union's Seventh Framework Programme (FP7/2007-2013) under grant agreement no. REGPOT-CT2012-316331-POLARIS, PEst-C/EQB/LA0006/2013 and FEDER Marta Martins Rita Craveiro and Alexandre Paiva are grateful for financial support from Fundação da Ciência e Tecnologia (FCT) through the grant PTDC/EQUEPR/12191/2010/ENIGMA, BIM/PTDC/EQU-EPR/121491/2010/ENIGMA and SFRH/BD/47088/2008.

References

  1. N. Winterton, J. Mater. Chem., 2006, 16, 4281 RSC.
  2. R. P. Swatloski, S. K. Spear, J. D. Holbrey and R. D. Rogers, J. Am. Chem. Soc., 2002, 124, 4974–4975 CrossRef CAS PubMed.
  3. M. Zavrel, D. Bross, M. Funke, J. Büchs and A. C. Spiess, Bioresour. Technol., 2009, 100, 2580–2587 CrossRef CAS PubMed.
  4. L. Feng and Z. Chen, J. Mol. Liq., 2008, 142, 1–5 CrossRef PubMed.
  5. Y. Cao, J. Wu, J. Zhang, H. Li, Y. Zhang and J. He, Chem. Eng. J., 2009, 147, 13–21 CrossRef CAS PubMed.
  6. T. Heinze, K. Schwikal and S. Barthel, Macromol. Biosci., 2005, 5, 520–525 CrossRef CAS PubMed.
  7. H. Xie, A. King, I. Kilpelainen, M. Granstrom and D. S. Argyropoulos, Biomacromolecules, 2007, 8, 3740–3748 CrossRef CAS PubMed.
  8. S. Barthel and T. Heinze, Green Chem., 2006, 8, 301 RSC.
  9. G. Remsing, R. C. , Swatloski, R. P. Rogers and R. D. , Moyna, Chem. Commun., 2006, 1271–1273 RSC.
  10. H. Ning, W. Xingxiang, Z. Haihui and L. Benqiao, Carbohydr. Polym., 2009, 76, 482–484 CrossRef PubMed.
  11. K. Wu, Y. Sasaki, T. Irie and S. Sakurai, Polymer, 2008, 49, 2321–2327 CrossRef PubMed.
  12. M. P. Scott, C. S. Brazel, M. G. Benton, J. W. Mays, J. D. Holbrey and R. D. Rogers, Chem. Commun., 2002, 1370–1371 RSC.
  13. M. P. Scott, M. Rahman and C. S. Brazel, Eur. Polym. J., 2003, 39, 1947–1953 CrossRef CAS.
  14. S. a. Chesnokov, M. Y. Zakharina, A. S. Shaplov, E. I. Lozinskaya, I. a. Malyshkina, G. a. Abakumov, F. Vidal and Y. S. Vygodskii, J. Polym. Sci., Part A: Polym. Chem., 2010, 48, 2388–2409 CrossRef CAS PubMed.
  15. P. Snedden, A. I. Cooper, K. Scott and N. Winterton, Macromolecules, 2003, 36, 4549–4556 CrossRef CAS.
  16. R. L. Duarte, A. R. C. , Mano and J. F. , Reis, Int. Mater. Rev., 2009, 54, 214–222 CrossRef PubMed.
  17. A. R. C. Duarte, J. F. Mano and R. L. Reis, J. Bioact. Compat. Polym., 2009, 24, 385–400 CrossRef CAS PubMed.
  18. A. R. C. Duarte, S. S. Silva, J. F. Mano and R. L. Reis, Green Chem., 2012, 14, 1949 RSC.
  19. M. Martins, R. Craveiro, A. Paiva, A. R. C. Duarte and R. L. Reis, Chem. Eng. J., 2014, 241, 122–130 CrossRef CAS PubMed.
  20. P. Vidinha, N. M. T. Lourenço, C. Pinheiro, A. R. Brás, T. Carvalho, T. Santos-Silva, A. Mukhopadhyay, M. J. Romão, J. Parola, M. Dionisio, J. M. S. Cabral, C. a M. Afonso and S. Barreiros, Chem. Commun., 2008, 5842–5844 RSC.
  21. K. Wilpiszewska and T. Spychaj, Carbohydr. Polym., 2011, 86, 424–428 CrossRef CAS PubMed.
  22. L. J. M. Jacobs, M. F. Kemmere and J. T. F. Keurentjes, Green Chem., 2008, 10, 731 RSC.
  23. Ž. Knez, E. Markočič, Z. Novak and M. K. Hrnčič, Chem. Ing. Tech., 2011, 1371–1380 Search PubMed.
  24. C. Cadena, J. L. Anthony, J. K. Shah, T. I. Morrow, J. F. Brennecke and E. J. Maginn, J. Am. Chem. Soc., 2004, 126, 5300–5308 CrossRef CAS PubMed.
  25. A. Sankri, A. Arhaliass, I. Dez, A. C. Gaumont, Y. Grohens, D. Lourdin, I. Pillin, A. Rolland-Sabaté and E. Leroy, Carbohydr. Polym., 2010, 82, 256–263 CrossRef CAS PubMed.
  26. V. Chiono, G. Vozzi, M. D'Acunto, S. Brinzi, C. Domenici, F. Vozzi, A. Ahluwalia, N. Barbani, P. Giusti and G. Ciardelli, Mater. Sci. Eng., C, 2009, 29, 2174–2187 CrossRef CAS PubMed.
  27. M. B. Shiflett, D. J. Kasprzak, C. P. Junk and A. Yokozeki, J. Chem. Thermodyn., 2008, 40, 25–31 CrossRef CAS PubMed.
  28. C. G. Hanke, N. a. Atamas and R. M. Lynden-Bell, Green Chem., 2002, 4, 107–111 RSC.
  29. J. F. Mano, D. Koniarova and R. L. Reis, J. Mater. Sci.: Mater. Med., 2003, 14, 127–135 CrossRef CAS.
  30. Q. Jiang, C. C. Yang and J. C. Li, Macromol. Theory Simul., 2003, 12, 57–60 CrossRef CAS PubMed.
  31. F. Kremer and A. Schönals, Broadband Dielectric Spectroscopy, Berlin, 2003 Search PubMed.
  32. B. Carvalho, T. Augusto, V. Brás, A. R. Lourenço, N. M. T. Afonso, C. A. M. Barreiros, S. Correia, N. T. Vidinha, P. Cabrita, E. J. Dias, C. J. Dionísio and M. Roling, J. Phys. Chem. B, 2012, 116, 2664–2676 CrossRef PubMed.
  33. D. Meiûner, J. Einfeldt and A. Kwasniewski, J. Non-Cryst. Solids, 2000, 275, 199–209 CrossRef.
  34. M. F. Butler and R. E. Cameron, Polymer, 2000, 41, 2249–2263 CrossRef CAS.
  35. È. Einfeldt, D. Meiûner, A. Kwasniewski and L. Einfeldt, Polymer, 2001, 42, 7049–7062 CrossRef.
  36. Y. Wang, M. a. Rodriguez-Perez, R. L. Reis and J. F. Mano, Macromol. Mater. Eng., 2005, 290, 792–801 CrossRef CAS PubMed.
  37. F. Kremer and A. Schönals, in Broadband Dielectric Spectrosocpy, Springer Verlag, Berlin, 2003 Search PubMed.
  38. S. Ramesh, C.-W. Liew and a. K. Arof, J. Non-Cryst. Solids, 2011, 357, 3654–3660 CrossRef CAS PubMed.

This journal is © The Royal Society of Chemistry 2014
Click here to see how this site uses Cookies. View our privacy policy here.