Green synthesis of copper nanoparticles and conducting nanobiocomposites using plant and animal sources

K. Cheirmadurai, Soma Biswas, R. Murali and P. Thanikaivelan*
Advanced Materials Laboratory, Centre for Leather Apparel & Accessories Development, Central Leather Research Institute (Council of Scientific and Industrial Research), Adyar, Chennai 600020, India. E-mail: thanik8@yahoo.com

Received 18th February 2014 , Accepted 14th April 2014

First published on 16th April 2014


Abstract

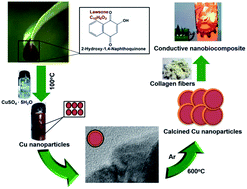
We report large-scale biosynthesis of copper nanoparticles using an extract of henna leaves as reductant. Due to the substantial electrical conductivity of the calcined copper nanoparticles, we used them to prepare conductive nanobiocomposites utilizing collagen waste. We demonstrate that the nanobiocomposites, when inserted between batteries, illuminate a light emitting diode lamp.
Metal nanoparticles have gained more attention in recent years due to their potential for applications in many fields.1–4 Copper based nanoparticles are gaining importance due to their applications in catalysis, printed electronics, sensors, etc.5–7 Synthesis of copper nanoparticles8–10 based on the chemical precipitation method employs harsh reducing agents and organic solvents.11–13 The presence of these harmful chemicals on the surface of nanoparticles increases the toxicity issue while the use and disposal of toxic solvents triggers environmental issues. To overcome these problems, environmental friendly and green synthesis of nanoparticles has become popular in recent years. Many green synthetic procedures have been reported for silver and gold nanoparticles. However, only a few reports are available for the green synthesis of copper nanoparticles wherein ascorbic acid, plant gums, plant extracts and microorganisms were used as reducing agents.14–17

Extracts of leaves of henna (Lawsonia inermis) have been used in cosmetics and medicine for a long time in many parts of the world. The main active compound in henna leaves is lawsone (2-hydroxy-1,4-naphthoquinone, C10H6O3), also known as hennotannic acid, a reddish-orange dye responsible for its color. Besides lawsone, other constituents present in henna leaves are gallic acid, glucose, mannitol, fats, resin, mucilage and traces of alkaloids.18 Kasthuri et al. reported the synthesis of gold nanotriangle and quasi-spherical silver nanoparticles using purified apiin compound extracted from henna leaves.19 A simple and eco-friendly protocol was reported to synthesize silver nanoparticles for lousicidal activity using henna leaf extract as reducing and capping agent.20 Herein we report the green synthesis of copper nanoparticles using aqueous henna leaf extract. We also demonstrated that the prepared copper nanoparticles can be utilized for making collagen based nanobiocomposite with significant electrical conductivity for electronic device applications. The synthesis procedure followed by us is very simple and environmental friendly. The synthesized nanoparticles and prepared nanobiocomposite films were characterized by appropriate techniques.

The UV-visible spectrum of the henna leaf extract (Fig. 1a) shows maximum absorption at 265 nm, which confirms the presence of active compound, lawsone.21 The inset shows the reddish color of the henna leaf extract solution. The as-synthesized copper nanoparticles show absorption maximum at 570 nm (Fig. 1b), whereas the source material (CuSO4·5H2O) show absorption maximum at 810 nm (Fig. S1). The change of color from blue to reddish brown, as shown in insets, indicates the formation of copper nanoparticles. It has been reported that metallic copper nanoparticles that are surrounded with copper oxide shells are characterized by a band centered at 570 nm corresponding to surface plasmon resonance with a residual absorption band at 800 nm.5 Here we have not observed any band around 800 nm, which may be due to the fact that the oxide (CuO and Cu2O) shell is very thin.5 This result was later verified by X-ray diffraction (XRD) analysis, where we observed weak diffraction peaks for oxides in as-synthesized copper nanoparticles. The formation of copper nanoparticles occurred at pH 11.0 and not at lower pH levels as seen in Fig. 1c. This may be due to the fact that hydroxyl ions induce reduction by enhancing the redox potential and overall reaction kinetics.22 It is known that the calcination of as-synthesized copper nanoparticles at high temperature is expected to increase its electrical conductivity. This may be due to the formation of connected nanoparticle structures as well as reduction in the oxide layers, which can cumulatively enhance electron mobility.23 When the as-synthesized copper nanoparticles were calcined at higher temperatures in inert atmosphere, the band due to plasmon resonance at 570 nm has disappeared and a new band at 285 nm appeared probably due to smaller nanoparticles with trace oxide layers (Fig. 1d, see individual spectrum in Fig. S2, ESI for better clarity). The band centered at 285 nm may be due to the transition of electrons from the inner shell of the copper to the outermost shell.24 The Fourier transformed infrared (FT-IR) spectroscopy spectrum of henna leaf extracts (Fig. S3a) shows a broad band at 3394 cm−1 corresponding to phenolic O–H stretching and a sharp band at 1625 cm−1 due to the C[double bond, length as m-dash]O stretching frequency, which confirms the presence of lawsone.25 In the FT-IR spectrum of as-synthesized copper nanoparticles (Fig. S3b), the C[double bond, length as m-dash]O stretching band originally present at 1625 cm−1 for lawsone is shifted to 1618 cm−1. It could be due to the possible interaction between copper ions and henna leaf extract during the bioreduction. The presence of characteristic lattice vibration of Cu2O is noted at 625 cm−1.26 These results show that the as-synthesized copper nanoparticles are coated with lawsone and oxide layers. FT-IR spectrum of copper nanoparticles calcined at 600 °C (Fig. S4c) shows only the band corresponding to the Cu2O layers in copper nanoparticles while other peaks have disappeared indicating the loss of lawsone at high temperature treatment (Fig. S4a and b).


image file: c4ra01414f-f1.tif
Fig. 1 UV-visible spectrum of (a) henna leaf extract; inset shows aqueous extract of henna leaves, (b) Cu nanoparticles synthesized using henna leaf extract as reducing agent; inset shows reddish brown color solution containing synthesized Cu nanoparticles, (c) Cu nanoparticles showing the effect of pH during the synthesis, (d) Cu nanoparticles calcined at 400, 500 and 600 °C.

XRD analysis of as-synthesized copper nanoparticles (Fig. 2a) show major diffraction peaks at 43.39, 50.5 and 74.1°, which can be assigned to (111), (200) and (220) planes of fcc structure of pure Cu (JCPDS no. 71-4610). In addition, there are few other diffraction peaks of CuO and Cu2O overlapping with the Cu phases confirming the presence of oxide shell around the as-synthesized copper nanoparticles. After calcination (Fig. 2b), the intensity of diffraction peaks of copper nanoparticles increased significantly while that of oxides reduced appreciably. The d-spacing values of the derived diffraction planes (d−111CuO = 0.2533 nm, d111Cu2O = 0.2458 nm, d200CuO = 0.2337 nm, d111Cu = 0.2085 nm, d200Cu = 0.1806 nm, d220Cu2O = 0.1509 nm, d220Cu = 0.1277 nm) are in agreement with the values of CuO (JCPDS no. 48-1548), Cu2O (JCPDS no. 77-0199) and Cu (JCPDS no. 71-4610) structures.27,28 The incomplete removal of oxide layers in the calcined copper nanoparticles is due to the fact that copper oxides are thermodynamically stable.28 The crystallite size of copper nanoparticles was calculated from (111) plane of fcc copper using Scherrer's equation. The crystallite size of as-synthesized and calcined copper nanoparticles is calculated to be around 27 and 45 nm, respectively.


image file: c4ra01414f-f2.tif
Fig. 2 XRD patterns of (a) as-synthesized Cu nanoparticles and (b) calcined Cu nanoparticles at 600 °C.

The high resolution scanning electron microscopic (HRSEM) image of as-synthesized copper nanoparticles (Fig. 3a) revealed the formation of slightly agglomerated spherical nanoparticles. The energy dispersive X-ray analysis (EDAX) of copper nanoparticles (Fig. S5) shows the presence of very low weight percentage of oxygen along with major proportion of copper, confirming the presence of oxide shells around Cu. The HRSEM image of the calcined copper nanoparticles (Fig. 3b) shows the presence of spherical Cu nanoparticles with connected structures. The size of the bulk of the as-synthesized copper nanoparticles appeared to be higher (83 nm) in comparison to the calcined (43 nm) particles (see particle size distribution in Fig. S6, ESI) in contrast to the XRD results. This could be due to the particle agglomeration, as no capping agent was used, leading to a higher particle size for the as-synthesized copper nanoparticles in the HRSEM analysis. The high resolution transmission electron microscopic (HRTEM) image of as-synthesized copper nanoparticles (Fig. 3c) shows that the synthesized copper nanoparticles are agglomerated and spherical in shape. The d spacing of inner lattice fringes (Fig. 3d) in copper nanoparticles is estimated as 0.21 nm, which is in agreement with the value of (111) plane of fcc Cu as derived from XRD data. The estimated d spacing of lattice fringes at the edge of the Cu nanoparticle is 0.24 nm, which is comparable to the d value of (111) plane of fcc Cu2O. This result confirms that the surface of as-synthesized copper nanoparticle is oxidized upon exposure to air.


image file: c4ra01414f-f3.tif
Fig. 3 HRSEM images of (a) as-synthesized Cu nanoparticles, (b) calcined Cu nanoparticles at 600 °C; HRTEM images of as-synthesized Cu nanoparticles at (c) lower magnification and (d) higher magnification showing the particle agglomeration and lattice fringes, respectively.

Although metallic copper is known to have good electrical conductivity, copper nanoparticles often possess low conductivity primarily due to the presence of oxide layers. Hence, copper nanoparticles are generally calcined at high temperature to enhance the electrical conductivity. As can be seen in Fig. 4a, the electrical conductivity of calcined copper nanoparticles increases with the increase in calcination temperature.


image file: c4ra01414f-f4.tif
Fig. 4 (a) Conductivity of Cu nanoparticles as a function of calcination temperature, (b) HRSEM image and (c) XRD pattern of nanobiocomposite film containing 10 wt% Cu nanoparticles; inset in Fig. 4b shows the corresponding EDAX data, (d) conductivity of nanobiocomposite film as a function of dosage of calcined Cu nanoparticle, LED lamp set-up working with LR41 alkaline batteries for demonstrating the conducting nature of (e) pure collagen film and (f) nanobiocomposite film containing 5 wt% of calcined Cu nanoparticles; (g) and (h) circuit diagrams for (e) and (f), respectively, (note the logarithmic scale in (a) and (d)).

The maximum electrical conductivity is found to be 1.6 × 10⁻³ S cm−1 for Cu nanoparticles calcined at 600 °C. We also found that this value does not change even after storage for six months in a closed vial. Such highly conductive Cu nanoparticles have immense applications in various electronic and energy storage applications. Here we show that the calcined Cu nanoparticles can be used to prepare a conducting nanobiocomposite film from electrically insulating skin trimming wastes generated from leather industry. The skin trimming waste was cleansed and powdered into collagen fibers. The collagen fibers were solubilized and mixed with varying amount of calcined Cu nanoparticles and casted to form nanobiocomposite films. The HRSEM image of the nanobiocomposite film formed by the addition of 10 wt% Cu nanoparticles show the presence of spherical Cu nanoparticles with uniform distribution (Fig. 4b). The inset shows the elemental distribution of the nanobiocomposite carried out using EDAX analysis, which confirms the presence of Cu nanoparticles. The FT-IR spectrum of nanobiocomposite film (Fig. S7) shows characteristic bands of collagen at 1645, 1540 and 1240 cm−1 corresponding to amide I, amide II and amide III, respectively.29 The characteristic lattice vibration band of Cu2O is also seen at 620 cm−1,26 which confirms the presence of calcined Cu nanoparticles in the nanobiocomposite film. The XRD pattern of collagen–Cu nanoparticle based nanobiocomposite (Fig. 4c) shows diffraction peaks corresponding to (111), (200) and (220) plane of fcc structure of copper, thereby confirming the presence of copper nanoparticles. The electrical conductivity of collagen–Cu nanoparticle based nanobiocomposite films seems to increase significantly even with very low dosage (0.5 wt%) of calcined copper nanoparticles (Fig. 4d).

The conductivity of collagen–Cu nanobiocomposite increased nine orders of magnitude when compared to pure collagen film (6.5 × 10⁻¹² S cm−1). The electrical conductivity of nanobiocomposite containing 10 wt% calcined copper nanoparticles is 1 × 10⁻³ S cm−1. These values are comparable or even better that those reported for collagen or chitosan based conducting composites reported earlier.30,31 The high electrical conductivity of the prepared nanobiocomposite film offers great opportunity for several possible electronic applications. Here, we demonstrate that the developed nanobiocomposite film can conduct electricity when inserted between batteries and illuminate a light emitting diode (LED) lamp. A LED (5 mm length, 2.1 V) lamp unit working with three alkaline batteries (LR41, 1.5 V each and 4.5 V in total) was used to investigate the application of conductive nanobiocomposite films. The LED lamp was wrapped with a CSIR logo printed transparent plastic sheet in order to increase the visibility. Both nanobiocomposite and pure collagen (without Cu nanoparticles) films were cut into small rectangular pieces and inserted between batteries as shown in Fig. 4e and f. The corresponding circuit diagrams are shown in Fig. 4g and h. When the unit, connected by the alkaline batteries separated by two nanobiocomposite films comprising 5 wt% calcined copper nanoparticles, was switched on (Fig. 4f), the LED lamp illuminated. Whereas no illumination was observed (Fig. 4e) even when only one pure collagen film was inserted between batteries. This experiment demonstrates the electrical conductive property of the prepared nanobiocomposite film and its possible applications in electrodes for LED and photovoltaic devices, sensors, bioelectronics, electromagnetic interference shielding and energy storage.

In conclusion, we show a simple and green synthetic protocol to prepare stable copper nanoparticles employing henna leaf extracts. We have also fabricated a conducting nanobiocomposite films using the prepared Cu nanoparticles and collagen fibers discarded from leather industry. We demonstrate that the prepared Cu nanoparticles and nanobiocomposite films have potential for various electronic device applications. The study provides a green synthetic route for preparing copper nanoparticles and nanobiocomposite films exploiting plant and animal sources, which are renewable and environmental friendly, thereby presents a cost-effective and sustainable approach to produce a new generation of functional nanomaterials.

Financial support from CSIR under ZERIS (CSC0103) is greatly appreciated. We also thank SAIF, IIT Madras for providing HRSEM/EDAX facility.

Notes and references

  1. R. Narayanan and M. A. El-Sayed, J. Phys. Chem. B, 2005, 109, 12663 CrossRef CAS PubMed .
  2. J. Perelaer, P. J. Smith, D. Mager, D. Soltman, S. K. Volkman, V. Subramanian, J. G. Korvink and U. S. Schubert, J. Mater. Chem., 2010, 20, 8446 RSC .
  3. J. Gao, H. Gu and B. Xu, Acc. Chem. Res., 2009, 42, 1097 CrossRef CAS PubMed .
  4. J. Wang, Analyst, 2005, 130, 421 RSC .
  5. Y. Wang, A. V. Biradar, G. Wang, K. K. Sharma, C. T. Duncan, S. Rangan and T. Asefa, Chem.–Eur. J., 2010, 16, 10735 CrossRef CAS PubMed .
  6. S. Jeong, H. C. Song, W. W. Lee, S. S. Lee, Y. Choi, W. Son, E. D. Kim, C. H. Paik, S. H. Oh and B. Ryu, Langmuir, 2011, 27, 3144 CrossRef CAS PubMed .
  7. J. Zhang, J. Liu, Q. Peng, X. Wang and Y. Li, Chem. Mater., 2006, 18, 867 CrossRef CAS .
  8. M. Salavati-Niasari and F. Davar, Mater. Lett., 2009, 63, 441 CrossRef CAS PubMed .
  9. H. Wang, J. Xu, J. Zhu and H. Chen, J. Cryst. Growth, 2002, 244, 88 CrossRef CAS .
  10. I. Haas, S. Shanmugam and A. Gedanken, J. Phys. Chem. B, 2006, 110, 16947 CrossRef CAS PubMed .
  11. T. M. D. Dang, T. T. T. Le, E. Fribourg-Blanc and M. C. Dang, Adv. Nat. Sci.: Nanosci. Nanotechnol., 2011, 2, 6 Search PubMed .
  12. A. Sarkar, T. Mukherjee and S. Kapoor, J. Phys. Chem. C, 2008, 112, 3334 CAS .
  13. H. Zhu, C. Zhang and Y. Yin, J. Cryst. Growth, 2004, 270, 722 CrossRef CAS PubMed .
  14. J. Xiong, Y. Wang, Q. Xue and X. Wu, Green Chem., 2011, 13, 900 RSC .
  15. V. V. T. Padil and M. Černík, Int. J. Nanomed., 2013, 8, 889 Search PubMed .
  16. S. Iravani, Green Chem., 2011, 13, 2638 RSC .
  17. M. R. Salvadori, L. F. Lepre, R. A. Ando, C. A. O. Nascimento and B. Corrêa, PLoS One, 2013, 8, 1 Search PubMed .
  18. A. Ostovari, S. M. Hoseinieh, M. Peikari, S. R. Shadizadeh and S. J. Hashemi, Corros. Sci., 2009, 51, 1935 CrossRef CAS PubMed .
  19. J. Kasthuri, S. Veerapandian and N. Rajendiran, Colloids Surf., B, 2009, 68, 55 CrossRef CAS PubMed .
  20. S. Marimuthu, A. A. Rahuman, T. Santhoshkumar, C. Jayaseelan, A. V. Kirthi, A. Bagavan, C. Kamaraj, G. Elango, A. A. Zahir, G. Rajakumar and K. Velayutham, Parasitol. Res., 2012, 111, 2023 CrossRef PubMed .
  21. F. Zsila and I. Fitos, Org. Biomol. Chem., 2010, 8, 4905 CAS .
  22. J. L. Huaman, K. Sato, S. Kurita, T. Matsumoto and B. Jeyadevan, J. Mater. Chem., 2011, 21, 7062 RSC .
  23. D. Demirskyi, D. Agrawal and A. Ragulya, Mater. Sci. Eng., A, 2010, 527, 2142 CrossRef PubMed .
  24. R. K. Swarnkar, S. C. Singh and R. Gopal, Bull. Mater. Sci., 2011, 34, 1363 CrossRef CAS .
  25. W. B. W. Nik, F. Zulkifli, O. Sulaiman, K. B. Samo and R. Rosliza, Mater. Sci. Eng., 2012, 36, 7 Search PubMed .
  26. J. Khanderi, C. Contiu, J. Engstler, R. C. Hoffmann, J. J. Schneider, A. Drochnerb and H. Vogel, Nanoscale, 2011, 3, 1102 RSC .
  27. G. Cheng and A. R. H. Walker, Anal. Bioanal. Chem., 2010, 396, 1057 CrossRef CAS PubMed .
  28. L. Zhang, Z. Cui, Q. Wu, D. Guo, Y. Xu and L. Guo, CrystEngComm, 2013, 15, 7462 RSC .
  29. J. Song, H. Kim and H. Kim, J. Biomed. Mater. Res., Part B, 2007, 83B, 248 CrossRef CAS PubMed .
  30. T. Thanpitcha, A. Sirivat, A. M. Jamieson and R. Rujiiravanit, Carbohydr. Polym., 2006, 64, 560 CrossRef CAS PubMed .
  31. M. Ashokkumar, K. M. Sumukh, R. Murali, N. T. Narayanan, P. M. Ajayan and P. Thanikaivelan, Carbon, 2012, 50, 5574 CrossRef CAS PubMed .

Footnote

Electronic supplementary information (ESI) available: Further information regarding experimental details, UV-visible spectra, FT-IR spectra, HRSEM image, EDAX data and particle size distribution of the source materials, as-synthesized and calcined copper nanoparticles and nanobiocomposite samples. See DOI: 10.1039/c4ra01414f

This journal is © The Royal Society of Chemistry 2014
Click here to see how this site uses Cookies. View our privacy policy here.