Effect of Al2O3 coverage on SiC particles for electrically insulated polymer composites with high thermal conductivity
Yongseon Hwang,
Myeongjin Kim and
Jooheon Kim*
School of Chemical Engineering & Materials Science, Chung-Ang University, 84 Heukseok-Ro, Dongjak-gu, Seoul 156-756, Korea. E-mail: jooheonkim@cau.ac.kr; Fax: +82-2-824-3495; Tel: +82-2-820-5763
First published on 28th March 2014
Abstract
Al2O3-covered SiC/epoxy composites were prepared using a simple sol–gel method. The results of FE-SEM, TGA, and XPS indicated that the surfaces of the SiC particles had a large, dense, and homogenous distribution of Al2O3. It was found that the introduction of Al2O3 on the SiC surface improved the interfacial adhesion between the epoxy matrix and SiC particles; this resulted in an increase in the thermal conductivity of the composites since the thermal boundary resistance at the filler–matrix interface was decreased. In addition, Al2O3-covered SiC composites showed decreased electrical conductivity owing to decreased electron tunneling compared with raw SiC composites. Thus, the Al2O3-covered SiC composites prepared in the present work could prove to be desirable polymer composites to be used as thermal interface materials that are employed in the electronics industry.
1. Introduction
With the progress in the field of electronic devices during the last few decades, the continued miniaturization of electronic device components commonly encounters problems associated with heat dissipation, and this has highlighted the need for improved thermal interface materials (TIMs) to be utilized in modern chip packaging.1–3 The reliability of an electronic device is exponentially related to the operating temperature of the junction. A small difference in the operating temperature (10–15 °C) can result in a two-fold reduction in the lifespan of a device.4 Therefore, it is crucial that the heat generated in the device is dissipated as quickly and effectively as possible to maintain the operating temperature of the device at the desired level.In typical flip-chip assemblies of microprocessors, heat spreaders and heat sinks with high thermal conductivities are employed to dissipate the heat generated in the die. However, surface asperities greatly limit the actual contact between solid surfaces (e.g., die/heat spreader and heat spreader/heat sink), thereby reducing the effective thermal conduction. TIMs have been introduced to fill the gaps between asperities in order to minimize the thermal contact resistance,5–7 and extensive research has been conducted to develop novel, improved TIMs.8 In order to obtain TIMs with enhanced thermal conductivity, many kinds of composite particles, such as metals, ceramics, and nanostructured carbon materials, have been applied to thermosetting or thermoplastic polymers to form composite TIMs.
Among the various thermally conducting fillers, ceramic particles with high thermal conductivity are attractive candidates because they can provide the required thermal conductivity while maintaining the desired electrical insulation properties.9–12 Therefore, polymers with thermally conducting ceramic fillers such as boron nitride (BN), aluminum nitride (AlN), silicon nitride (SiN), alumina (Al2O3), silicon carbide (SiC), silica, and diamond are emerging as cost-effective materials for addressing thermal management issues. In these cases, a very high micro filler loading, normally 60 vol% or even higher, is needed to satisfy percolation thresholds and to obtain high thermal conductivity from continuously heat-conducting chains in the polymer.
Thermal conductive composites using SiC have also been investigated13,14 because SiC is a very attractive thermally conducting filler material because of its high thermal conductivity and low coefficient of thermal expansion. SiC has a significant advantage of a thermal conductivity of 490 W m−1 K−1, which is 3.3 times that of silica and ten times that of either gallium arsenide or sapphire.15 However, it is known that the electrical conductivity of SiC grown by most techniques is generally greater than that suitable for TIM owing to its wide bad gap. Efforts have been made to reduce the electrical conductivity of SiC by adding a p-type (i.e., acceptor) dopant such as boron. In practice, however, SiC-based devices fabricated using boron to obtain high resistivity have exhibited unexpectedly poor results at high power levels.16
In this study, surface-treated SiC particles were fabricated with aluminum oxide (Al2O3). Hydrofluoric-acid-treated SiC particles were covered with an aluminum precursor through the sol–gel method. In this reaction, aluminum isopropoxide is hydrolyzed by reacting with water, producing aluminum hydroxide and alcohol. The aluminum hydroxide (Al(OH)3)-covered SiC particles were converted to Al2O3–SiC (Al–SiC) during the heat treatment, and Al–SiC composites containing various amounts of fillers were prepared to observe the behaviors of composite properties. Furthermore, the thermal and electrical conductivities of the composites were measured to determine the effects of the surface treatment on the SiC particles.
2. Experimental
2.1. Materials
To obtain base polymer binders, diglycidyl ether of bisphenol A (DGEBA; Kukdo Chemical; epoxy equivalent weight (E.E.W.) = 186.8 g per eq.) was dried in a vacuum oven for 2 h to remove any residual solvent. 4,4′-Diaminodiphenylmethane (DDM) prepared by TCI Korea was used as a curing agent without further purification. Spherical SiC particles (density = 3.1 g cm−3) with a mean diameter of ∼50 μm were used as the filler. Hydrogen peroxide (H2O2, 34.5%) and methanol (MeOH, 95.0%) were purchased from Samchun Chemicals. Aluminum isopropoxide (AlIP) and hydrofluoric acid (HF) were purchased from Aldrich Chemicals.2.2. Synthesis of Al–SiC particles
A native oxide layer of SiO2 and O2− ions exists on the surface of all kinds of SiC particles.17 One bond connecting Si4+ and another bond form a hydroxyl (–OH) group when reacting with H2O, according to the following chemical equation:
![[triple bond, length as m-dash]](https://www.rsc.org/images/entities/char_e002.gif) Si–O− + H2O ⇔ Si–O− + H2O ⇔ ![[triple bond, length as m-dash]](https://www.rsc.org/images/entities/char_e002.gif) Si–OH + OH− Si–OH + OH−
| (1) |
SiC exhibits oxidation resistance at its surface by the formation of a passive thin and dense amorphous SiO2 layer, which has extremely low oxygen permeability up to very high temperatures.17 Therefore, the SiO2 layer and metal oxide adsorbed on the surface of the SiC particles were removed by HF etching according to the following chemical equation:
| SiO2 + HF ↔ SiF4 + 2H2O | (2) |
The process details are as follows: 20 g SiC particles and 300 mL 10% HF solution were placed in a 500 mL beaker, stirred for 1 h, and then leached with deionized (D.I.) water until the pH value of the leaching water reached 7–8. HF-etched SiC was dried at 100 °C for 1 h in vacuum. After HF treatment, SiC particles were heated in the H2O2 for 12 h at 60 °C, and then dried in a vacuum oven for 12 h at room temperature.
AlIP (0.05 g) was mixed with 500 mL of an H2O–MeOH mixture (4![[thin space (1/6-em)]](https://www.rsc.org/images/entities/char_2009.gif) :
:![[thin space (1/6-em)]](https://www.rsc.org/images/entities/char_2009.gif) 1) for 30 min at 90 °C. These reactions led to the successful hydrolysis of AlIP, which contained hydroxyl groups. The SiC particles (0.15 g) in methanol and D.I. water were added immediately to the AlIP solution. The hydrolysis and condensation of the mixture were conducted at 60 °C for 6 h, and the liquid mixture in the solution was then evaporated using a rotary evaporator and subsequently washed with D.I. water to remove any residual and unreacted AlIP.
1) for 30 min at 90 °C. These reactions led to the successful hydrolysis of AlIP, which contained hydroxyl groups. The SiC particles (0.15 g) in methanol and D.I. water were added immediately to the AlIP solution. The hydrolysis and condensation of the mixture were conducted at 60 °C for 6 h, and the liquid mixture in the solution was then evaporated using a rotary evaporator and subsequently washed with D.I. water to remove any residual and unreacted AlIP.
At the end of the procedure, the final products were collected by filtration and dried under vacuum for 12 h at 100 °C. The dried powder was then heat-treated at 450 °C for 3 h. AlIP can form Al(OH)3 via hydrolysis and can be converted to Al2O3 easily through heat treatment. The detailed synthesis route for Al–SiC is illustrated in Fig. 1.
2.3. Composite fabrication
Epoxy resin was added to raw SiC and Al–SiC particles, and the mixture was then heated to 50 °C via magnetic stirring for 2 h for achieving homogenization. The mixture was heated in a vacuum oven at 80 °C for 6 h to evaporate any residual solvents. DDM was mixed with an epoxy resin mixture in stoichiometric amounts at 100 °C for 15 min. The mixture was poured into PTFE molds, degassed in a vacuum oven at 80 °C for 30 min, and cured via the following cycle: 80 °C for 2 h, 120 °C for 6 h, and 180 °C for 6 h.2.4. Characterization
Thermogravimetric analysis (TGA) was conducted in an air atmosphere by using a CI Electronics microbalance (MK2–MC5). The sample was heated at a ramp rate of 10 °C min−1 to 800 °C, followed by an isotherm stage at that temperature for 30 min. Field emission scanning electron microscopy (FE-SEM, SIGMA, Carl Zeiss) was used to examine the SiC particles and morphology of the fabricated composites. Energy dispersive X-ray spectroscopy (EDX) and X-ray elemental mapping were confirmed by a Thermo NORAN system 7 EDX analyzer. The raw SiC and Al–SiC particles were characterized by X-ray photoelectron spectroscopy (XPS, VG-Microtech, ESCA2000) using an Mg Kα X-ray source (1253.6 eV) and a hemispherical analyzer. During curve fitting, the Gaussian peak widths were kept constant in each spectrum.The thermal conductivity of the composites at room temperature was calculated using the following equation:
| k = α × ρ × Cp | (3) |
The thermal diffusivity of all films was measured by laser flash analysis (LFA) carried out using a Netzsch 447 nanoflash. LFA is one of the most commonly used techniques for measuring the thermal diffusivity for various types of solids, liquids, and powder samples. The composites were cut into samples 10 mm in diameter and placed on metal holders. To measure thermal diffusivity, the front side of a plane-parallel sample was heated by a short light pulse (xenon flash lamp). The lamp was placed on a parabolic mirror, whereby a large part of the emitted radiation was focused onto the sample. The resulting temperature rise at the rear surface was detected using an infrared detector. By analyzing the resulting temperature versus time curve, thermal diffusivity was determined. This non-destructive measurement technique has the advantage of using small samples with simple shapes, as well as the ability to rapidly measure thermal diffusivity over a wide temperature range. After the measurement of thermal diffusivity, the room-temperature specific heat capacity (C) of disk samples was measured by differential scanning calorimetry (DSC; Netzsch DSC 200F3), and the density of the samples was determined by the water displacement method.
The electrical conductivity of the SiC composites was measured by impedance spectroscopy (IM-6ex, Zahner) at a voltage of 20 mV. For this measurement, samples prepared as cylinders 10 mm in diameter were placed between Pt-coated plates. Five measurements were carried out under each set of conditions. The electrical conductivity was calculated by the following equation:
| S = h/(R × A) | (4) |
3. Results and discussion
3.1. Characterization of SiC particles
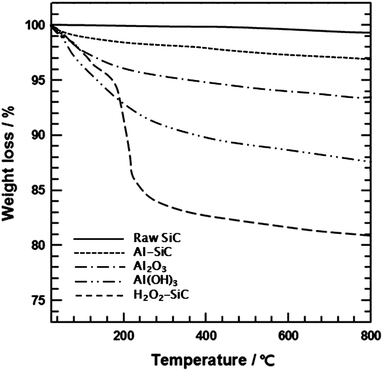
The raw SiC particles are composed of five distinct layers, as represented in Fig. 1.13 The first layer or inner core comprises SiC units. The second layer is an SiO2 layer that is completely covered by silanol groups, which comprise the third layer. The fourth layer consists of water molecules. Physically absorbed water is also present, and is usually removed by drying. Upon adsorption by hydroxyl groups, water molecules take a directional arrangement around the SiC particles because the hydrogen bonding force does not allow the water molecules to move freely. The surface purity of SiC particles plays an important role in determining their interfacial interaction with AlIP and providing a homogeneous coverage. After HF etching, the amounts of SiO2, O2−, and water molecules on the surfaces of SiC particles decreased sharply. This situation led to the result that, on the one hand, the hydroxyl group could not form, and on the other hand, –OH− was replaced by F− owing to some of the specific properties of these ions, for example, ionic radius, ionic valence, and ionic polarization, which are very similar.17 H2O2 treatment introduced hydroxyl groups on the SiC surface, which resulted in the covalent attachment of AlIP, forming the aluminum hydroxide structure via hydrolysis.The oxidation of SiC through the H2O2 treatment and composition of Al2O3 on the SiC particles were confirmed using TGA, as shown in Fig. 2. Raw SiC particles were stable under a flowing air atmosphere over the entire temperature range, and lost only a few percent of their mass, which was associated with absorbed humidity. In the case of H2O2-treated SiC, the sharper thermal loss occurred near 150 °C and decreased by about 19 wt% because of pyrolysis of the oxygen-containing functional groups on the SiC surface. The weight loss values of Al2O3 and Al(OH)3 were found to be 6.5 and 12.6%, respectively. Al2O3 sources were obtained by heat treatment of Al(OH)3 at 450 °C, which temperature was applied for Al–SiC at last process and thus, chemically less active Al2O3 showed the decrease in weight loss. Also, the weight loss values of raw SiC and Al–SiC were 0.8% and 3%, respectively. Accordingly, the mass ratio of SiC and Al2O3 was derived as 1.59![[thin space (1/6-em)]](https://www.rsc.org/images/entities/char_2009.gif) :
:![[thin space (1/6-em)]](https://www.rsc.org/images/entities/char_2009.gif) 1.
1.
In the formation of alumina from the precursor, several composition features can be observed during heat treatment, such as gibbsite (Al(OH)3), diaspore alpha-(AlO(OH)), and boehmite gamma-(AlO-(OH)).18 They all convert to aluminum oxide by dehydration of the hydroxides during heat treatment below 600 °C. Note that the heat treatment for hydrolysis of AlIP was performed at 450 °C to produce Al2O3 on the SiC surface as well as to avoid re-formation of the SiO2 layer on the SiC surface. This is because a previous study indicated that heat treatment of SiC at high temperature (>700 °C) formed a thick, amorphous SiO2 layer, which can hinder the formation of homogeneously covered materials. Several analyses were performed to confirm the successful covering of the SiC surface with Al2O3, as illustrated in Fig. 1.
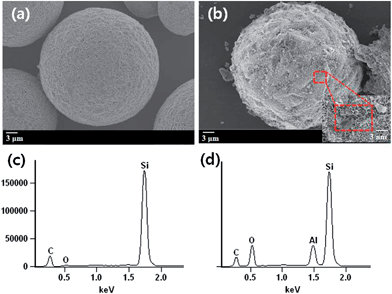
The morphology of raw SiC and Al–SiC particles was observed by FE-SEM, as shown in Fig. 3, depicting a different morphology after the surface treatment. The shape of the particles (Fig. 3(a) and (b)) remained approximately spherical, and the average particle diameter after the surface treatment was nearly equal to that of the starting materials. In Fig. 3(b), most of the surfaces shown were coated homogeneously with the developed alumina nanoparticles in the synthesized SiC particles after the sol–gel reaction with AlIP. To verify whether the surfaces of the SiC particles were coated with alumina, raw SiC and Al–SiC particles were subjected to EDX, the results of which are shown in Fig. 3(c) and (d). As expected, the spectra revealed the presence of alumina that originated from the alumina precursor in Fig. 3(d); this is in contrast with the case of raw SiC (Fig. 3(c)), the spectra of which showed Si, O, and C peaks.
To ascertain the distribution of Al2O3 on the SiC surface, X-ray elemental mapping was performed and is shown in Fig. 4. In Fig. 4(a), Al–SiC particles were detected without elemental mapping. After mapping, silicon, carbon, and aluminum were detected. Silicon elements (Fig. 4(b)) showed a dense distribution compared with carbon elements in Fig. 4(c). Moreover, aluminum elements uniformly covered the SiC surface, as shown in Fig. 4(d).
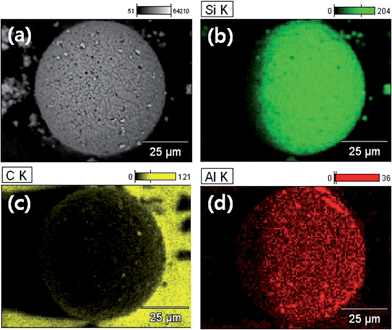 | ||
| Fig. 4 X-ray elemental mapping of Al–SiC: (a) pristine Al–SiC, (b) silicon mapping, (c) carbon mapping, (d) aluminum mapping. | ||
The chemical structures of the Al–SiC particles were determined by XPS analysis and the results are presented in the Fig. 5. Fig. 5(a) shows wide-scan spectra of pristine SiC and Al–SiC particles to identify the surface element present with quantitative analysis. In the pristine SiC spectra, the elements present in these specimens were primarily silicon, carbon, and oxygen. After surface treatment, the intensity of the O 1s peak increased, and Al 2p and Al 2s peaks were detected due to the presence of Al2O3 on the SiC surface. A detailed analysis of the XPS spectra gave clear evidence that the surface treatment affected the SiC particle's surface, which was confirmed by high-resolution O 1s spectra based on a Gaussian-shaped spectral de-convolution. As shown in Fig. 5(b), the raw SiC particles were composed of Si–O–C (529.22 eV), Si–O (531.25 eV), and C–O (533.47 eV) components.19 Additionally, residual H2O molecules on the raw SiC surface were detected in the O 1s spectra. The O 1s spectrum of Al–SiC showed new peaks at 532.15 eV in Fig. 5(c). This represents the Al2O3 component during the heat treatment at 450 °C.18,20 Hernadi et al. reported the homogenous coverage of Al(OH)3 on CNT surfaces.18 They used AlIP as the aluminum source in their experiment. In this study, an AlIP and CNT suspension was heated at 250 °C for 8 h. There are two dominant O 1s peaks: one for Al(OH)3 at 533 eV and the other for Al2O3 at 531.6 eV. In our experiment, only one O 1s peak corresponding to Al–O at 532 eV was observed, indicating that Al–O bonding existed on the SiC surface. The final step of our fabrication process was the heat treatment of Al–SiC at 450 °C for 3 h. Therefore, this temperature is enough to convert aluminum hydroxide to aluminum oxide via dehydration.
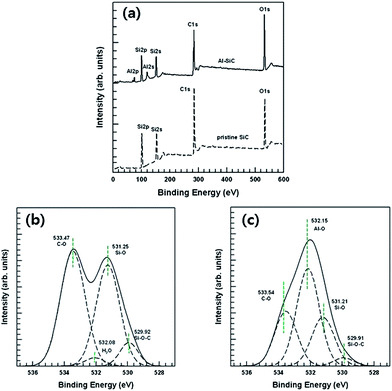 | ||
| Fig. 5 XPS (a) wide-scan spectra of raw SiC and Al–SiC, curve fitting of the O 1s peaks, (b) raw SiC, (c) Al–SiC. | ||
3.2. Thermal transport properties
The thermal conductivity of the fabricated SiC/epoxy composites was examined as a function of the SiC particle concentration, and the results are shown in Fig. 6. The thermal conductivity of all composites enhanced after an increase in the SiC concentration of the epoxy matrix. Thus, at a fixed particle loading, a higher thermal conductivity was observed in the case of Al–SiC/epoxy composites owing to the improvement in the interfacial adhesion between Al–SiC and the epoxy matrix, and hence, the thermal boundary resistance at the filler–matrix interface was decreased.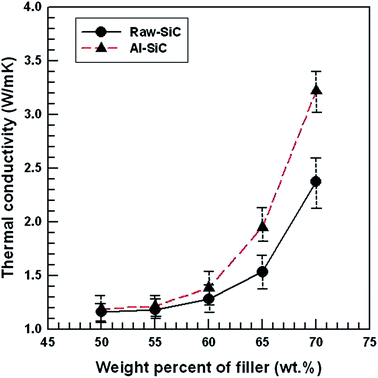 | ||
| Fig. 6 Thermal conductivity results of raw SiC and Al–SiC composites as a function of the filler content. | ||
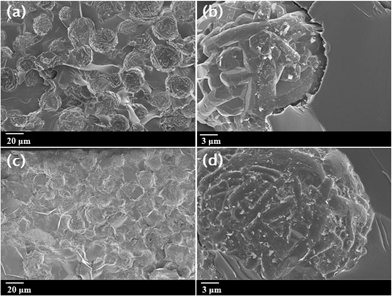
To verify the difference between the interfacial adhesion of raw SiC and Al–SiC in the epoxy matrix, cross-sectional FE-SEM images of the composites were obtained. As shown in Fig. 7(a) and (b), raw SiC/epoxy composites with a 50 wt% SiC concentration revealed poor interfacial adhesion between the SiC particles and epoxy matrix; this is because an amorphous SiO2 layer on the raw SiC particles resulted in particle pull-out at the interface, which is evidence of the clean surface shown in Fig. 3(a). However, after the SiC particles were covered with Al(OH)3, it was clearly observed that cracks and air voids between the SiC particles and epoxy matrix in the composites were almost removed, indicating that the surfaces of Al–SiC particles had good interfacial adhesion in the epoxy matrix (Fig. 7(c) and (d)). In the case of Al–SiC particles, some partial interactions originating from hydroxyl (–OH) and oxygen groups absorbed by Al2O3 molecules on the SiC surface could contribute to an increase in the interaction with the hydroxyl groups on the epoxy resin chain. Thus, Al–SiC particles resulted in dipole–dipole interactions or hydrogen bonding with the residual polar groups of the epoxy matrix, such as hydroxyl and amine groups.
The thermal transport efficiency across the interface between two materials in a composite directly affects the thermal conductivity of the composite.21 Generally, heat is carried by two contributions: acoustic phonons (ion-core vibrations in a crystal lattice) and electrons, such that K = Kp + Ke, where Kp and Ke are the phonon and electronic heat conductivity in solid materials.22 In non-metallic materials, heat conduction is usually dominated by phonons, resulting in efficient heat transfer by lattice vibrations. However, the phonon–phonon scattering, boundary scattering, and defect scattering also result in an increase in the thermal resistance of non-metallic materials. When the phonon transfer occurs at the filler–matrix interface in a composite, the presence of air voids or defects around the surface affects the phonon scattering. As shown in Fig. 6 and 7, the increase in the thermal conductivity of Al–SiC composites was due to the improvement in the interfacial adhesion between the Al–SiC particles and epoxy matrix, and thus, the thermal boundary resistance at the filler–matrix interface decreased.
In order to clarify the difference in thermal boundary resistance between Al–SiC and raw SiC composites, theoretical simulation was conducted through experimental result of thermal conductivity. Many theoretical models have been developed to explain the thermal conductivities of two-phased composites. Agari and Uno23–25 modified the Maxwell model assuming that, with a certain probability P, the filler particles with a high volume fraction form conductivity paths within the polymer matrix. According to this theory, the thermal conductivity coefficient is calculated by the following equation:
 | (5) |
Here, kc, km, and kf are the thermal conductivity of the composite, matrix, and filler, respectively and Φf is the volume percentage of the filler. c2 is the cross-sectional area of the conducting path, P = Φf(Φf)−2/3 and Φf = 3c2 − 2c3. The alternative model was proposed for the estimation of the thermal conductivity of a blend containing more than two phases. The corresponding equation can be written as:23,24
log![[thin space (1/6-em)]](https://www.rsc.org/images/entities/char_2009.gif) kc = Φf[P* − log(C1km)] + log(C1km) kc = Φf[P* − log(C1km)] + log(C1km)
| (6) |
![[thin space (1/6-em)]](https://www.rsc.org/images/entities/char_2009.gif) log
log![[thin space (1/6-em)]](https://www.rsc.org/images/entities/char_2009.gif) kf + X3C3
kf + X3C3![[thin space (1/6-em)]](https://www.rsc.org/images/entities/char_2009.gif) log
log![[thin space (1/6-em)]](https://www.rsc.org/images/entities/char_2009.gif) kf +…; Ci is the factor accounting for the formation of the conducting paths in the matrix, and Xi is the ratio between different filler particles in the blend. In the case of a single type of particles, X1 is equal to 1 and the other coefficients are neglected. The model's resulting equation is then:
kf +…; Ci is the factor accounting for the formation of the conducting paths in the matrix, and Xi is the ratio between different filler particles in the blend. In the case of a single type of particles, X1 is equal to 1 and the other coefficients are neglected. The model's resulting equation is then:
log![[thin space (1/6-em)]](https://www.rsc.org/images/entities/char_2009.gif) kc = ΦfC2 kc = ΦfC2![[thin space (1/6-em)]](https://www.rsc.org/images/entities/char_2009.gif) log log![[thin space (1/6-em)]](https://www.rsc.org/images/entities/char_2009.gif) kf + (1 − Φf)log(C1km) kf + (1 − Φf)log(C1km)
| (7) |
In order to obtain C1 and C2, a plot of log![[thin space (1/6-em)]](https://www.rsc.org/images/entities/char_2009.gif) kc versus Φf was drawn using data from Fig. 8. The expected thermal conductivity of these materials on the basis of the Agari model was obtained after substituting the slope and intercept deduced from the semi-logarithmic plot into eqn (7).
kc versus Φf was drawn using data from Fig. 8. The expected thermal conductivity of these materials on the basis of the Agari model was obtained after substituting the slope and intercept deduced from the semi-logarithmic plot into eqn (7).
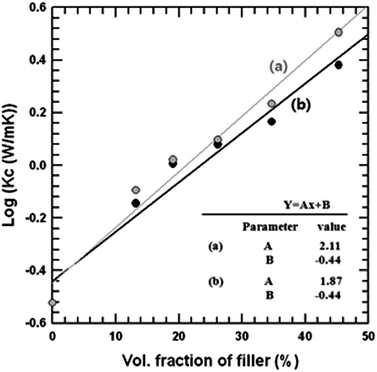 | ||
| Fig. 8 Logarithm of thermal conductivity of SiC composites ((a) Al–SiC, (b) raw SiC) linearly fit by the Agari and Uno edels. | ||
According to Agari models, C1 is a factor related to the effect of the filler on the secondary structure of the polymer, and C2 is a factor related to the formation of conductive chains of the filler. When the C1 value is lower than 1, the filler may change the thermal conductivity of a polymer matrix by affecting its structure. Also, the more C2 approaches 1, the more easily conductive chains are formed in the composite.23–25 The values C1 and C2 of the composites, calculated from eqn (7), are listed in Table 1. In the case of our system, C1 values of both Al–SiC and raw-SiC composites are higher than 1, so that there were no secondary structure effects of polymer. The C2 value of the composite containing Al–SiC particles showed a value closer to 1 than the composites with raw SiC particles. This indicates that the addition of Al–SiC particles into epoxy did not affect the secondary structure of the polymer matrix but formed conducting paths. The improved filler dispersion and the less thermal boundary resistance of the composite was a result of the Al2O3 covering on the SiC particles, which enhanced the interfacial interaction strength between the polymer matrix and the SiC particles.
| Al–SiC composites | Raw SiC composites | |
|---|---|---|
| Eqn (7) | Kc = 10(2.11Φ−0.44) | Kc = 10(1.87Φ−0.44) |
| C1 | 1.21 | 1.21 |
| C2 | 0.726 | 0.621 |
3.3. Electrical conductivity
The electrical conductivity of the SiC composites is plotted as a function of the weight percent of SiC added to the matrix in Fig. 9. Over the range of the studied weight percentage of raw SiC particles (up to 70 wt%), the conductivity varied by about three orders of magnitude from 5.84 × 10⁻⁶ S cm−1 to 4.25 × 10⁻³ S cm−1. In the case of Al–SiC composites, the conductivity was changed by about one order of magnitude from 5.25 × 10⁻⁶ S cm−1 to 5.67 × 10⁻⁵ S cm−1. These results show that the percolation threshold concentration of SiC particles between 65 and 70 wt% formed a conducting path of interconnected SiC particles. As shown in Fig. 9, the electrical conductivity of the Al–SiC composites was less than that of raw SiC composites since the electrical insulating material, Al2O3, on the SiC surface prevented electron tunneling, thereby degrading the electrical properties of the Al–SiC composites.26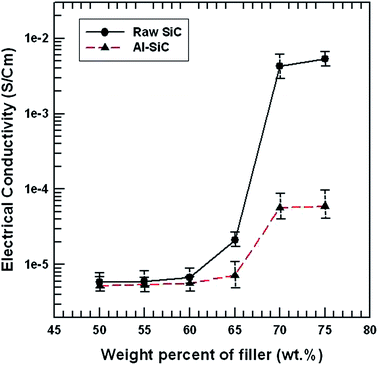 | ||
| Fig. 9 Electrical conductivity of the composites with raw SiC and Al–SiC as a function of the filler content. | ||
4. Conclusion
In this study, the effects of aluminum hydroxide functionalization of SiC particles on the electrical and thermal properties of bisphenol A epoxy composites were investigated. Raw SiC particles were subjected to HF etching to remove the native SiO2 layer and water, and the HF-treated SiC particles were reacted with aluminum isopropoxide, which can be an efficient source for the preparation of Al–SiC particles by using a simple sol–gel method.FE-SEM results clearly showed that the Al2O3 covering layer improved the interfacial adhesion between the SiC particles and epoxy matrix. This was because some partial interactions originating from functional groups absorbed by the Al2O3 molecules on the SiC surface could contribute to an increase in the interaction with the hydroxyl groups on the epoxy resin chain. This increased the thermal conductivity of the Al–SiC composites to about 1.6 times that of raw SiC composites. Moreover, Al–SiC composites showed decreased electrical conductivity owing to decreased electron tunneling in the composites.
Therefore, it is concluded that the introduction of Al2O3 on SiC particles is an effective method for fabricating highly concentrated composites with reasonably high thermal and decreased electrical conductivity.
Acknowledgements
This research was supported by Basic Science Research Program through the National Research Foundation of Korea (NRF) funded by the Ministry of Education, Science and Technology (2012R1A1A2008884).Notes and references
- W. Lin, K. S. Moon and C. P. Wong, Adv. Mater., 2009, 21, 2421–2424 CrossRef CAS PubMed.
- Y. Mamunya, A. Boudenne, N. Lebovka, L. Ibos, Y. Candau and M. Lisunova, Compos. Sci. Technol., 2008, 68, 1981–1988 CrossRef CAS PubMed.
- A. Yu, P. Ramesh, M. E. Itkis, E. Bekyarova and R. C. Haddon, J. Phys. Chem. C, 2007, 111, 7565–7569 CAS.
- L. C. Sim, S. R. Ramanan, H. Ismail, K. N. Seetharamu and T. J. Goh, Thermochim. Acta, 2005, 430, 155–165 CrossRef CAS PubMed.
- Y. Joshi and S. V. Garimella, Microelectron. J., 2003, 34, 169 CrossRef.
- R. Prasher, Proc. IEEE, 2006, 94, 1571–1586 CrossRef CAS.
- F. Sarvar, D. C. Whalley, D. A. Hutt, P. J. Palmer and N. J. Teh, Microelectron. Int., 2007, 24, 66–75 CrossRef CAS.
- H. Im and J. Kim, Chem. Eng. News, 2011, 29, 554–560 Search PubMed.
- Z. Shi, M. Radwan, S. Kirihara, Y. Miyamoto and Z. Jin, Appl. Phys. Lett., 2009, 95, 224104 CrossRef PubMed.
- T. L. Li and S. L. C. Hsu, J. Phys. Chem. B, 2010, 114, 6825–6829 CrossRef CAS PubMed.
- C. Zhi, Y. Bando, T. Terao, C. Tang, H. Kuwahara and D. Golberg, Adv. Funct. Mater., 2009, 19, 1857–1862 CrossRef CAS PubMed.
- F. Yang, X. Zhao and P. Xiao, J. Eur. Ceram. Soc., 2010, 30, 3111–3116 CrossRef CAS PubMed.
- T. Zhou, X. Wang, G. U. Mingyuan and X. Liu, Polymer, 2008, 49, 4666–4672 CrossRef CAS PubMed.
- E. Neyman, J. G. Dillard and D. A. Dillard, J. Adhes., 2006, 82, 331–353 CrossRef CAS.
- C. H. Carter Jr, M. Brandy and V. F. Tsvetkov, US pat. 6218680 , 2001.
- A. O. Evwaraye, S. R. Smith and W. C. Mitchel, J. Appl. Phys., 1994, 76, 5769–5772 CrossRef CAS PubMed.
- N. Shufan, L. Hongyan, C. Wei, L. Bin and C. Shoutian, Rare Met., 2005, 24, 240–245 Search PubMed.
- K. Hernadi, E. Couteau, J. W. Seo and L. S. Forro, Langmuir, 2003, 19, 7026–7029 CrossRef CAS.
- K. H. Lee, S. K. Lee and K. S. Jeon, Appl. Surf. Sci., 2009, 255, 4414–4420 CrossRef CAS PubMed.
- M. R. Alexander, G. E. Thompson and G. Beamson, Surf. Interface Anal., 2000, 29, 468–477 CrossRef CAS.
- P. E. Hopkins, L. M. Phinney, J. R. Serrano and T. E. Beechem, Phys. Lett. B, 2010, 82, 085307 Search PubMed.
- A. A. Balandin, Nat. Mater., 2011, 10, 569–581 CrossRef CAS PubMed.
- Y. Agari and T. Uno, J. Appl. Polym. Sci., 1985, 30, 2225–2235 CrossRef CAS PubMed.
- Y. Agari, M. Tanaka, S. Nagai and T. Uno, J. Appl. Polym. Sci., 1987, 34, 1429–1437 CrossRef CAS PubMed.
- R. M. Scarisbrick, J. Phys. D: Appl. Phys., 1973, 6, 2098–2110 CAS.
- H. G. Im, Y. S. Hwang, J. H. Moon, S. H. Lee and J. H. Kim, Composites, Part A, 2013, 54, 159–165 CrossRef CAS PubMed.
| This journal is © The Royal Society of Chemistry 2014 |


