Controlled synthesis of hierarchical MnO2 microspheres with hollow interiors for the removal of benzene†
Dongyan Li,
Jun Yang,
Wenxiang Tang,
Xiaofeng Wu,
Lianqi Wei and
Yunfa Chen*
State Key Laboratory of Multiphase Complex Systems, Institute of Process Engineering, Chinese Academy of Sciences, Beijing, China 100190. E-mail: yfchen@mail.ipe.ac.cn; Fax: +86-10-6254 2803; Tel: +86-10-8254 4896
First published on 6th June 2014
Abstract
Three types of MnO2 microspheres, viz., hierarchical hollow β-MnO2 microspheres consisting of uniform nanorods, hierarchical double-walled hollow β/α-MnO2 microspheres assembled by two-categorical nanorods, and hierarchical hollow α-MnO2 microspheres constructed by nanorods and nanowires, have been synthesized by a facile hydrothermal method without employing any templates, catalysts, surfactants or calcinations. A number of characterization techniques, including X-ray diffraction (XRD), field-emission scanning electron microscopy (FESEM), energy dispersive spectroscopy (EDS), transmission electron microscopy (TEM), nitrogen adsorption–desorption measurements, and X-ray photoelectron spectroscopy (XPS) are used to characterize the formed hierarchical products, and to address the following critical issues: (i) effect of the precursor concentration; (ii) the role of HCl for the formation of the hierarchical hollow structure; and (iii) the possible mechanism accounting for the formation of the hierarchical hollow microspheres. The hierarchical hollow MnO2 microspheres can be used as catalysts for the catalytic oxidation of benzene, of which the hierarchical hollow α-MnO2 microspheres exhibit the highest catalytic ability.
1 Introduction
Hierarchical hollow structures have attracted significant attention due to their wide applications in catalysts,1,2 water treatments,3,4 cells,5,6 and drug delivery.7 Hierarchical hollow structures could combine the advantages of pristine building blocks with the unique properties of hollow structures. More importantly, this type of materials might possess new physicochemical properties arising from their secondary architecture.8 The morphology, size, and assembling way of the building blocks have great influence on the physicochemical properties and potential applications of the hollow structures. One-dimensional (1D) nanostructures usually exhibit unique electrical, optical, magnetic, mechanical, and thermal properties, and can be used as building blocks for the fabrication of complex structures.9,10 The hollow structures assembled by 1D nanostructure might be expected to possess unique physicochemical properties and to have wide potential applications. To date, several 1D nanostructure-based hollow structures have been synthesized by template or self-assemble methods, such as hierarchical hollow microspheres consisting of NiS nanorods,11 hierarchical hollow Ca10(PO4)6(OH)2 microspheres constructed by nanorods,12 hierarchical hollow microspheres assembled by titanate nanotubes,13 hierarchical MnS hollow sphere consisting of the nanorod arrays,14 hollow nestlike α-Fe2O3 spheres fabricated by nanorod subunits,15 et al. The conventional template methods involve the complicate process for the removal of sacrificial templates, which may damage the structural integrity of the final products. Hence it is desirable to develop facile and environmentally friendly methods for the preparation of hierarchical hollow structures using the self-assembly of 1D nanostructures.Manganese oxide has aroused increasing attention because of its structural flexibility, novel physicochemical properties, and wide applications in catalyst,16,17 electrochemical super-capacitor,18,19 microwave adsorption,20 and water treatment.21,22 To date, the hierarchical hollow MnO2 structures consisting of 1D nanorods23,24 or 1D nanotubes20,25 have been synthesized. Studies have shown that the hierarchical MnO2 assembled by 1D nanostructure show excellent performance. For example, Wang et al.26 reported that the hierarchical hollow α-MnO2 nanostructures with urchin-shape had a specific capacitance of 123 F g−1 with superior rate capability. In addition, the hierarchical hollow microspheres composed of MnO2 nanotubes obtained by them delivered a discharge capacity as high as 983 mA h g−1 during the 30th cycle at a current density of 300 mA g−1.27 Fu et al.28 obtained the hierarchical MnO2 microspheres assembled by nanorods, which have high activity (about 72% conversion) for the aerobic oxidation of benzyl alcohol to benzaldehyde and high selectivity. However, almost all of the reported hierarchical hollow MnO2 structures are single-wall and assembled by one category of 1D nanostructures. Hence, it is significant to develop simple methods for the fabrication of the hierarchical hollow MnO2 with double-wall or assembled by various categories of 1D nanostructure. The complexity in morphology and structure maybe endow MnO2 new physicochemical properties for more potential applications.
Herein, we report a facile method, which is based on the hydrothermal reaction, for the controlled preparation of hierarchical hollow MnO2 microspheres consisting of 1D nanostructure. Hierarchical hollow β-MnO2 microspheres consisting of nanorods, hierarchical hollow α-MnO2 constructed by nanorods and nanowires, and hierarchical double-walled hollow β/α-MnO2 microspheres assembled by two-categories of 1D nanostructure can be obtained by simply varying the concentrations of the precursors. To the best of our knowledge, the reports on the preparation of hierarchical hollow α-MnO2 and double-wall hierarchical hollow β/α-MnO2 microspheres composed by two-categories of 1D nanostructure are still very limited. In this work, we aim at addressing the following critical issues: (i) effect of the precursor concentration; (ii) the role of HCl for the formation of hierarchical hollow structure; and (iii) the possible mechanism accounting for the formation of the hierarchical hollow microspheres, upon the detailed characterizations of the hierarchical products. In addition, the application of the as-prepared hierarchical hollow MnO2 microspheres as catalysts for the oxidation of benzene will also be investigated in this report.
2 Experimental
2.1 Materials
Manganese(II) sulfate (MnSO4·H2O 99.0%), potassium persulfate (K2S2O8 99.5%), concentrated hydrochloric acid (HCl 36%) anhydrous ethanol (99.5%) and manganese dioxide (MnO2 85%) from Beijing Chemical Works.2.2 Synthesis of the hierarchical hollow MnO2
In a typical hydrothermal method, 0.048 mol of MnSO4·H2O and 0.012 mol of K2S2O8 were dissolved in 60 mL of distilled water, followed by adding 2 mL of HCl (36%) to form a homogeneous solution, which was then transferred into a 100 mL of Teflon autoclave. The autoclave was sealed and heated at 140 °C for 24 h. After cooling down to room temperature, the obtained precipitates were filtered and washed several times with distilled water and anhydrous ethanol. The precipitates were dried in an oven at 80 °C for 12 h and labeled as S1. By increasing the volume of HCl (36%) to 4 mL or decreasing the amount of K2S2O8 to 0.006 mol, while maintaining same for other conditions, the samples labeled as S2 or S3 was obtained, respectively.2.3 Characterization
The phase of product was characterized by X-ray powder diffraction (XRD, Philips X'Pert PRO MPD) with Cu Kα as the radiation source (λ = 1.5418 Å), which was operated at 40 kV and 30 mA. The morphology of the product was observed by field-emission scanning electron microscopy (FESEM, JSM-6700F) operated at the accelerating voltage of 10 kV and transmission electron microscopy (TEM, JEOL JEM-2010) with an accelerating voltage of 200 kV. Elemental compositions of the sample was examined with energy dispersive spectroscopy (EDS) attached to the FESEM. N2 adsorption–desorption isotherms were measured on Autosorb-1, Quantachrome at 77 K. The X-ray photoelectron spectroscopy (XPS) characterizations were carried out on ESCALab220i-XL.2.4 Catalytic evaluation
Analogous to the work we reported earlier,29 the catalytic oxidation of benzene was performed in a quartz tubular fixed bed reactor (internal diameter (i.d.) = 7 mm) at atmospheric pressure. 0.1 g of catalyst (40–60 mesh) was loaded between two quartz wool plugs. The reaction mixture consisting of air/benzene (1000 ppm of benzene) flowed at a rate of 100 mL min−1 (weight hourly space velocity (WHSV), 60![[thin space (1/6-em)]](https://www.rsc.org/images/entities/char_2009.gif) 000 mL g −1 h −1). The reactions were carried out in the range of 373–673 K with intervals of 20 K. The products of the catalytic reaction were analyzed by an online gas chromatography (Agilent 6890) equipped with a thermal conductivity detector (TCD) and flame ionization detector (FID).
000 mL g −1 h −1). The reactions were carried out in the range of 373–673 K with intervals of 20 K. The products of the catalytic reaction were analyzed by an online gas chromatography (Agilent 6890) equipped with a thermal conductivity detector (TCD) and flame ionization detector (FID).
3 Results and discussion
Fig. 1 shows the XRD patterns of the samples prepared by hydrothermal method with different concentration of precursors. All the diffraction peaks of S1 can be indexed to β-MnO2 (JCPDS 24-735, a = 0.440 Å and c = 2.874 Å). The XRD pattern of S3 is in accord with the structure of α-MnO2 (JCPDS 44-0141, a = 9.784 Å and c = 2.863 Å). The features of α-MnO2 (JCPDS 44-0141) and β-MnO2 (JCPDS 24-735) are observed in the diffraction peaks of S2, indicating that both β and α-MnO2 are present in the phase of S2. The results suggest that the crystalline of the product could be facilely controlled by simply altering concentration of precursors.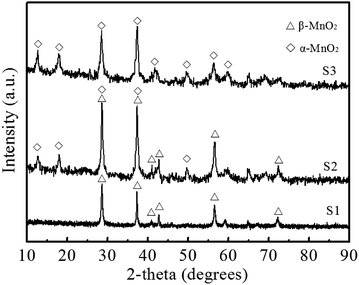 | ||
| Fig. 1 XRD patterns of the samples obtained by a hydrothermal method with different concentrations of precursors. | ||
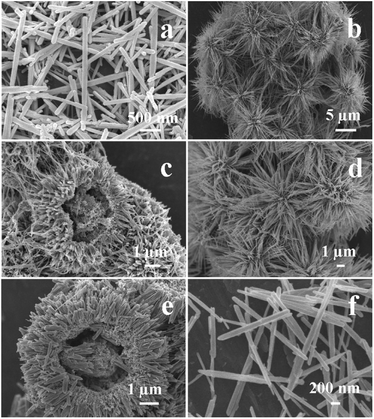
The FESEM images of the samples are shown in Fig. 2. When 2 mL of HCl and 0.012 mol of S2O82− ions were used in the reaction system (conditions for S1), hierarchical hollow β-MnO2 microspheres with diameter of ∼7 μm are obtained (Fig. 2a). The cavities of the microspheres and the hemisphere in Fig. 2a reveal the presence of hollow structure in the microspheres. The detailed structure of the hemisphere is shown in Fig. 2b, which reveals that the diameter of the inner cavity is ∼4.5 μm and the thickness of the shell is ∼1.5 μm. The shell consists of uniform nanorods with width of ∼60 nm. In the presence of 4 mL of HCl and 0.012 mol of S2O82− ions in the reaction system (conditions for S2), the product is composed of uniform microspheres with diameter of ∼7 μm (Fig. 2c). Further observation of a broken microsphere discloses obviously that the microspheres have hierarchical double-walled structure (Fig. 2d). The outer surface of the microsphere consists of nanorods with width of ∼200 nm and ∼30 nm. The thickness of the outer shell and inner shell are ∼2.5 μm and ∼700 nm, respectively. The diameter of the inner cavity is ∼1.5 μm. When 2 mL of HCl and 0.006 mol of S2O82− ions was employed in the reaction system (conditions for S3), the uniform hierarchical microspheres as-prepared are composed of nanorods and nanowires (Fig. 2e). Closer inspection of a single sphere reveals that the widths of nanorods and nanowires are ∼100 nm and 20 nm, respectively (Fig. 2f) The broken microspheres indicate that the microsphere has hollow interior and the diameter of the cavity is ∼500 nm.
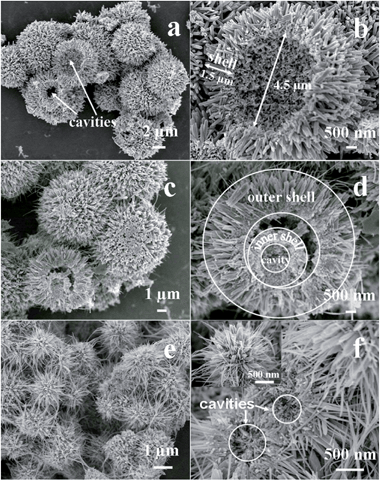 | ||
| Fig. 2 SEM images of sample S1 (a and b), S2 (c and d), and S3 (e and f) obtained by a hydrothermal method. | ||
The detailed structures of the samples are further characterized by TEM images, as presented in Fig. 3. The contrast between the light center and the black edge further reveals the hollow structure of the sample S1 (Fig. 3a). The high-resolution TEM (HRTEM) image of one of the nanorods shows that the lattice spacing is about 0.31 nm, which is consistent with the interplanar distance of the [110] planes of β-MnO2 (Fig. 3b). For the sample S2, no intensive contrast indicating the presence of hollow of the structure is found due to the cavity space is limited and the shell sphere is thick (Fig. 3c). The fringes distance of one of the nanorods in the HRTEM image is calculated to be 0.26 nm, which agrees well with the spacing between the [031] planes of α-MnO2 (Fig. 3d). The TEM image of the sample S3 shows strong image contrast between the dark edge and the pale center, which further confirms the formation of the hollow structure (Fig. 3e). HRTEM analysis reveals a lattice spacing of one of the nanorods is 0.26 nm, which is well in accordance with the [031] planes of α-MnO2 (Fig. 3f).
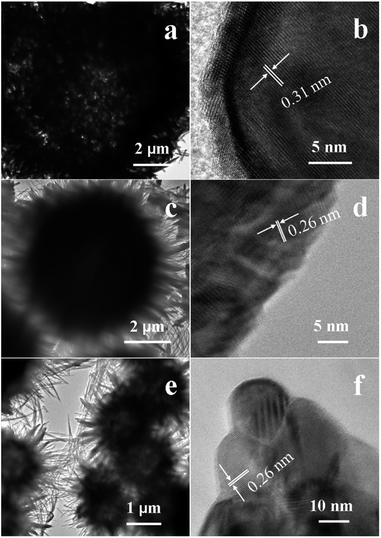 | ||
| Fig. 3 TEM images (a, c and e) and HRTEM images (b, d and f) of sample S1 (a and b), S2 (c and d), and S3 (e and f) obtained by a hydrothermal method. | ||
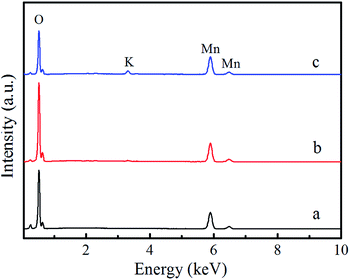
Moreover, the EDS spectra and the atomic ratios of the elements are shown in Fig. 4 and Table S1 of the ESI.† For these three samples, the signals of Mn and O are obviously observed in the EDS spectra and the atomic ratio of Mn/O is about 1![[thin space (1/6-em)]](https://www.rsc.org/images/entities/char_2009.gif) :
:![[thin space (1/6-em)]](https://www.rsc.org/images/entities/char_2009.gif) 2, in according with atomic ratio in MnO2. The observed Cu and C signals are induced by the carbon-coated copper grid, which is used as the support of the sample. The EDS spectra of S2 and S3 indicate the existence of K element. Table S1† indicate the atomic ratios of K in S2 and S3 are 0.5% and 2.5%, respectively. β-MnO2 consists of narrow [1 × 1] channels with the size of [0.23 nm × 0.23 nm] in the crystal structure.30 The voids within the channels are too small for K ions. Therefore, K is not detected in S1. The crystal structure of α-MnO2 is composed of a series of [2 × 2] and [1 × 1] tunnels. The size of [2 × 2] tunnel is [0.46 nm × 0.46 nm], which is large enough for the location of K ions in the middle of the tunnels. Hence K irons are detected in sample S2 and S3.
2, in according with atomic ratio in MnO2. The observed Cu and C signals are induced by the carbon-coated copper grid, which is used as the support of the sample. The EDS spectra of S2 and S3 indicate the existence of K element. Table S1† indicate the atomic ratios of K in S2 and S3 are 0.5% and 2.5%, respectively. β-MnO2 consists of narrow [1 × 1] channels with the size of [0.23 nm × 0.23 nm] in the crystal structure.30 The voids within the channels are too small for K ions. Therefore, K is not detected in S1. The crystal structure of α-MnO2 is composed of a series of [2 × 2] and [1 × 1] tunnels. The size of [2 × 2] tunnel is [0.46 nm × 0.46 nm], which is large enough for the location of K ions in the middle of the tunnels. Hence K irons are detected in sample S2 and S3.
The pore structures of the samples are characterized by nitrogen adsorption–desorption measurements. The nitrogen adsorption–desorption isotherms are shown in ESI Fig. S1.† Hysteresis loops can be observed in the isotherms of three samples, indicating the presence of mesopores in all samples. The pore size distributions determined by the Barrett–Joyner–Halenda (BJH) method are displayed in Fig. 5. The pore size distribution of S1 shows two peaks around 2.4 nm and 30.7 nm. Three peaks around 1.6 nm, 2.7 nm and 31.1 nm are observed from the pore size distribution of S2. The pore size distribution of S3 exhibits three peaks around 1.7 nm, 3.0 nm and 17.2 nm. The Brunauer–Emmet–Teller (BET) specific surface areas for S1, S2, and S3 are 14.21 m2 g−1, 20.09 m2 g−1, 31.76 m2 g−1, respectively. The results indicate that S2 and S3 assembled by two categorical nanostructures possess more types of pores and larger surface area than those of S1 assembled by one categorical nanostructures. This is important for expanding the application range of hollow MnO2 microspheres.
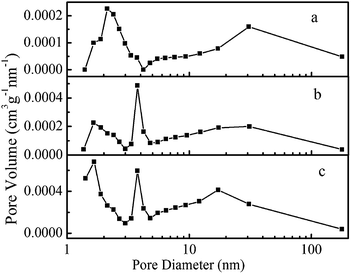 | ||
| Fig. 5 The pore size distribution of the as-prepared hierarchical sample S1 (a), S2 (b), and S3 (c) by a hydrothermal method. | ||
To further investigate the effect of HCl on the formation of the hierarchical hollow structure, we carried out the experiments with different amount of HCl in the reaction system, while maintaining the other reaction conditions same as those for preparation S1. In the absence of HCl in reaction system, uniform β-MnO2 nanorods with width of ∼100 nm (labeled as S4) are obtained (Fig. 6a). The hierarchical hollow structure is not observed in the absence of HCl. In the presence of 6 mL of HCl in the reaction system, chrysanthemum nanostructure MnO2 is formed. The chrysanthemum nanostructure consists of nanowires with width of ∼60 nm and length ∼3 μm (Fig. 6b). The results reveal that HCl is essential for the formation of hierarchical hollow microsphere. In addition, the effect of the concentration of S2O82− ions on the morphology of the product was also investigated. The reaction conditions are same as those for preparation S1 besides the concentration of S2O82− ions. When the concentration of S2O82− ions is 0.15 mol L−1, the hierarchical hollow shell–core structures are obtained. The shell consists of nanorods and nanowises distributed randomly among the nanorods (Fig. 6c). As the concentration of S2O82− is decreased to 0.05 mol L−1, the chrysanthemum nanostructure consisting of nanowires with width of ∼50 nm and length of ∼4 μm are obtained instead (Fig. 6d). The results indicate that the morphology of the product can also be tuned by changing the concentration of the S2O82− ions. Furthermore, the concentration of Mn2+ ions has also apparent influence on the morphology of the product. When the concentration of Mn2+ ions was decreased to 0.6 mol L−1, hierarchical core–shell microspheres with diameter of ∼10 μm are obtained (Fig. 6e). The surface of the hierarchical core–shell microspheres consists of nanorods with width of ∼40 nm and 150 nm. As the concentration of Mn2+ ions is 0.4 mol L−1, the product is composed of nanorods with width of ∼100 nm (Fig. 6f). Decreasing the concentration of S2O82− ions leads to the formation of the chrysanthemum nanostructure, which is analogous to the influence of increasing the concentration of HCl. Decreasing the concentration of Mn2+ and S2O82− ions results in the formation of the hierarchical shell–core microsphere. The hierarchical structure is composed of two categorical nanostructure, the hierarchical double-wall or shell–core structure can be obtained by controlling the concentration of the HCl, S2O82−, or Mn2+ions in an appropriate range.
XRD patterns of the samples prepared with different concentration of the precursor are shown in the ESI Fig. S2.† In the absence of HCl in the reaction system, β-MnO2 is synthesized (ESI Fig. S2a†). As the amount of HCl is changed to 6 mL, the crystal phase of the products is converted into α-MnO2 from β-MnO2 (ESI Fig. S2b†). In the presence of 0.15 mol L−1 of S2O82− ions in the reaction system, β-MnO2 is obtained (ESI Fig. S2c†). As the concentration of S2O82− ions in the reaction system is 0.05 mol L−1, α-MnO2 is generated (ESI Fig. S2d†). When the concentration of Mn2+ is 0.6 mol L−1 or 0.4 mol L−1, the peaks of the products could be indexed to β-MnO2 (ESI Fig. S2e and S2f†). Increasing the concentration of HCl gives rise to the formation of α-MnO2, which is analogous to the effect of decreasing the concentration of S2O82− ions.
To understand the formation mechanisms of the hierarchical double-walled hollow structure, a series of time-dependent experiments were carried out, the SEM images of the products are shows in Fig. 7. When the reaction time is 5 min, the solution was clear pink in color and no precipitate was formed. When the reaction time is prolonged to 15 min, the product consists of nanowires (Fig. 7a). There are a lot of interspaces between nanowires, and the width of nanowires is ∼50 nm (Fig. 7b). When the reaction time is 1 h, the spheres are formed as dominant product (Fig. 7c). The nanowires are converted into nanorods with width of ∼130 nm (Fig. 7d). The width of the nanorods is increased comparing to that of the nanowires obtained at 15 min. The generation of MnO2 is dominant during this stage, which result in the width of the nanorod to increase. As reaction time reaches 2 h, self-assembled mcirospheres with diameter of ∼2.5 μm are formed (Fig. 7e). The surface of sphere consists of nanowires with width of ∼50 nm (Fig. 7f). With the formation of the MnO2, the reaction between MnO2 and HCl enhanced. When the reaction rate of the HCl erosion is higher than that of the growth of MnO2, the width of MnO2 nanorods gradually decreased. When the reaction time arrives at 6 h, the diameter of microspheres reaches ∼5 μm (Fig. 7g). Magnified image shows that the close-packed nanowires tend to combine together at the top to form an increasing nanorod (Fig. 7h). After 10 h of hydrothermal treatment, the diameter of microspheres is up to ∼6 μm (Fig. 7i). Closer observation indicates that the increasing nanorods with width of ∼200 nm have been formed and the width of the nanorods at bottom is larger than that on top (Fig. 7j). When the reaction time is prolonged to 24 h, the widths of the nanorods tend to uniform from the bottom to top (Fig. 2a). The hollow spheres composed of two categories of nanorods are finally formed.
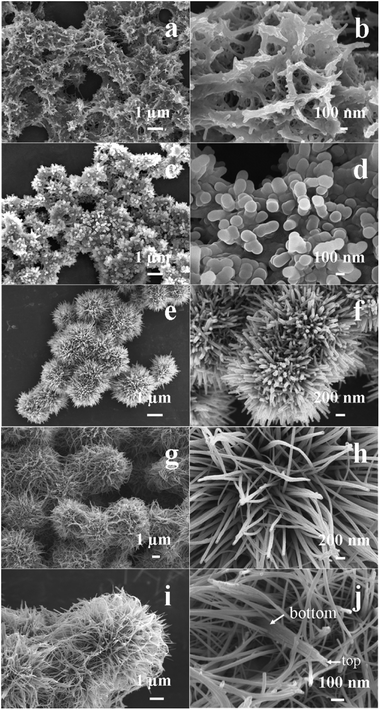 | ||
| Fig. 7 SEM images of the products obtained at 140 °C and at 15 min (a and b), 1 h (c and d), 2 h (e and f), 6 h (g and h) and 2 h (c and d), 6 h (e and f), and 10 h (i and j). | ||
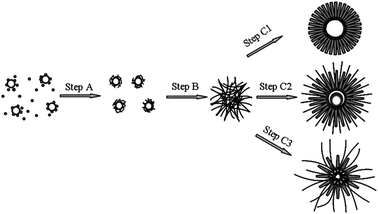
On the basis of the above observations, the formation process and mechanism of the hierarchical MnO2 could be proposed and illustrated by Scheme 1.
The hydrothermal chemical reactions in this system could be described as following:
| MnSO4 + K2S2O8 + 2H2O→MnO2↓+ K2SO4 + 2H2SO4 | (1) |
| MnO2 + 4HCl→MnCl2 + Cl2↑ + 2H2O | (2) |
In the initial stages of the reaction, the oxidation–reduction reaction (1) takes place firstly. Once the manganese oxide formed, reaction (2) would occur and then Cl2 microbubbles are created. Cl2 microbubbles could serve as an aggregation center and a self-generated soft-template. Driven by the minimization of interfacial energy, the small manganese oxide particles aggregate around the gas–liquid interface between the microbubbles, analogous to the case (step A) reported previously.30,31 These small clusters would serve as nuclei for MnO2 to grow into nanowires (step B).32,33 With the growth of nanowires, the close-packed nanowires tend to combine together on the top to form a increasing nanorod under oriented attachment function. At the same time, the eroding process starts the center of the microsphere because of the existence of a large amount of HCl and gas–liquid equilibrium.34 The nanowires located on the outside would serve as the starting points for the subsequent crystallization process and then the nanorods and nanowires grow larger and the hierarchical double-walled hollow structure is formed (step C). The morphology of the product is dependent on the competition between the growth of MnO2 and the HCl erosion, or in other word, the relative reaction rate of reaction (1) and (2). When the concentration of HCl and S2O82− ions is relatively high, it is difficult for the close-packing nanowires to combine together because of the abundance Cl2, which leads to the nanowires formed. The more Cl2 formed in the system, the more nanowire generated in the microsphere. Increasing the rate of reaction (2) is beneficial to form α-MnO2 nanowires and decreasing the relative rate of reaction (2) is helpful for the formation of β-MnO2 nanorods. Hierarchical hollow structure MnO2 could only be obtained in an appropriate relative rate of reaction (1) and (2). The results of the effect of the concentration of the precursor agree with the proposed mechanism. When the amount of S2O82− ions is 0.012 mol and the amount HCl is 2 mL (conditions for S1), the reaction is followed the step C1 in Scheme 1, leading to the formation of hierarchical structure consisting of β-MnO2 nanrods. When the amount HCl is up to 4 mL (conditions for S2), the reaction is followed the step C2 in Scheme 1, resulting in the formation of the hierarchical structure consisting of two kind nanorods with different width. When the amount of S2O82− ions is 0.012 mol is decreased to 0.006 mol (conditions for S3), the reaction is followed the step C3 in Scheme 1, inducing the formation of the hierarchical structure consisting of nanorods and nanowires.
To investigate the potential application of the samples for abatement of volatile organic compounds (VOCs), the sample S1, S2, S3 and S4 were examined as catalyst for the catalytic oxidation of benzene. As comparative experiments, the catalytic property of commercial MnO2 was also evaluated. The catalytic performance of these four samples for benzene oxidation is shown in Fig. 8. Fig. 8 is shown that the catalytic activities of the samples obtained in our experiments are clearly higher than commercial MnO2 and the catalytic abilities of the samples for benzene oxidation decrease with the order of hierarchical hollow α-MnO2 microspheres > hierarchical two-wall β/α-MnO2 microspheres > hierarchical hollow β-MnO2 microsphere > β-MnO2 nanorods > commercial MnO2. The products of catalytic reaction are only CO2 and H2O and the products from incomplete oxidation of benzene are not detected. The image of the commercial MnO2 is shown in Fig. S5,† indicating that the commercial MnO2 consists of agglomerated nanoparticles. Fig. S6† indicates the XRD pattern is complex and it can not be indexed to any type of pure manganese oxide, which indicated that the commercial MnO2 is a physical mixture. The purity of the commercial MnO2 is greater than 85 wt%, which can explain the complexity of the XRD pattern. The surface area of the commercial MnO2 is 5.956 m2 g−1. Low purity and low surface area may lead to their low catalytic ability. The results show that for the catalytic oxidation of benzene, the α-MnO2 has better catalytic ability than that of β-MnO2, and the hierarchical hollow structure also has better catalytic performance than that of nanorods with same crystal type (β-MnO2). The activity of the catalysts is associated with their crystalline structure, oxygen species, surface area, and morphology, etc. Usually, catalysts with a higher surface area show a better catalytic activity. However, surface area is not determinant factor.32 MnO2 can form several polymorphs because the [MnO6] octahedral units can be linked in different ways.36 The α-type is constructed from double chains of [MnO6] octahedra, which form [2 × 2] and [1 × 1] tunnels, while β-MnO2 have a [1 × 1] channel in the structure being composed of individual chain of the [MnO6] octahedral units.33,36 The longer diameter of the benzene is 0.27 nm, which is larger than [1 × 1] tunnels ([0.23 nm × 0.23 nm]). It is difficult for benzene to enter into the [1 × 1] tunnels. [2 × 2] ([0.46 nm × 0.46 nm]) tunnels are large enough for the accommodation of benzene. Therefore, both the active sites on the surface and in the tunnels of α-MnO2 are available for catalytic oxidation of benzene, while the active sites in tunnels of β-MnO2 are not available for catalytic oxidation of benzene. Hence, α-MnO2 offers more active sites than those of β-MnO2, resulting in higher catalytic ability for benzene oxidation. It is well-known that the catalytic activity of a transition metal oxide is associated with its defect nature and the concentration of oxygen species.35 XPS was employed to investigate the chemical state of oxygen. The O 1s spectra of all samples and the results were shown in ESI Fig. S3† and summarized in ESI Table S3,† respectively. The binding energies at 529–530 eV and 531–532 eV could be assigned to the lattice oxygen (Oα) and defective oxides or surface adsorbed oxygen (Oβ), respectively, while the binding energy higher than 533 eV is associated with adsorbed molecular water (Oγ).37–39 For the samples with β-type crystal structure, S1 has better catalytic performance than that of S4. The higher catalytic performance of S1 might be associated its higher Oα proportion than that of S4.40 The proportion of Oα in S2 is the highest among the samples, however, S2 does not display the highest catalytic activity for the benzene oxidation reaction. The crystal phase of S2 is a mixture of β- and α-type, and hence its catalytic ability is between S1 with β-type and S2 with α-type. The results indicate that the crystal phase of MnO2 is a dominating factor while the lattice oxygen only plays an assistant role in affecting the catalytic ability for the benzene oxidation. In order to investigate the stability of the catalyst, we carried out the catalytic ability cycle test of the most active catalyst (S3). The catalytic ability cycle test was carried out for four times under the catalyst test condition. Fig. S7† reveals that the XRD patterns of the catalyst after four catalyst cycles can be indexed to α-MnO2 (JCPDS 44-0141). The intensity of the peaks is increased after the four catalyst cycle, indicating the degree of crystallinity of the sample is increased. The SEM images and nitrogen adsorption–desorption isotherms of the catalyst after catalytic ability cycles were shown in Fig. S8 and S9,† respectively. Fig. S8† shows that the catalyst after four catalyst cycles consists of nanorods and nanowires. There is no obviously change in morphology of the catalyst. The surface area of the sample after catalytic ability cycle test is 39.84 m2 g−1, which is higher than that of S3. Fig. S9† indicates the pores of the catalyst shift to smaller size than that of S3. The results of the catalytic ability cycle were shown in Fig. S10,† which indicates the catalytic activity of S3 is slight decrease during second cycle. The catalytic activity of catalyst is little changed during third and fourth cycle. The results of the catalytic ability cycle test indicated that the stability of S3 is good.
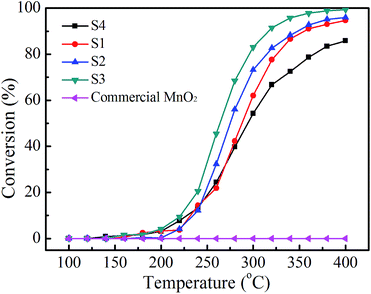 | ||
| Fig. 8 Activities of the sample S1 (black), S2 (red), S3 (blue), S4 (green) and commercial MnO2 (pink) in the catalytic oxidation of benzene. | ||
4 Conclusions
In summary, hierarchical hollow β-MnO2 microspheres consisting of nanorods, hierarchical double-walled hollow β/α-MnO2 microspheres assembled by two-categorical nanorods, and hierarchical hollow α-MnO2 microspheres constructed by nanorods and nanowires have been synthesized by a facile hydrothermal synthetic method. The crystal form and morphology of the product can be easily controlled by simply altering the concentration of the precursors. HCl is essential for the formation of hierarchical hollow microspheres. The significant factor for forming hierarchical hollow MnO2 was the relative rate of formation and consumption reaction of MnO2. The growth mechanism of hollow MnO2 spheres can be attributed to oriented attachment and etching process. The hierarchical hollow MnO2 microspheres have potential applications in VOC elimination. Their catalytic abilities for benzene oxidation decreased with the order of hierarchical hollow α-MnO2 microspheres > hierarchical two-wall β/α-MnO2 microspheres > hierarchical hollow β-MnO2 microspheres > β-MnO2 nanorods.Acknowledgements
We thank National High Technology Research and Development Program 863 of China (no. 2012AA062702) and Strategic Priority Research Program of the Chinese Academy of Sciences (Grant no. XDB0505000) for funding supports.Notes and references
- Q. P. Luo, X. Y. Yu, B. X. Lei, H. Y. Chen, D. B. Kuang and C. Y. Su, J. Phys. Chem. C, 2012, 116, 8111–8117 CAS.
- M. Y. Zhang, C. L. Shao, Z. C. Guo, Z. Y. Zhang, J. B. Mu, P. Zhang, T. P. Cao and Y. C. Liu, ACS Appl. Mater. Interfaces, 2011, 3, 2573–2578 CAS.
- S. Linley, T. Leshuk and F. X. Gu, ACS Appl. Mater. Interfaces, 2013, 5, 2540–2548 CAS.
- Z. Wei, R. Xing, X. Zhang, S. Liu, H. X. Yu and P. C. Li, ACS Appl. Mater. Interfaces, 2013, 5, 598–604 CAS.
- L. Zhang, H. B. Wu, S. Madhavi, H. H. Hng and X. W. Lou, J. Am. Chem. Soc., 2012, 134, 17388–17391 CrossRef CAS PubMed.
- Q. Q. Xiong, J. P. Tu, Y. Lu, J. Chen, Y. X. Yu, Y. Q. Qiao, X. L. Wang and C. D. Gu, J. Phys. Chem. C, 2012, 116, 6495–6502 CAS.
- S. W. Cao, Y. J. Zhu, M. Y. Ma, L. Li and L. Zhang, J. Phys. Chem. C, 2008, 112, 1851–1856 CAS.
- H. B. Wu, J. S. Chen, X. W. Lou and H. H. Hng, J. Phys. Chem. C, 2011, 115, 24605–24610 CAS.
- Z. Q. Li, Y. Ding, Y. J. Xiong, Q. Yang and Y. Xie, Chem. Commun., 2005, 918–920 Search PubMed.
- G. L. Wang, B. Tang, L. H. Zhuo, J. C. Ge and M. Xue, Eur. J. Inorg. Chem., 2006, 2006, 2313 CrossRef.
- Y. Wang, Q. W. Zhu, L. Tao and X. W. Su, J. Mater. Chem., 2011, 21, 9248 RSC.
- S. D. Jiang, Q. Z. Yao, G. T. Zhou and S. Q. Fu, J. Phys. Chem. C, 2012, 116, 4484 CAS.
- Y. F. Tang, L. Yang, J. Z. Chen and Z. Qiu, Langmuir, 2010, 26, 10111 CrossRef CAS PubMed.
- Y. Cheng, Y. S. Wang, C. Jia and F. Bao, J. Phys. Chem. B, 2006, 110, 24399 CrossRef CAS PubMed.
- Z. H. Wei, R. Xing, X. Zhang, S. Liu, H. H. Yu and P. C. Li, ACS Appl. Mater. Interfaces, 2012, 5, 598 Search PubMed.
- F. J. Shi, F. Wang, H. X. Dai, J. X. Dai, J. G. Deng, Y. X. Liu, G. M. Bai, K. M. Ji and C. T. Au, Appl. Catal., A, 2012, 433–434, 206 CrossRef CAS PubMed.
- S. C. Kim and W. G. Shim, Appl. Catal., B, 2010, 98, 180 CrossRef CAS PubMed.
- W. M. Chen, L. Qie, Q. G. Shao, L. X. Yuan, W. X. Zhang and Y. H. Huang, ACS Appl. Mater. Interfaces, 2012, 4, 3047 CAS.
- D. W. Su, H. J. Ahn and G. X. Wang, J. Mater. Chem. A, 2013, 1, 4845 CAS.
- M. Zhou, X. Zhang, J. M. Wei, S. L. Zhao, L. Wang and B. X. Feng, J. Phys. Chem. C, 2010, 115, 1398 Search PubMed.
- J. Cao, Q. H. Mao, L. Shi and Y. T. Qian, J. Mater. Chem., 2011, 21, 16210 RSC.
- J. B. Fei, Y. Cui, X. H. Yan, W. Qi, Y. Yang, K. W. Wang, Q. He and J. B. Li, Adv. Mater., 2008, 20, 452 CrossRef.
- B. X. Li, G. X. Rong, Y. Xie, L. F. Huang and C. Q. Feng, Inorg. Chem., 2006, 45, 6404 CrossRef CAS PubMed.
- P. Yu, X. Zhang, D. L. Wang, L. Wang and Y. W. Ma, Cryst. Growth Des., 2008, 9, 528 Search PubMed.
- P. Umek, A. Gloter, M. Pregelj, R. Dominko, M. Jagodič, Z. Jagličić, A. Zimina, M. Brzhezinskaya, A. Potočnik, C. Filipič, A. Levstik and D. Arčon, J. Phys. Chem. C, 2009, 113, 14798 CAS.
- J. G. Wang, Y. Yang, Z. H. Huang and F. Kang, Mater. Chem. Phys., 2013, 140, 643 CrossRef CAS PubMed.
- J. Wang, J. Liu, Y. Zhou, P. Hodgson and Y. Li, RSC Adv., 2013, 3, 25937 RSC.
- X. Fu, J. Feng, H. Wang and K. M. Ng, Nanotechnology, 2009, 20, 375601 CrossRef PubMed.
- D. Y. Li, X. F. Wu and Y. F. Chen, J. Phys. Chem. C, 2013, 117, 11040 CAS.
- Y. G. Zhang, L. Y. Chen, Z. Zheng and F. L. Yang, Solid State Sci., 2009, 11, 1265 CrossRef CAS PubMed.
- J. Z. Zhao, Z. L. Tao, J. Liang and J. Chen, J. Cryst. Growth Des., 2008, 8, 2799 CrossRef CAS.
- X. Wang and Y. D. Li, J. Am. Chem. Soc., 2002, 124, 2880 CrossRef CAS PubMed.
- X. Wang and Y. D. Li, Chem. Commun., 2002, 764 RSC.
- J. Z. Yin, Q. Y. Lu, Z. N. Yu, J. J. Wang, H. Pang and F. Gao, J. Cryst. Growth Des., 2009, 10, 40 CrossRef.
- F. Wang, H. X. Dai, J. Deng, G. M. Bai, K. M. Ji and Y. X. Liu, Environ. Sci. Technol., 2012, 46, 4034 CrossRef CAS PubMed.
- D. W. Su, H. J. Ahn and G. X. Wang, J. Mater. Chem. A, 2013, 1, 4845 CAS.
- T. Garcia, D. Sellick, F. Varela, I. Vázquez, A. Dejoz, S. Agouram, S. H. Taylor and B. Solsona, Appl. Catal., A, 2013, 450, 169 CrossRef CAS PubMed.
- H. F. Li, G. Z. Lu, Q. G. Dai, Y. Q. Wang, Y. Guo and Y. L. Guo, Appl. Catal., B, 2011, 102, 475 CrossRef CAS PubMed.
- P. P. Hu, Z. W. Huang, W. M. Hua, X. Gu and X. F. Tang, Appl. Catal., A, 2012, 437–438, 139 CAS.
- V. P. Santos, M. F. R. Pereira, J. J. M. Órfão and J. L. Figueiredo, Appl. Catal., B, 2010, 99, 353 CrossRef CAS PubMed.
Footnote |
| † Electronic supplementary information (ESI) available: EDS analyses, nitrogen adsorption–desorption isotherms, pore characterizations, XRD patterns, SEM images, XPS spectra and results of the nanostructures in this study. See DOI: 10.1039/c4ra01146e |
| This journal is © The Royal Society of Chemistry 2014 |

