Simultaneous determination of a broad range of cardiovascular drugs in plasma with a simple and efficient extraction/clean up procedure and chromatography-mass spectrometry analysis

Lei Liua, Yabin Wenb, Kangning Liua, Liang Suna, Yaxin Lu*a and Zheng Yin*a
aCollege of Pharmacy & State Key Laboratory of Elemento-Organic Chemistry, Nankai University, No. 94 Weijin Road, Tianjin 300071, PR China. E-mail: yaxinlu@nankai.edu.cn; zheng_yin@nankai.edu.cn; Fax: +86 22 23507760; Tel: +86 22 23500963
bCollege of Life Science, Nankai University, Tianjin 300071, PR China

Received 6th February 2014 , Accepted 10th April 2014

First published on 11th April 2014


Abstract

A simple, easy to use and efficient method was described for simultaneous determination of ten cardiovascular drugs with a broad range of physicochemical properties in rat plasma via online solid phase extraction (online SPE) and high-performance liquid chromatography-tandem mass spectrometry (HPLC-MS/MS). Following a simple centrifugation step, a 10 μL aliquot of the plasma sample was injected directly onto the HPLC system. The LiChrospher® RP-18 ADS (25 mm × 4 mm, 25 μm, Merck) cartridge was washed with 10 mM ammonium acetate buffer (pH 9.5) for 1 min, after which time the analytes were removed by back-flushing directly onto the analytical column (Acclaim 120 C18 column, 150 mm × 4.6 mm, 5 μm) with gradient elution using acetonitrile–10 mM ammonium acetate buffer (pH 3.5) as mobile phase. The flow rate through both columns was 1 mL min−1, and the analytes were quantified using a triple-quadrupole tandem mass spectrometer in multiple-reaction monitoring mode. Linear calibration curves were obtained over the range of 0.2–100 ng mL−1, and the method limits ranged from 0.2 ng mL−1 to 1 ng mL−1 which is sensitive enough for clinical drug monitoring. The intra- and inter-day precisions were in the range of 0.20–2.32%, and the accuracies were between 93.33% and 114.60%. Excellent recoveries from plasma were achieved with a range from 83.52% to 107.38%. The procedure was easier to execute and required less sample handling than methods previously described in the literature. This easy to use and high-throughput method with direct injection of plasma samples for the analysis of multiple cardiovascular drugs may provide a practical solution for tailoring drug dosage in a rational manner to rapidly achieve optimal efficacy and safety of medication.

Introduction

Cardiovascular diseases are common and usually progressive disorders all over the world.1 If they are not effectively treated, a high mortality is likely to result from several risk factors such as high blood pressure, coronary thrombosis, strokes and renal failure, etc. In order to prevent and treat the disorders, a combined cardiovascular therapy with drugs that have different targets and mechanisms of action to regulate several factors separately, should be taken into consideration.2 The success of the treatment depends on not only selecting the proper medication but also tailoring the appropriate dosage of the drugs. It is one of the ultimate goals for the treatment of cardiovascular diseases to rapidly customize the combinational therapy at an accurate dosage that is optimal for an individual patient with the potential benefits of increasing the efficacy and safety of medications. However, age, gender, weight, and genetic variations of an individual have significant impact on the drug disposition that is closely related to the efficacy and safety of medications. Ideally, the drug disposition of an individual can be determined at the early stage of the chronic treatment so as to adjust the dosage in a rational manner. However, it is still rare to do so in clinical practice. The real-life challenge is how to enable simple, fast, and highly sensitive simultaneous analysis of multiple drugs in clinical environment.

Chromatography techniques that are often well established as reference methods have long been used for drug analysis in complex biological matrices because of its sensitivity.3 Biological samples such as plasma contain proteins, lipids, salts and many other substances that may interfere with the analysis of the drugs. Thus, sample pretreatment is required to remove most of the biological matrix in order to make the sample compatible with chromatographic analysis. Conventionally, sample pretreatment has been performed using protein precipitation (PPT), liquid–liquid extraction (LLE), membrane filtration and off-line solid phase extraction (SPE).4 Sample pretreatment is the labor-intensive, time-limiting step in bioanalytical process, typically taking 80% of the total analysis time and involving intensive manual process.5 The corresponding improvements of many conventional methods have not met the measurement criteria of high-throughput analysis yet. Even though several high-performance liquid chromatography (HPLC) based approaches have been developed for quantitative determination of many drugs in biological fluids, the inherent characteristics such as time-consuming, labor intensive, error-prone and costly are still the barriers, primarily caused by the complex manual pretreatment steps to eliminate the complex sample matrix.6–11 Indeed, sample pretreatment limits the involvement of drug disposition of individuals into decision process of drug dosage in clinical settings.

Optimization of the clean-up of complex matrix in biological fluids, with aim to enable high sample throughput, achieve total automated procedure, reduce the cost and improve overall analytical quality, has attracted considerable attention. The fully automated online SPE-HPLC technique, which integrating the biological fluids clean-up process with bioanalysis instrumentally, has been widely applied to remove the interfering matrix substances.12–17 A typical on-line SPE procedure is generally carried out as follows: after a direct injection of biological fluids into the instrumentation, the samples are loaded onto a SPE cartridge where the analytes are trapped while the unretained matrix components are flushed to waste. By rotation of the switching valve, the analytes are eluted and transferred to the analytical column for their chromatographic separation consequently. Compared to conventional HPLC methods, it possesses many alternative advantages, including lower cost and solvent consumption, less volume of samples, less equipments and sample transfer steps, higher extraction recovery and accuracy, faster data processing, enhanced safety, etc.

Treatment of cardiovascular diseases usually involves a combination of several drugs with different physicochemical properties. Various analytical methods including HPLC-UV, LC-MS, GC-MS, capillary electrophoresis (CE), etc. have been developed for the simultaneous determination of the cardiovascular drugs in biological fluids.18–25 Several methods have been published for simultaneously determination of cardiovascular drugs. An ion chromatography with direct conductivity detection method was developed for the determination of salbutamol, clorprenaline and clenbuterol with lower limit of quantification (LLOQ) of 34 ng mL−1, 8 ng mL−1 and 25 ng mL−1, respectively.26 However, it was still not sensitive enough for the determination of these cardiovascular drugs in biological sample. Mazzarino et al. determined 44 compounds including stimulants, narcotics and beta-adrenergic agents in human urine by hydrophilic interaction liquid chromatography coupled to mass spectrometry.27 The LLOQs were more than 100 ng mL−1 since the excessive dilution step in LLE procedure and high organic mobile phase used limited its application on bioanalysis of high protein content samples. An LC-MS/MS method was developed for the quantitation of 55 compounds prescribed in combined cardiovascular therapy.28 The reported method was sensitive enough for clinical drug monitoring, but significant matrix effect originated from PPT led to too much deviation of quantitative results.

The analysis of these multiple substances with different physicochemical properties and physiological behavior in clinical settings still remains to be a challenging task due to the following reasons: (1) there is limited research on the extraction and clean up procedure development for multiple drugs with different physicochemical properties though significant progress has been made in automated online SPE-HPLC for bioanalysis of drug in biological matrix. The challenge falls on developing a robust sample pretreatment process adequate for all the analytes but selective and sensitive enough to reduce as much as possible the matrix effects. (2) The broad concentration variations of different analytes (from micrograms to nanograms) in biological fluids pose another challenge for simultaneous determination of multiple drugs. (3) The bioanalytical process has to be simple, easy to use, robust and fast enough for its application in clinical settings. Therefore, simultaneous determination of a broad range of cardiovascular drugs in plasma with a simple and efficient extraction/clean up procedure and chromatography-mass spectrometry analysis may provide a practical solution for tailoring drug dosage in a rational manner to rapidly achieve optimal efficacy and safety of medication. This study aimed to develop a simple, easy to use, efficient and fully automated online SPE HPLC-MS/MS method to simultaneously determine multiple drugs in plasma. The method was optimized by making use of rat plasma instead of human plasma. Ten of most commonly prescribed cardiovascular drugs with wide range of physicochemical properties (i.e., molecular weight, log[thin space (1/6-em)]P, pKa, etc.) have been chosen for this study. The drugs chosen in this study were composed of carteolol, carvedilol, clenbuterol, clorprenaline, ephedrine, mexiletine, propafenone, propranolol, salbutamol, and timolol. This method features with a simple and efficient extraction/clean up procedure allowing the direct and multiple injections of biological fluids.

Experimental

Reagents and chemicals

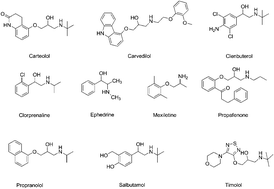
Reference standards of carteolol, carvedilol, clenbuterol, clorprenaline, ephedrine, mexiletine, propafenone, propranolol, salbutamol, and timolol were purchased from the National Institute for the Control of Pharmaceutical and Biological Products (Beijing, China), their chemical structures and physicochemical parameters are shown in Fig. 1 and Table 1. Acetonitrile and ethanol (HPLC grade) were purchased from Tedia (Newark, DE, USA). Acetic acid and ammonium acetate were purchased from ROE scientific Inc. (Newark, DE, USA). All aqueous solutions were prepared with ultra pure water produced from a Milli-Q50 SP Reagent Water System (Bedford, MA, USA). Other reagents were of analytical grade or higher if not otherwise stated.
image file: c4ra01045k-f1.tif
Fig. 1 Chemical structures of the analytes.
Table 1 Physicochemical parameters of the analytes
Analyte C[thin space (1/6-em)]log[thin space (1/6-em)]P Molecular weight H acceptors H donors H donor/acceptor sum pKa (most acidic) pKa (most basic) PSA (A2)
Salbutamol 0.06 239.31 4 4 8 9.99 9.62 72.70
Carteolol 1.21 292.37 5 3 8 13.84 9.52 70.60
Ephedrine 0.89 165.23 5 4 9 8.73 9.43 81.60
Timolol 1.29 316.42 7 2 9 13.38 9.35 108.00
Clorprenaline 2.13 213.7 2 2 4 13.60 9.22 32.30
Clenbuterol 2.39 277.13 3 4 7 13.29 9.51 58.30
Mexiletine 2.57 179.26 2 2 4 13.25 8.58 35.30
Propranolol 2.75 259.34 3 2 5 13.84 9.50 41.50
Propafenone 3.64 341.44 4 2 6 13.82 9.31 58.60


Plasma

Drug-free heparinised rat plasma was collected from male Sprague-Dawley rats (body weight: 220–250 g) obtained from the Laboratory Animal Center, Academy of Military Medical Science (Beijing, China). The animal facilities and protocols were approved by the Institutional Animal Care and Use Committee of Nankai University. All procedures were carried out in accordance with the Guidelines for Animal Experimentation of Nankai University (Tianjin, China).

Preparation of calibration work solutions and quality control samples

The stock solutions of the reference standards were prepared by dissolving requisite amount of each sample in acetonitrile–water (1[thin space (1/6-em)]:[thin space (1/6-em)]1, v/v) at a high concentration (1 mg mL−1). Different volumes of each stock solution were transferred into volumetric flasks and then diluted to volume to make working standard solutions with acetonitrile–water (1[thin space (1/6-em)]:[thin space (1/6-em)]1 v/v). Calibration standards were prepared by spiking the diluted working standard solutions into blank rat plasma (10/90, v/v) to give final concentrations ranged from 0.2 ng mL−1 to 20 ng mL−1 for carvedilol and propafenone, 0.4 ng mL−1 to 40 ng mL−1 for clenbuterol and salbutamol, 1 ng mL−1 to 100 ng mL−1 for carteolol, clorprenaline, ephedrine, mexiletine, propranolol and timolol, respectively.

Quality control (QC) samples including lower limit of quantification (LLOQ), QC low (QCL), QC middle (QCM) and QC high (QCH) of 0.2, 2 and 20 ng mL−1 for carvedilol and propafenone, 0.4, 4 and 40 ng mL−1 for clenbuterol and salbutamol, 1, 10 and 100 ng mL−1 for carteolol, clorprenaline, ephedrine, mexiletine, propranolol and timolol, respectively, were also prepared as the same procedure as the calibration standards. All samples were stored at 4 °C until LC-MS analysis.

Instrumentation

This automated method is unique in that it interfaces the UltiMate 3000 × 2 Dual-Gradient HPLC system (Sunnyvale, CA, USA) to the Applied BioSystems API 4000+ triple quadrupole mass spectrometer (Ontario, Canada), thereby these two instruments function as a single unified system (Fig. 2). HPLC analysis was carried out on the UltiMate 3000 × 2 Dual-Gradient HPLC system equipped with a SRD-3600 degasser, a DGP-3600SD pump, a WSP-3000TSL analytical autosampler, a TCC-3000RS column compartment (refrigerated storage compartment, maintained at 12 °C) and a DAD-3000 diode array detector. An API 4000+ triple quadrupole mass spectrometer with an electrospray ionization source (ESI) interface operated in the positive ion mode was used for the multiple-reaction monitoring (MRM) LC-MS/MS analysis. The mass spectrometric conditions were optimized for the analytes by infusing a 100 ng mL−1 standard solution in acetonitrile–water (50[thin space (1/6-em)]:[thin space (1/6-em)]50, v/v) at 10 μL min−1, with a Harvard infusion pump directly connected to the mass spectrometer. Data were processed by Analyst 1.6 software (Toronto, Canada). A Universal 320R-refrigerated centrifuge equipped with a swing out rotor (12-place, 5000 rpm, Cat. no. 1628A) from Hettich (Kirchlengern, Germany) was employed in the plasma sample preparation.
image file: c4ra01045k-f2.tif
Fig. 2 The schematic diagram of online SPE HPLC-MS/MS system.

Online SPE condition

An online SPE methodology was applied to pre-treat the sample, by using a SPE cartridge LiChrospher® RP-18 ADS (25 mm × 4 mm, 25 μm) from Merck (Darmstadt, Germany). Acetonitrile–10 mM ammonium acetate buffer (pH 3.5) (1[thin space (1/6-em)]:[thin space (1/6-em)]99, v/v) was the washing solvent.

The system setup for online SPE was constructed with three steps (Fig. 2). In the first step (loading), 10 μL of plasma sample was loaded onto the SPE cartridge using a WSP-3000 TSL analytical autosampler. The SPE cartridge was fitted into loading position of Valco 6-port switching valve. The loading pump (right pump) was used to load the plasma sample onto the SPE cartridge, and the biological matrix was flushed to waste for 1 min with the washing solvent (acetonitrile–10 mM ammonium acetate buffer (pH 3.5) (1[thin space (1/6-em)]:[thin space (1/6-em)]99, v/v)) at a flow rate of 1 mL min−1, while the analytes were retained on the stationary phase of the SPE cartridge. Simultaneously the analytical column was equilibrated with the chromatographic pump (left pump). In the second step (injection), the Valco 6-port switching valve was switched to injection position that coupled the SPE cartridge with the analytical column, in which the analytes were eluted from the SPE cartridge in the back-flush mode and transferred to the analytical column for 5 min by the chromatographic mobile phase consisted of linear gradient elution. In the last step (separation), the analytes were separated in the analytical column for 5 min with the chromatographic mobile phase consisted of acetonitrile–10 mM ammonium acetate buffer (pH 3.5) eluting under the gradient conditions reported in Fig. 2. The duration of the online SPE loading step and chromatographic separation of the analytes was 11 min.

HPLC-MS/MS

The chromatographic separation was performed on an Acclaim 120 C18 column (150 mm × 4.6 mm, 5 μm, i.d.; Dionex, USA) with the column temperature set at 30 °C. The mobile phase consisted of acetonitrile–10 mM ammonium acetate buffer (pH 3.5) at a flow rate of 1 mL min−1. The operating parameters in ESI mode were: curtain gas 10 psi, GAS1 50 psi, GAS2 60 psi, ionspray voltage 5500 V, source temperature 500 °C, and CAD gas 5 (arbitrary units). Each analyte was optimized for Q1 selection, fragmentation, and Q3 selection using declustering potential (DP), entrance potential (EP), collision energy (CE) and collision cell exit potential (CXP). Multiple reaction monitoring (MRM) was used with two transitions for each analyte. The MRM transitions, DP, EP, CE, and CXP are listed in Table 2.
Table 2 Optimized MS/MS parameters of the analytesa
Analyte Retention time (min) Q1 (m/z) Q3 (m/z) DP (V) EP (V) CE (V) CXP (V)
a Abbreviations: Q1: precursor ion, Q3: fragment ion, DP (declustering potential), EP (entrance potential), CE (collision energy), and CXP (collision cell exit potential). For each species, the most sensitive transition, marked as “a”, was used for quantitation (quantifier) and the second one was used for confirmation (qualifier).
Salbutamola 4.84 240.1 147.9 40 10 25 10
Salbutamol 4.84 240.1 166.0 45 10 20 11
Carteolola 5.12 292.9 202.0 60 10 30 13
Carteolol 5.12 292.9 237.0 60 10 22 16
Ephedrinea 5.17 166.0 148.0 45 10 15 10
Ephedrine 5.17 166.0 132.9 45 10 25 8
Timolola 5.35 316.9 261.1 60 10 23 18
Timolol 5.35 316.9 243.9 60 10 30 16
Clorprenalinea 5.59 213.9 154.0 50 10 25 10
Clorprenaline 5.59 213.9 195.9 50 10 17 13
Clenbuterola 5.72 276.9 202.9 50 10 22 14
Clenbuterol 5.72 276.9 259.0 50 10 15 18
Mexiletinea 5.77 180.0 58.0 50 10 20 11
Mexiletine 5.77 180.0 162.9 50 10 15 11
Propranolola 5.77 259.9 182.9 60 10 25 12
Propranolol 5.77 259.9 116.1 60 10 25 7
Propafenonea 7.19 342.0 116.0 70 10 30 12
Propafenone 7.19 342.0 98.1 70 10 30 10


Validation procedures

Selectivity. The chromatographic interference from endogenous materials or other sources was estimated by comparing chromatograms of upper limit of quantification (ULOQ), LLOQ and drug-free rat plasma, and analyzed according to the described procedures. Responses of the analytes at the ULOQ and LLOQ concentrations were compared with the response of the blank samples.
LLOQ and linearity. Decreasing concentrations of the analytes were injected into the analytical system to determine the minimal concentration with a signal-to-noise ratio (S/N) of at least 5[thin space (1/6-em)]:[thin space (1/6-em)]1, adequate precision with coefficient of variation (CV) less than 20% and accuracy within 20% of the nominal value (i.e., accuracy between 80 and 120%) for each run analysis. The standard calibration curves were constructed using the peak area of each analyte versus the nominal concentrations of the eight plasma standards in triplicate. Linear least-square regression analysis, with weighting factor of 1/x2, was performed to assess the linearity, as well as to generate the standard calibration equation: y = ax ± b, where y is the peak area, x the concentration, a the slope and b is the intercept of the regression line.
Accuracy and precision. The intra-day accuracy and precision were evaluated by repeated analysis of QC samples at QCL, QCM and QCH levels from five replicates on the same day, while the inter-day accuracy and precision were evaluated on three independent days. Accuracy was determined by calculating the percentage bias from the nominal concentration. Precision was assessed by calculating the CV for each replicates. The acceptable criteria of data induced accuracy within ±15% bias from the nominal values and a precision within ±15% relative standard deviation (RSD).
Extraction recovery and matrix effect. The extraction recovery and matrix effect were assessed according to the procedure described by Matuszewski et al.29 Both parameters were evaluated by comparing the mean area response of three sets of solutions at each QC level. The extraction recoveries of the analytes from plasma were determined by comparing the mean area response of extracted samples (spiked before SPE extraction) to that of unextracted samples (spiked after SPE extraction) at each QC level. As per the acceptance criteria, recovery should be consistent, precise and reproducible. The matrix effect of the analytes was assessed by comparing the mean area response of unextracted samples (spiked after SPE extraction) with mean area of neat standard solutions. Since the extraction method included an online extraction step, the unextracted samples were injected directly in the mass spectrometer, bypassing the online extraction cartridge. It was considered negligible if values below ±15% were observed. The value of matrix effect less than 85% represented ionization suppression, while more than 115% represented ionization enhancement.
Carryover. One fundamental drawback inherent to online-SPE is the risk of carryover.30 The carryover was tested by injecting processed blank plasma samples sequentially after injecting the highest concentration calibration standard. The response in the first blank plasma at the retention times of analytes was compared with the mean response of LLOQ samples. The acceptable criteria of data induced carryover within 20% the response of LLOQ.31 During rat plasma sample analysis, the injection order was set to proceed from low to high concentrations to minimize the carry over.

Results and discussion

Method development

Optimization of SPE procedure. The online SPE procedure was optimized to achieve high extraction recovery of the analytes in rat plasma. Four kinds of commercial SPE cartridges including Waters Oasis MCX, Waters Oasis HLB, LiChrospher RP-18 ADS and CAPCELL PAK MF Ph-1 were evaluated for the retention of all analytes. CAPCELL PAK MF Ph-1 showed weak retention for the compounds with high polarity (i.e., salbutamol). Waters Oasis HLB exhibited general retention but poor resolution for the analytes when compared with the extraction efficiency of Waters Oasis MCX cartridge. LiChrospher RP-18 ADS and Waters Oasis MCX cartridge showed the similar trapping efficiency for the analytes. However, the chromatographic peaks eluted by Waters Oasis MCX cartridge showed serious tailing factors (Fig. 3a). Eventually LiChrospher RP-18 ADS cartridge was chosen in present study not only for its robustness and long lifetime with high protein content samples and high aqueous mobile phase, but also for its specificity for basic drug with general chromatographic condition. Additionally, it also allowed back flush in the injection step. The procedure requires online elution of the plasma sample from the SPE cartridge onto the analytical column. Consideration must be taken for the SPE elution time, SPE flow rate, elution solvent concentration, LC flow rate and mobile phase. A successful method involves elution of all the analytes at the head of the analytical column without any band broadening. Liquid chromatographic conditions such as stationary phase, the composition and pH value of washing solvent that could greatly influence the separation and retention of the analytes were investigated. Different washing solvent (methanol–water, acetonitrile–water, ammonium acetate buffer, methanol–ammonium acetate buffer and acetonitrile–ammonium acetate buffer) were examined. Ten mM ammonium acetate buffer (pH 9.5) achieved the most satisfied extraction of all analytes. It not only avoided precipitation of the drugs in the SPE cartridge, but also trapped the highly polar drug with the proportion of acetonitrile less than 2% in the washing solvent. Excellent trapping efficiency was obtained when the column temperature was kept at 30 °C at a flow rate of 1 mL min−1 by isocratic elution of acetonitrile–10 mM ammonium acetate buffer (pH 9.5) (1/99, v/v).
image file: c4ra01045k-f3.tif
Fig. 3 MRM chromatograms of the analytes using different SPE cartridges: (a) using online Waters Oasis MCX cartridge-LC-MS, (b) using online LiChrospher RP-18 ADS-LC-MS.
Optimization of the interaction parameters of SPE procedure and chromatographic separation. The optimization of the matrix depletion time (Tm), analyte break-through time (Ta) and transfer time (Tt) was an important part to set up an instrument control program before starting the online SPE-HPLC wizard. Tm was the time required at a given flow rate of 1 mL min−1 to completely elute the sample matrix from the SPE cartridge. Ta was the time required at a given flow rate of 1 mL min−1 for the analytes to start to elute from the SPE cartridge. Tt was the time required at a given flow rate of 1 mL min−1 to completely elute the analytes from the SPE cartridge and to transfer them to the analytical column. Such tests were performed by directly connecting the SPE cartridge to the UV detector. After injection of 10 μL blank plasma spiked with the analytes, the elution profile of the sample matrix was recorded (i.e. the UV detector set at a wavelength of 280 nm was appropriate to monitor the protein matrix). Complete elution of the matrix was obtained (Tm = 0.8 min) when the detector signal reached the baseline again. Subsequently, Ta (1.0 min) was marked after the complete elution of the matrix. To ensure the complete extraction and recovery of the analytes, Ta should be greater than Tm. In order to determine the Tt, a mixed solution of the analytes was injected onto the SPE cartridge. The Valco 6 port switching valve was switched and the mobile phase delivered by the left pump eluted the analytes from the SPE cartridge to the detector. Because the extracted analytes were retained at the head of the SPE cartridge, reversal of the flow direction (back flushing) reduced the time required to transfer the analytes from the SPE cartridge to the analytical column. As obtained from this trial, the optimal Tt was achieved within 5 min when the column temperature was kept at 30 °C at a flow rate of 1 mL min−1 by linear gradient elution of acetonitrile from 1% to 48.5% to transfer all the analytes to the analytical column.
Optimization of chromatographic conditions. Similarly, the optimization of chromatographic condition including stationary phase, the composition and pH value of mobile phase, column temperature and flow rate was investigated as the same as online-SPE procedure. With regards to the chromatographic separation of the analytes, the search for a more suitable column became challenging, because one endogenous peak interfered with propafenone was very difficult to separate. Eventually an Acclaim 120 C18 column (150 mm × 4.6 mm, 5 μm, i.d.; Dionex, USA) was chosen in the present study for its high efficiency, significant improvement in the peak symmetry and long lifetime (more than 2000 plasma samples tested on this column). The aqueous phase of mobile phase was 10 mM ammonium acetate buffer (pH 3.5), which could provide the best buffer capacity and avoid drifting of the chromatographic baseline. Linear gradient elution of acetonitrile–10 mM ammonium acetate buffer (pH 3.5) was performed to obtain efficient chromatography and a short run time for the analytes to ensure high-throughput, high sensitivity and minimizing the matrix effect as well as maintaining good peak shapes. Addition of acetonitrile could remarkably improve the peak shape of all analytes. Correspondingly, owing to the high polarity of salbutamol, better separation and less interference from other components in the plasma were achieved by using acetonitrile–10 mM ammonium acetate buffer (pH 3.5) (1/99, v/v) as the initial condition. It was also found that the best separation and optimum analytical speed were obtained when linear gradient elution was performed and column temperature was kept at 30 °C using a flow rate of 1.0 mL min−1.
Optimization of mass spectrometric conditions. The analytes were previously subjected to a MS/MS characterization study using ESI positive ion mode to identify the fragmentation patterns formed under increasing CE. The experiments were carried out for direct infusion (flow rate of 10 μL min−1) of 100 ng mL−1 solutions of each analyte, with the analytical mobile phase as the solvent. The selectivity of several MRM transitions should be carefully compared for the analysis of the analytes in biological matrix, as interferences may also be misleading when optimizing chromatography for a given analyte. All the analytes presented many transitions in the present study: for each analyte, the most intense transition was used for the quantitative analysis and was referred to as the “quantifier” transition, while the second one (the “qualifier” transition) was employed in the identification step, as a confirmation. The “quantifier” and “qualifier” transitions and instrumental potential values for each compound are reported in Table 2. At the end, maximum abundance of the protonated molecules of the compounds and acquisition parameters were investigated.

Method validation

Selectivity. In MRM mode, the specific voltage, i.e. declustering potential (DP), entrance potential (EP), collision energy (CE) and collision cell exit potential (CXP), at the optimum value was set to provide the best sensitivity and selectivity for each analyte, whereas ion discrimination was not possible by monitoring isotopic ions and fragment ions in addition to the major precursor ions. In this case, the signal intensity of major precursor ions was maximized, the possible isotopic ions and fragment ions could not interfere with the major precursor ions. In the present study, the chromatograms of the blank plasma and the spiked plasma sample with all analytes were represented in Fig. 4. No interference from endogenous materials or other source was found at the same retention time as the analytes, which indicated that the elaborated procedure was specified and selective.
image file: c4ra01045k-f4.tif
Fig. 4 Representative MRM chromatograms of the analytes: (A) blank plasma sample, (B) blank plasma sample spiked with the analytes at LLOQ, and (C) blank plasma sample spiked with the analytes at ULOQ (1 Salbutamol, 2 Carteolol, 3 Ephedrine, 4 Timolol, 5 Clorprenaline, 6 Clenbuterol, 7 Mexiletine, 8 Propranolol, 9 Carvedilol, 10 Propafenone).
Linearity and LLOQ. The method was linear over the concentration range of each analyte (r > 0.99). The mean values of linear regression equation of the analytes were listed in Table 3. The LLOQ plasma samples independent of the calibration standards were analyzed. S/N > 10 at the LLOQ was observed for all the analytes, the lowest value of LLOQ was 0.2 ng mL−1, while the highest value was 1 ng mL−1.
Table 3 Regression data and LLOQ of the analytes
Analyte LLOQ (ng mL−1) Linear range (ng mL−1) Slope Intercept R2
Salbutamol 10.0 10.0–1000.0 157 38.7 0.9953
Carteolol 2.0 2.0–200.0 747 11.9 0.9921
Ephedrine 10.0 10.0–1000.0 131 32.1 0.9945
Timolol 2.0 2.0–200.0 946 15.1 0.9943
Clorprenaline 5.0 5.0–500.0 1950 30.8 0.9965
Clenbuterol 0.5 0.5–50.0 2760 87.7 0.9923
Mexiletine 0.5 0.5–50.0 6000 87.6 0.9982
Propranolol 0.2 0.2–20.0 7510 13.8 0.9935
Propafenone 0.2 0.2–20.0 2280 35.8 0.9974


Precision and accuracy. The intra-day and inter-day precisions and accuracies of the QC samples are presented in Table 4. The RSD of QC samples were in the range of 0.20–2.32%, and the accuracies were between 93.33% and 114.60%. The results, which were within the acceptable criteria for accuracy and precision, allowed the accurate assay of the analytes in rat plasma.
Table 4 Precision and accuracy for the analytes in rat plasma (n = 15, 5 replicates per day for 3 days)
Analyte Norminal concentration (ng mL−1) Intra-day Inter-day
Concentration found (ng mL−1) Accuracy (%) RSD (%) Concentration found (ng mL−1) Accuracy (%) RSD (%)
Mean SD Mean SD
Salbutamol 20.0 18.83 0.22 94.15 1.17 18.81 0.41 94.05 2.16
200.0 197.48 1.96 98.74 0.99 194.10 1.61 97.05 0.83
1000.0 985.80 6.01 98.58 0.61 984.70 19.20 98.47 1.95
4.0 3.97 0.08 99.25 1.91 3.76 0.09 94.10 2.49
Carteolol 40.0 39.57 0.32 98.93 0.82 38.86 0.42 97.16 1.07
200.0 197.02 2.17 98.51 1.10 194.72 4.44 97.36 2.28
20.0 18.86 0.31 94.30 1.64 19.09 0.44 95.43 2.30
Ephedrine 200.0 194.62 1.60 97.31 0.82 194.54 2.26 97.27 1.16
1000.0 987.20 11.06 98.72 1.12 987.70 20.94 98.77 2.12
4.0 3.82 0.05 95.45 1.41 3.79 0.08 94.65 2.15
Timolol 40.0 38.94 0.33 97.35 0.84 38.91 0.40 97.27 1.04
200.0 197.70 2.25 98.85 1.14 197.62 5.08 98.81 2.57
10.0 9.50 0.23 94.95 2.47 9.70 0.25 96.95 2.62
Clorprenaline 100.0 100.35 0.57 100.35 0.57 97.93 1.04 97.93 1.06
500.0 514.75 3.50 102.95 0.68 500.40 11.71 100.08 2.34
1.0 0.99 0.02 98.59 1.93 0.97 0.03 96.85 2.76
Clenbuterol 10.0 9.88 0.08 98.84 0.80 9.44 0.15 94.39 1.56
50.0 49.70 0.80 99.39 1.60 48.81 0.88 97.62 1.81
1.0 0.95 0.01 95.19 1.16 0.95 0.03 95.10 3.23
Mexiletine 10.0 9.68 0.11 96.83 1.11 9.55 0.17 95.54 1.73
50.0 48.39 0.84 96.78 1.73 48.73 0.63 97.46 1.29
0.4 0.38 0.01 94.21 2.02 0.38 0.01 94.27 3.69
Propranolol 4.0 3.94 0.03 98.52 0.80 3.86 0.17 96.60 4.46
20.0 19.81 0.23 99.03 1.17 19.45 0.40 97.26 2.08
0.4 0.38 0.01 96.00 1.46 0.37 0.01 93.53 1.83
Prapofenone 4.0 3.86 0.04 96.60 0.91 3.83 0.07 95.83 1.89
20.0 19.69 0.24 98.46 1.20 19.52 0.39 97.59 2.02


Extraction recovery and matrix effects. Due to its selectivity and sensitivity, LC-MS/MS is a good choice for bioanalytical analysis. However, matrix effect and recovery have recognized as the challenges for developing LC-MS/MS methods for analysis of biological fluids. The extraction recoveries of the QC samples are presented in Table 5. The recovery ranged from 83.52% to 107.38%, which indicated that the overall extraction recovery of online SPE was efficient, consistent and reproducible.
Table 5 Matrix effect and extraction recovery for the analytes in rat plasma (n = 3)
Analyte Nominal concentration (ng mL−1) Matrix effect (%) Extraction recovery (%)
Mean SD RSD (%) Mean SD RSD (%)
Salbutamol 20.0 92.18 3.66 3.97 96.15 5.34 5.55
200.0 94.53 2.72 2.88 97.43 2.49 2.56
1000.0 95.64 3.01 3.15 97.36 4.92 5.05
4.0 90.03 3.73 4.14 95.21 2.47 2.59
Carteolol 40.0 91.25 3.01 3.30 99.07 3.81 3.84
200.0 92.26 2.82 3.06 96.22 9.23 9.59
20.0 91.68 3.43 3.74 95.56 5.41 5.66
Ephedrine 200.0 92.31 3.32 3.60 96.69 2.36 2.44
1000.0 93.47 4.01 4.29 96.04 4.81 5.01
4.0 90.83 3.98 4.38 95.77 2.54 2.65
Timolol 40.0 92.24 4.42 4.79 96.47 6.26 6.49
200.0 92.85 3.19 3.44 96.16 4.47 4.65
10.0 91.24 3.79 4.15 94.36 5.72 6.06
Clorprenaline 100.0 92.05 3.24 3.52 96.13 5.35 5.56
500.0 92.31 3.27 3.54 96.45 4.51 4.68
1.0 91.66 3.38 3.69 93.14 3.60 3.86
Clenbuterol 10.0 93.87 2.92 3.11 94.63 6.15 6.50
50.0 93.06 3.56 3.83 94.24 6.52 6.92
1.0 91.43 3.24 3.54 92.35 5.34 5.78
Mexiletine 10.0 92.05 2.52 2.74 93.36 2.49 2.67
50.0 92.22 3.78 4.10 95.82 4.92 5.13
0.4 90.27 3.25 3.60 92.63 2.47 2.66
Propranolol 4.0 90.82 3.14 3.46 93.54 6.81 7.28
20.0 91.27 3.27 3.58 94.33 9.23 9.78
0.4 93.33 3.07 3.29 91.15 5.34 5.86
Propafenone 4.0 92.62 2.28 2.46 91.92 2.49 2.71
20.0 93.05 3.45 3.71 93.28 4.92 5.27


Matrix effect can suppress or enhance the ionization of target compounds, resulting in considerable quantification errors, especially when stable isotope-labeled internal standards are not available. In the present study, the matrix effect was defined as the ratio of the analyte peak area in the presence of matrix ions to the analyte peak area in the mobile phase. Because of the efficient SPE method that integrated with the bioanalysis, ion suppression or enhancement was low. Table 5 shows the results of matrix effect for all analytes. The values were within the range of 70.39–109.00%, which indicated that no co-eluting unidentified compounds significantly influenced the ionization of analytes.

Carryover. Back flush mobile phase composition was optimized to better focus the analytes in a narrow band. These efforts produced marginally adequate focusing with significant column carryover that required numerous wash cycles to remediate. Carryover under the present “trap and elute” type conditions was a challenging task with the solubility of the analytes that would result in re-trapping of the analytes during the elution phase. The UltiMate 3000 × 2 Dual-Gradient HPLC system is comprised of numerous Valco valves, clamps and tubing that provides the potential of analyte carryover. However, no significant carryover (<20% of LLOQ) was observed after more than 300 injections. Also no enhancement in the response was observed in extracted blank plasma (without analytes) after subsequent injection of highest calibration standard at the retention time of the analytes as shown in Fig. 4.
Relationship analysis of the physicochemical parameters and the analytical parameters of analytes. Recovery and retention time are the two most important parameters for establishing a reliable and high-throughput chromatographic methodology. Under the constant condition of pH value of mobile phase and the selected SPE cartridge, the correlation of the physicochemical parameters (C[thin space (1/6-em)]log[thin space (1/6-em)]P and pKa) and the analytical parameters (extraction recovery and retention time) of the analytes were preliminarily investigated in the present study. Positive correlation between the C[thin space (1/6-em)]log[thin space (1/6-em)]P and retention time of the analytes was exhibited (R2 = 0.8648), while negative correlation between the C[thin space (1/6-em)]log[thin space (1/6-em)]P and recovery was observed (R2 = 0.8856) (Fig. 5). These results suggested that the established online SPE-HPLC-MS/MS could provide excellent trapping/separation efficiency for the bioanalysis of these compounds with C[thin space (1/6-em)]log[thin space (1/6-em)]P ranges from 0.06 to 4. On the contrary, no linear correlation between pKa and the extraction recovery or the retention time was observed.
image file: c4ra01045k-f5.tif
Fig. 5 Correlation analysis of the physicochemical parameters and the analytical parameters of analytes.

Conclusions

A sensitive, accurate and reliable online SPE HPLC-MS/MS method has been developed and validated for the simultaneous determination of ten cardiovascular drugs with a broad range of physicochemical properties in rat plasma. The feature of the method is direct injection of biological samples that allows easy to implement in clinical settings. Linear calibration curves were obtained over the range of 0.2–100 ng mL−1, and the method limits ranged from 0.2 ng mL−1 to 1 ng mL−1. Compared with previous publications,28,32–39 the analytical results demonstrated better or comparable performance in LLOQ. The method is sensitive enough for clinical drug monitoring. The intra- and inter-day precisions were in the range of 0.20–2.32%, and the accuracies were between 93.33% and 114.60%. Excellent recoveries from plasma were achieved with a range from 83.52% to 107.38%. The analysis was carried out in a single run of 11 min by easy-to-use and high-throughput method. No interference from endogenous materials or other source was found at the same retention time as the analytes. Compared with previous publications, the analytical results demonstrated better or comparable performance in terms of linearity, selectivity, precision and accuracy. The bioanalytical method for simultaneously determination of a broad range of cardiovascular drugs in plasma with a simple and efficient extraction/clean up procedure and chromatography-mass spectrometry analysis may provide a practical solution for tailoring drug dosage in a rational manner to rapidly achieve optimal efficacy and safety of medication.

Acknowledgements

The authors are grateful to the support of the National Basic Research Program of China (973 program, Grant no. 2013CB911104), National Natural Science Foundation of China (Grant no. 20972079), the Fundamental Research Funds for the Central Universities (Grant no.65011071), the Tianjin Science and Technology Program (Grant no. 11ZCKFSY06800), the Scientific Research Starting Foundation of Returned Overseas Chinese Scholars, Ministry of Education of China and the “111” Project of Ministry of Education of China (Project no. B06005).

References

  1. N. H. Schebb, B. Inceoglu, T. Rose, K. Wagner and B. D. Hammock, Anal. Methods, 2011, 3, 420–428 RSC.
  2. S. M. Grundy, H. B. Brewer, Jr, J. I. Cleeman, S. C. Smith, Jr and C. Lenfant, Circulation, 2004, 109, 433–438 CrossRef PubMed.
  3. E. Jagerdeo and M. Abedel-Rehim, J. Am. Soc. Mass Spectrom., 2009, 20, 891–899 CrossRef CAS PubMed.
  4. L. Nováková and H. Vlčková, Anal. Chim. Acta, 2009, 656, 8–35 CrossRef PubMed.
  5. H. Ktaoka and K. Saito, J. Pharm. Biomed. Anal., 2011, 54, 926–950 CrossRef PubMed.
  6. N. F. C. Visser, H. Lingeman and H. Irth, Anal. Bioanal. Chem., 2005, 382, 535–558 CrossRef CAS PubMed.
  7. P. Sadĺlek, D. Šatĺnský and P. Solich, Trends Anal. Chem., 2007, 26, 375–384 CrossRef PubMed.
  8. A. V. Eeckhaut, K. Lanckmans, S. Sarre, I. Smolders and Y. Michotte, J. Chromatogr. B: Anal. Technol. Biomed. Life Sci., 2009, 877, 2198–2207 CrossRef PubMed.
  9. R. J. Mitchell, R. Christian, H. Hughes, A. Miah and D. K. Walker, J. Pharm. Biomed. Anal., 2010, 52, 86–92 CrossRef CAS PubMed.
  10. P. L. Kole, G. Venkatesh, J. Kotechac and R. Sheshalad, Biomed. Chromatogr., 2011, 25, 199–217 CrossRef CAS PubMed.
  11. N. Y. Ashri and M. A. Rehim, Bioanalysis, 2011, 3, 2003–2018 CrossRef CAS PubMed.
  12. P. Deng, X. Y. Chen and D. F. Zhong, Bioanalysis, 2009, 1, 187–203 CrossRef CAS PubMed.
  13. L. Liu, K. N. Liu, Y. B. Wen, H. W. Zhang, Y. X. Lu and Z. Yin, J. Chromatogr. B: Anal. Technol. Biomed. Life Sci., 2012, 893–894, 21–28 CAS.
  14. R. C. E. Estrela, M. C. Salvadori and G. S. Kurtz, Rapid Commun. Mass Spectrom., 2004, 18, 1147–1155 CrossRef CAS PubMed.
  15. Z. León, A. Chisvert, Á. Balaguer and A. Salvador, Anal. Chim. Acta, 2010, 664, 178–184 CrossRef PubMed.
  16. J. R. Griffiths, S. Perkins, Y. Connolly, L. Zhang, M. Holland, V. Barattini, L. Pereira, A. Edge, H. Ritchie and D. L. Smith, J. Chromatogr. A, 2012, 1232, 276–280 CrossRef CAS PubMed.
  17. J. M. Zhang, W. S. Lin, X. N. Li, N. Yu, X. M. Ling, G. Fu, R. T. Li and J. R. Cui, J. Sep. Sci., 2012, 35, 721–725 CrossRef CAS PubMed.
  18. K. G. Alberti, P. Zimmet and J. Shaw, Lancet, 2005, 366, 1059–1062 CrossRef.
  19. S. M. Grundy, Arterioscler., Thromb., Vasc. Biol., 2008, 28, 629–638 CrossRef CAS PubMed.
  20. W. H. Organization, http://www.who.int/cardiovascular%20diseases/en/, 2010, October.
  21. S. M. Grundy, J. I. Cleeman, S. R. Daniels, K. A. Donato, R. H. Eckel, B. A. Franklin, D. J. Gordon, R. M. Krauss, P. J. Savage, S. C. Smith, Jr, J. A. Spertus and F. Costa, Circulation, 2005, 112, 2735–2752 CrossRef PubMed.
  22. P. Charlier and J. C. Alvarez, Forensic Sci. Int., 2008, 178, e19–21 CrossRef PubMed.
  23. G. J. Murray and J. P. Danaceau, J. Chromatogr. B: Anal. Technol. Biomed. Life Sci., 2009, 877, 3857–3864 CrossRef CAS PubMed.
  24. J. H. Sklerov, B. Levine, K. M. Ingwersen, P. A. Aronica-Pollack and D. Fowler, J. Anal. Toxicol., 2006, 30, 346–351 CrossRef CAS PubMed.
  25. E. Vets, J. F. Rossignol and A. S. Jackson, Am. J. Health-Syst. Pharm., 2009, 66, 838–842 CrossRef CAS PubMed.
  26. S. H. Shen, J. Ouyang, W. R. G. Baeyens, J. R. Delanghec and Y. P. Yang, J. Pharm. Biomed. Anal., 2005, 38, 166–172 CrossRef CAS PubMed.
  27. M. Mazzarino, I. Fiacco, X. Torre and F. Botrè, J. Chromatogr. A, 2011, 1218, 8156–8187 CrossRef CAS PubMed.
  28. O. Gonzalez, R. M. Alonso, N. Ferreirós, W. Weinmann, R. Zimmermann and S. Dresen, J. Chromatogr. B: Anal. Technol. Biomed. Life Sci., 2011, 879, 243–252 CrossRef CAS PubMed.
  29. B. K. Matuszewski, M. L. Constanzer and C. M. Chavez-Eng, Anal. Chem., 2003, 75, 3019–3030 CrossRef CAS.
  30. L. Zivanovic, A. Licanski, M. Zecevic, B. Jocic and M. Kostic, J. Pharm. Biomed. Anal., 2008, 47, 575–585 CrossRef CAS PubMed.
  31. Y. K. Liu, X. Y. Jia, X. Liu and Z. Q. Zhang, Talanta, 2010, 82, 1212–1217 CrossRef CAS PubMed.
  32. A.-a. Sidler-Moix, T. Mercier, L. A. Decosterd, E. R. D. Paolo, M. Berger-Gryllaki, J. Cotting and A. Pannatier, Biomed. Chromatogr., 2012, 26, 672–680 CrossRef CAS PubMed.
  33. J. Beyer, F. T. Peters, T. Kraemer and H. H. Maurer, J. Mass Spectrom., 2007, 42, 150–160 CrossRef CAS PubMed.
  34. R. V. S. Nirogi, V. N. Kandikere, M. Shukla, K. Mudigonda, S. Maurya and P. Komarneni, Biomed. Chromatogr., 2007, 21, 241–248 CrossRef CAS PubMed.
  35. B. Buszewski, J. Nowaczyk, T. Ligor, P. Olszowy, M. Ligor, B. Wasiniak, W. Miekisch, J. K. Schubert and A. Amann, J. Sep. Sci., 2009, 32, 2448–2454 CrossRef CAS PubMed.
  36. A. K. Mishra, A. Mishra and P. Chattopadhyay, Arch. Appl. Sci. Res., 2010, 251–256 CAS.
  37. G. Lappin, Y. Shishikura, R. Jochemsen, R. J. Weaver, C. Gesson, J. B. Houston, B. Oosterhuis, O. J. Bjerrum, G. Grynkiewicz, J. Alder, M. Rowlandc and C. Garner, Eur. J. Pharm. Sci., 2011, 141–150 CrossRef CAS PubMed.
  38. D. Y. Zhang, Y. Teng, K. G. Chen, S. Liu, C. M. Wei, B. J. Wang, G. Y. Yuan, R. Zhang, X. Y. Liu and R. C. Guo, Biomed. Chromatogr., 2012, 26, 1176–1182 CrossRef CAS PubMed.
  39. M. H. Spyridakia, P. Kiousi, A. Vonaparti, P. Valavani, V. Zonaras, M. Zahariou, E. Sianos, G. Tsoupras and C. Georgakopoulos, Anal. Chim. Acta, 2006, 573–574, 242–249 CrossRef PubMed.

This journal is © The Royal Society of Chemistry 2014
Click here to see how this site uses Cookies. View our privacy policy here.