DOI:
10.1039/C4RA01019A
(Paper)
RSC Adv., 2014,
4, 15138-15145
Role of graphite precursor and sodium nitrate in graphite oxide synthesis†
Received
5th February 2014
, Accepted 14th March 2014
First published on 14th March 2014
Abstract
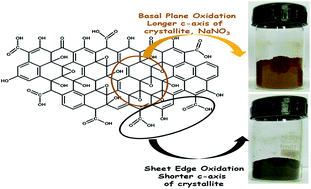
Graphite oxides were synthesized following the Hummer's method using three different graphite precursors. The role of the graphite precursor and sodium nitrate during graphite oxide synthesis has been investigated. Different analytical techniques, namely powder X-ray diffraction, thermal gravimetric analysis, infrared spectroscopy, and ultraviolet-visible absorption spectroscopy have been implemented to characterize the synthesized graphite oxides. The study revealed that a longer c-axis (axis perpendicular to the carbon layer) in the graphite crystallite favored basal plane oxidations over sheet edge oxidations on the graphitic sheets during graphite oxide synthesis. These basal plane oxidations caused a strain in the graphitic sheets. Due to this strain, graphitic layers were cracked along the a-axis (axis in the carbon layer planes) and also layers were peeled off along the c-axis. Hence, crystallite sizes of the synthesized graphite oxides were significantly reduced compared to their graphite precursors. Furthermore, basal plane oxidations and consequently reduction in the crystallite sizes were enhanced by the addition of sodium nitrate during the synthesis.
Introduction
In recent years, the interest in graphene,1–3 a single atom thick two dimensional sheet comprised of sp2-bonded carbon materials has increased exponentially because of its properties such as high surface area (theoretically 2620 m2 g−1 for single layer graphene),1,4,5 excellent conductivity,4,6–8 high flexibility, and great mechanical strength.1,5,9 These unique properties of graphene could lead to potential applications such as batteries,10,11 sensors,12 electrochemical supercapacitors,4,13 electrocatalysis14 etc. In this context, one important branch of graphene research is the synthesis of graphite oxide (GO). GO is a precursor for graphene synthesis which can be reduced to graphene either by a chemical or a thermal reduction route.15 For this purpose, understanding the mechanism of GO formation is crucial for the development of an efficient and optimized procedure for GO synthesis which will help to produce high quality graphene. Moreover, in recent years GO has also been directly used for electrocatalysis,16,17 electrochemiluminescence,18,19 electrochemical sensor applications for the detection of enzymes,20 DNA,21 proteins,22 etc.
GO is an oxygen rich carbonaceous layered material very similar to graphite. However, graphite consists of only sp2 hybridized carbon atoms whereas GO contains both sp3 and sp2 hybridized carbon atoms. sp3 hybridized carbon atoms in GO are covalently bonded with oxygen functional groups such as carboxy, epoxy, hydroxyl etc. (Fig. 1). In graphite, two dimensional layers are held together by weak van der Waals forces. However, in case of GO, the layers are separated by epoxy functional group and water molecules between the layers.15,23 The interlayer distance of GO is ∼8–9 Å,24 which is much higher compared to graphite (3.4 Å). The basal planes of GO consist of hydroxyl and epoxy groups and the sheet edges consist of carboxy, carbonyl, phenol, and quinone groups (Fig. 1).25,26 GO does not have a particular composition because the content of oxygen functionalized groups varies depending on the reaction conditions such as methodology of a particular chemical reaction, crystallite size of graphite, source of precursors etc.27 It is important to mention that these oxygen containing functional groups can significantly affect GO's mechanical, electronic, and electrochemical properties and hence may affect its performance for various application purposes as well.
 |
| Fig. 1 Structure of GO. | |
The present study focuses on an in-depth understanding of the experimental parameters that affect GO synthesis by Hummers method. We hereby present that the degree of oxidation on the basal planes and sheet edges of the graphitic sheets was controlled by crystallite size of the graphite precursor. It has been unravelled that the addition of sodium nitrate (NaNO3) during GO synthesis can also enhance oxidation on the basal planes of the graphitic sheets. Furthermore, enhanced basal plane oxidations caused enormous strain in the graphitic sheets which resulted rupture of the graphitic sheets along the a-axis (axis in the carbon layer planes) and simultaneously peeled off the graphitic sheets along the c-axis (axis perpendicular to the carbon layers). The key findings of this work may also lead to the improvement in the quality of graphene production and subsequently its applications as well.
Experimental
Chemicals
Graphite of three different particles sizes (20 micron (Cat# 282863), 45 micron (Cat# 496596) and 150 micron (Cat# 496588)), concentrated sulfuric acid (Cat# 320501), NaNO3, potassium bromide and barium chloride solution were purchased from Sigma-Aldrich. All the graphite precursors were synthetic powders. 30% hydrogen peroxide and hydrochloric acid (HCl) were purchased from Rankem India. KMnO4 was purchased from Fischer Scientific. Acetone was purchased from Spectrochem India. Milli-Q water (>18 MΩ cm) was used during all the syntheses.
GO synthesis
GO was prepared according to the Hummer's method.28,29 However, modifications in the synthesis procedure were made to understand the parameter that could affect the quality of GO. Modifications are highlighted in italics here. Graphite of different particle size (4 g) was first sonicated in acetone for 30 minutes. Thereafter, graphite was filtered through a sintered glass filter and dried in an oven at 45 °C for 2 hours. Graphite (2 g) was suspended in 46 mL concentrated sulfuric acid in an ice bath (0 °C) in a 250 mL round bottom flask equipped with a magnetic stir bar. Syntheses were also performed by suspending graphite (2 g) and NaNO3 (1 g) in concentrated sulfuric acid to understand the role of NaNO3 in GO synthesis. 6 g of KMnO4 was then added cautiously covering a time span of approximately 20 minutes so that the temperature of the solution did not exceed 20 °C. The solution was then stirred at 35 °C using a reflux condenser for 3 hours. After that, 92 mL of distilled water was added and stirring continued for an additional period of 30 minutes. Then the content was poured into 280 mL of distilled water and 10 mL of 30% hydrogen peroxide was added to destroy the excess KMnO4. The complete removal of KMnO4 was indicated by a color change from dark to yellow. In several experiments, the color of the solution was yellow even before the addition of hydrogen peroxide which indicated the complete reduction of KMnO4. GO was then isolated by a sintered glass filter and washed with HCl solution (10%). Washing was continued until sulphate was no longer detected in the filtrate which was confirmed by addition of barium chloride solution in the filtrate. Prepared GO was then dried in an oven at 45 °C for 24 hours. After drying, GO samples were grinded and stored in vials in ambient conditions.
The sample codes for the synthesized GOs are mentioned according to the particle sizes of the graphite precursors and depending on the usage of NaNO3 during the synthesis. As an example, the sample code for the synthesized GO using 45 micron particle size graphite precursor will be GO (45) and when NaNO3 was used during the synthesis, the sample code will be mentioned as GO (45, NaNO3). Throughout this manuscript, these sample codes of GOs will be used.
Infrared spectroscopy (IR) study
Infrared spectroscopy was performed using a PerkinElmer Spectrum BX spectrophotometer. Solid GO samples were grinded with potassium bromide and pelleted. IR spectra were taken in a wavelength range from 500 to 4000 cm−1.
Ultraviolet-visible (UV-Vis) study
UV-Vis spectroscopy was performed using a Shimadzu UV 1800 spectrophotometer. In order to record UV-Vis spectrum, 1 mg of solid GO sample was added in 40 mL of water, followed by sonication for ∼9 minutes. Sonication was performed because of the poor solubility of GO in water. It was realised that the duration of 9 minutes for sonication was sufficient to make a complete dispersed solution exhibiting a maximum absorption. Further increase in the time period for sonication, did not result in any enhancement in the intensity of the absorption maxima for all the tested samples. Immediately after sonication, the UV-Vis spectra were taken in the wavelength range of 200 to 800 nm. From visual inspection, no particulates were seen at the bottom of the cuvette as well. However, UV absorbance still showed a nonzero baseline for many GO samples presumably because of the light scattering with GO particles in the solution. Similar observation has been reported previously.24 The reported absorbance values in Table 2 were calculated by subtracting the absorbance values at 600 nm wavelength from the absorbance at peak maxima. 600 nm was chosen as a reference wavelength since GO has no absorbance at this wavelength. This methodology could entail an error of maximum 10% (methodology recommended in the user manual for UV-Vis spectrophotometer). If 800 nm was used as a reference wavelength, the absorbance values changed only marginally (less than 1%).
Powder X-ray diffraction (PXRD) study
The PXRD patterns were recorded by Bruker AXS D8 Advance with Cu Kα radiation (1.54 Å) with a step size of 0.02° in a 2θ range of 0° to 90°.
Thermal gravimetric analysis (TGA)
The TGA experiments were performed by PerkinElmer TGA 4000 instrument in a temperature range from 30° to 500 °C at a scan rate of 5 °C min−1 with a N2 flow rate of 20 mL min−1. For each experiment, approximately 10 mg of GO sample was taken.
Scanning electron microscopy (SEM)
The GO samples were dried in vacuum desicator for 48 hours. Dried samples were spread on carbon tape and gold coated for 120 s. The scanning electron microscopy (SEM) experiments were performed by Carl ZEISS (ultraplus) FE-SEM at 5 kV. SEM images of three GO samples are shown in the ESI.†
Results
Synthesis
The digital images of three dried samples have been shown in Fig. 2 and those are GO (20), GO (45), and GO (150). The color of the samples varied from dark yellow to dark brownish/black. The images show that the color was brightest for GO (45) and darkest for GO (150).
 |
| Fig. 2 Digital images of the dried samples for (A) GO (20), (B) GO (45), and (C) GO (150) have been shown. | |
IR study
The IR spectrum of GO (45) has been shown in Fig. 3. The prominent transmission bands were observed at 3394, 1720, 1618, 1406, 1226, and 1053 cm−1 corresponding to the presence of hydroxyl, carbonyl, carboxyl, O–H deformation vibration, C–OH stretching, and epoxide respectively.15,29 For all the GO samples, the recorded IR spectra were very similar.
 |
| Fig. 3 The experimental IR spectrum has been shown for GO (45). | |
PXRD study
PXRD studies were performed for all the synthesized GOs and graphite precursors. Fig. 4 shows the representative PXRD results for 45 micron graphite precursor and GO (45). Graphite showed a 2θ maxima at 26.6° for (002) plane which corresponds to an interlayer distance (d) of 3.35 Å. In comparison to the precursor, the 2θ maxima of (002) plane for GO (45) moved to a much lower value of 10.5°, which corresponds to an interlayer distance (d) of 8.4 Å. The comparison of the experimental PXRD patterns revealed that the (002) plane peak for GO was much broader in comparison to its parent graphite precursor. This finding indicates a decrease in the crystallite length along c-axis (Lc) and consequently a decrease in the number of layers for GO crystallite compared to its parent precursor.30 A weak peak for (100) plane was also observed around 2θ of ∼42.3° for graphites and GOs (not visible in the Fig. 4). Interestingly, (100) plane peaks were also broader for GOs compared to their parent precursors, indicating a decrease in the crystallite length along the a-axis (La). Utilizing Lorentzian fitting, full width at half peak maxima (fwhm) were determined for (002) and (100) peaks. These fwhm values were utilized for the determination of Lc and La using Scherrer formula.30–32 The number of layers for GOs and graphite precursors were obtained by dividing Lc with d. Representative Lorentzian fitting and the calculation methodology has been discussed in the ESI.† Table 1 summarizes the 2θ maxima, fwhm, Lc, d, N and La values for all the graphites and GO samples.
 |
| Fig. 4 The experimental PXRD patterns have been shown for graphite (45 micron) (black) and GO (45) (blue). | |
Table 1 PXRD characteristics of graphites and GOs
GO sample code |
2θ Maxima (°) |
(fwhm)Lc (°) |
Lc (nm) |
d (Å) |
N |
(fwhm)La (°) |
La (nm) |
Graphite (20 micron) |
26.4 |
0.205 |
39.8 |
3.38 |
118 |
0.256 |
68.0 |
GO (20) |
10.5 |
0.624 |
12.9 |
8.41 |
15 |
0.820 |
21.3 |
GO (20, NaNO3) |
10.3 |
0.638 |
12.5 |
8.62 |
14 |
0.811 |
21.6 |
Graphite (45 micron) |
26.6 |
0.181 |
45.0 |
3.35 |
134 |
0.225 |
77.6 |
GO (45) |
10.5 |
0.519 |
15.4 |
8.41 |
18 |
0.684 |
25.4 |
GO (45, NaNO3) |
10.0 |
0.606 |
13.3 |
8.84 |
15 |
0.972 |
17.9 |
Graphite (150 micron) |
26.6 |
0.218 |
37.4 |
3.35 |
112 |
0.300 |
57.9 |
GO (150) |
10.3 |
0.510 |
15.6 |
8.62 |
18 |
0.677 |
25.7 |
GO (150, NaNO3) |
9.7 |
0.515 |
15.5 |
9.07 |
17 |
0.694 |
25.1 |
UV-Vis study
The representative UV-Vis spectra for GO (20), GO (45), and GO (150) have been shown in Fig. 5. For all the samples, two peaks were observed. One strong peak in the range of 230–232 nm corresponds to a π → π* transition and a weak peak in the range of 304–306 nm corresponds to an n → π* transition.15 Table 2 summarizes the peak maxima for the π → π* transition and the corresponding absorbance values for GOs. Although the peak maxima of all the GO samples were quite similar but significantly differed in their absorbance values; the following order was observed: GO (150) > GO (20)
GO (45). A similar trend was observed for the GO samples where NaNO3 was used during the synthesis. Furthermore, UV-Vis results comparison between GO (45) and GO (45, NaNO3) or GO (20) and GO (20, NaNO3) or GO (150) and GO (150, NaNO3) showed that the addition of NaNO3 also caused decrease in the absorbance values.
 |
| Fig. 5 UV-Vis spectra have been shown for GO (20) (orange), GO (45) (blue), and GO (150) (green). | |
Table 2 UV-Vis and TGA results for GO samples
GO sample code |
Peak wavelength (nm) |
Absorbance (a.u.) |
Percentage mass loss between 150 °C and 400 °C |
Due to weak absorption of 45 micron samples, 2 mg solid samples were taken in 20 mL water. But, absorbance values are reported for the concentration of 1 mg per 40 mL. |
GO (20) |
231 |
2.3 ± 0.2 |
37.7 ± 1.6 |
GO (20, NaNO3) |
232 |
1.8 ± 0.3 |
38.6 ± 1.8 |
GO (45)a |
231 |
0.20 ± 0.07 |
34.8 ± 2.5 |
GO (45, NaNO3)a |
231 |
0.16 ± 0.03 |
31.8 ± 1.7 |
GO (150) |
232 |
2.7 ± 0.2 |
34.8 ± 0.2 |
GO (150, NaNO3) |
231 |
2.0 ± 0.1 |
32.2 ± 1.9 |
TGA study
The representative TGA traces for GO (20), GO (45), and GO (150) have been shown in Fig. 6. Table 2 summarizes the percentage mass loss in the temperature range of 150° to 400 °C. Up to 150 °C, the mass loss was mainly due to the loss of water. Between 150° and 400 °C, GO loses all the oxygen functionalized groups.33 Hence, a comparison of percentage mass loss from 150° to 400 °C may provide an indication about the degree of oxidation. It is important to mention that the water content of the GO samples were not fixed, although efforts were taken to dry the samples under identical conditions. In order to avoid discrepancy in the percentage mass loss due to the different water content, eqn (1) was followed to determine the percentage mass loss in the temperature range of 150° to 400 °C. |
% Mass loss = (% mass at 400 °C − % mass at 150 °C) × 100/(% mass at 150 °C)
| (1) |
 |
| Fig. 6 TGA traces have been shown for GO (20) (orange), GO (45) (blue), and GO (150) (green). | |
The summarized results in Table 2 show that for different samples the mass losses were in the range of 32–39%.
Discussion
In the present study, the GOs have been synthesized by using different graphite precursors and NaNO3 to understand their roles in the synthesis. Based on the experimental observations, a mechanism for the GO formation has been proposed.
Role of graphite precursor in GO synthesis
The PXRD results were used to determine the crystallite sizes of GOs and graphite precursors. The results presented in Table 1 shows that the graphite (45 micron) and graphite (150 micron) precursor had the largest and shortest crystallite size among the precursors respectively. PXRD results also demonstrate that the crystallite sizes of GOs were significantly smaller than their parent precursors. More interestingly, the crystallite sizes of GOs varied significantly depending on the precursor used, demonstrating a clear evidence for the role of crystallite size of graphite precursors in the GO synthesis.
The oxidation on the graphitic sheets can take place either on the basal planes or on the sheet edges. Basal plane oxidation results in the incorporation of epoxy groups and small amount of hydroxyl functionalization as well.25,26 On the other hand, sheet edge oxidation results in incorporation of the carboxylic acid, hydroxyl and quinone functionalization.25,26,34 Hence, oxidations on basal planes result in hydrophobicity while sheet edges oxidations lead to hydrophilicity.34 Besides, oxidations on the basal planes also result in a disruption of the π network because of change in hybridization of the carbon atoms from sp2 to sp3. Hence, the basal plane oxidations significantly decrease the absorbance of the GO for the peak corresponding to ∼230 nm which appears due to a π → π* transition. UV-Vis results in Table 2 and Fig. 5 show that the GO (45) had much lower absorbance compared to GO (20) and GO (150). Further, Fig. 2 shows that the GO (45) had a brighter color compared to the GO (20) or GO (150). A brighter color for the GO samples indicate lack of sp2 domain because of absorbance in the narrow region of the visible blue light.34 All these results suggest that the oxidation on the basal plane of graphitic sheets were most successful for 45 micron particle size graphite in this study. The highest absorbance for GO (150) indicated that for this graphite precursor, a sheet edge oxidation was more prevalent compared to a basal plane oxidation. In summary, basal plane oxidation trend was: GO (45)
GO (20) > GO (150).
TGA results in Table 2 summarize percentage mass loss due to the loss of oxygen functionalized groups of GOs. Mass losses of GO (20), GO (45) and GO (150) were comparable and in the range of 35–38%. It is important to emphasize that the mass loss in TGA does not directly correlate with the degree of oxidation because a basal plane oxidation results in mass loss for the functional groups having lower masses (e.g. epoxy and hydroxyl) compared to a sheet edge oxidation which results in mass loss of the functional groups that have higher masses (e.g. carboxylic group). Hence, a less percentage mass loss for GO (45) compared to GO (20) does not necessarily indicate a lower degree of oxidation for GO (45).
Role of NaNO3
The PXRD results comparison between GO (45) and GO (45, NaNO3) or GO (20) and GO (20, NaNO3) or GO (150) and GO (150, NaNO3) showed that the addition of NaNO3 during synthesis decreased Lc, i.e. number of layers were reduced and interlayer distances were increased to a minor extent. The decrease in number of layers was most prominent for the 45 micron particle size graphite precursor. A comparison of the PXRD results between GO (45) and GO (45, NaNO3) further revealed that the NaNO3 caused further reduction of La in the synthesized GO.
Comparison of the UV-Vis results (Table 2) show that when NaNO3 was used in the synthesis (e.g. GO (45) and GO (45, NaNO3) or GO (20) and GO (20, NaNO3), or GO (150) and GO (150, NaNO3)), the absorbance decreased for all the graphite precursors. From these results, it can be concluded that the lower absorbances with addition of NaNO3 during synthesis indicate that NaNO3 helped oxidation on the basal planes compared to the sheet edges.
TGA results in Table 2 show that the mass loss had no particular trend for with or without addition of NaNO3 during synthesis. As emphasized earlier, it is difficult to identify basal planes versus oxidation at the sheet edges from TGA results.
Mechanism of GO formation
On the basis of obtained results, a mechanism for GO formation has been proposed. Based on the UV-Vis results in Fig. 5, Table 2 and digital images of Fig. 2, the basal plane oxidation trend for different graphite precursors was found to be: 45 micron precursor
20 micron precursor > 150 micron precursor. Considering the particle sizes of graphite precursors, these results have no unidirectional trend. In this work, graphite precursors were sonicated in acetone for half an hour before the synthesis which was not a part of the original synthetic methodology of Hummers Method. After the sonication step, graphite precursor's particle sizes were determined by optical microscope and reported in the ESI (Table S1†). The trend of particle sizes of graphite precursors did not change even after sonication. Hence, it can be safely concluded that the particle size of the precursor has no role for basal plane versus sheet edge oxidations. Interestingly, Table 1 shows that the 45 micron precursor had largest crystallite size having La and Lc values of 77.6 and 45 nm. On the other hand, 150 micron graphite precursor had shortest La and Lc and those were 57.9 and 37.4 nm. These observations clearly suggest that a larger crystallite size of the graphite precursor helps basal plane oxidation and sheet edge oxidation prevails for a shorter crystallite precursor. More interestingly, the difference in La values between the three different precursors were found to be almost same and i.e. ∼10 nm (Table 1), which can not completely explain the significantly higher basal plane oxidations for the 45 micron graphite precursor.
However, the differences in Lc values were found to be 5.2 (between 45 and 20 micron precursors) and 2.4 nm (between 20 and 150 micron precursors). These observations correlate with the experimental findings, i.e. significantly higher basal plane oxidation for the 45 micron graphite precursor compared to 20 and 150 micron precursors. Hence, it can be safely concluded that a larger c-axis of the graphite crystallite (Lc) is the guiding parameter for preference towards basal plane oxidations. In Fig. 7, schematically the proposed mechanism for GO formation has been shown. Although, the attack of oxidants on the graphitic sheets cause both basal plane and sheet edge oxidations, for clarity sheet edge oxidations were not shown in the schematic representation. From the schematic, it can be easily visualized that a longer c-axis of the precursor will provide more surface area for the oxidants to attack on the graphitic sheets from horizontal directions and basal plane oxidations will be preferred. On the other hand, a longer a-axis will not be very helpful because the oxidants attack from the top and bottom sides will mostly bounce back from the graphitic planes without reacting. A longer a-axis will also make the oxidants attack from horizontal directions less productive because oxidants will have a difficulty to enter inside the graphitic layers (not shown in Fig. 7) and basal plane oxidations may not prevail over sheet edge oxidations. Because of the oxidants attack, basal planes were functionalized and the interlayer distance of GOs increase to ∼8.5–9.0 Å compared to their precursors (3.4 Å). These basal plane oxidations were shown by maroon circles in Fig. 7. It is important to emphasize that the observed variations in the interlayer distance of synthesized GOs may not be due to the degree of basal plane oxidations, rather may be because of the orientation of functional groups present between the layers. It was also observed that the addition of NaNO3 increased the interlayer distance marginally for all three different precursors.
 |
| Fig. 7 The figure shows the schematic representation of mechanism for GO formation from graphite precursor. Green planes and filled dark maroon circles represent graphitic sheets and the functional groups due to basal plane oxidations. Red dotted lines and filled red circles represent that many graphitic sheets and all the GOs made from one graphite crystallite were not shown. For clarity sheet edge oxidations were not shown. | |
According to the proposed mechanism, the basal plane oxidations on the graphitic sheets create strain in the graphitic sheets because of the change in hybridization of carbon atoms from sp2 to sp3. Fig. 7 shows that due to this strain, graphitic sheets were cracked along the a-axis and also layers were peeled off along the c-axis. The ruptures of graphitic sheets were much less along the a-axis compared to the c-axis. In the process of GO formation, graphite crystallites were broken into 3–5 pieces along the a-axis, whereas these numbers were 6–9 along the c-axis. Hence, the synthesized GO crystallites were much smaller in size compared to their precursors (Fig. 7). UV-Vis results in Table 2 showed that the basal plane oxidation was intensified by the addition of NaNO3 and Table 1 confirmed that due to the enhanced basal plane oxidation, the GOs prepared by addition of NaNO3 had slightly smaller crystallite sizes. The role of NaNO3 was not so prominent for 20 and 150 micron precursors but was clearly evident for the 45 micron precursor, presumably due to the fact that the basal plane oxidation was much higher in this case. PXRD results comparison between graphite (45 micron) and GO (45, NaNO3) revealed an astonishing outcome which shows that while graphite precursor had the largest crystallite size among the precursors but GO (45, NaNO3) had the shortest crystallite size among the prepared GOs. These observations suggest that in this case a strong basal plane oxidation occurred because of both precursors' long c-axis and also due to the addition of NaNO3 and hence graphitic sheets were broken into smallest pieces with maximum functionalization on the basal planes.
Conclusions
In conclusion, a systematic study was performed to unravel the role of graphite precursor and NaNO3 in the GO synthesis. The results of this work revealed many important findings regarding the mechanism of GO formation. Firstly, oxidation on the basal plane is favoured by a larger crystallite size of the graphite precursor and more precisely a longer c-axis of the graphite crystallites determines the degree of basal plane versus sheet edge oxidations. The molecular level reasoning for this finding is that a longer c-axis provides a greater surface area for the oxidants to attack on the graphitic sheets which leads to a high degree of basal plane oxidation. Secondly, a strong basal plane oxidation causes strain in the graphitic sheets which results in rupture of the graphitic sheets along the a-axis and c-axis as well. Hence, the crystallite sizes of the GOs were significantly smaller than the graphite precursors. Thirdly, addition of NaNO3 during synthesis increased the interlayer distance, and helped oxidation on the basal planes compared to the sheet edges. Finally, the results presented here demonstrate that by choosing a larger crystallite size of graphite and utilizing NaNO3 during synthesis, basal plane oxidation improved dramatically and it produced tiniest GO crystallite of this study. Thus by choosing appropriate crystallite size of the initial precursors and reaction conditions, functionality of GOs and crystallite size of GOs can be controlled.
It is important to emphasize that although this work demonstrates that by using a graphite precursor having longer c-axis and addition of sodium nitrate during synthesis leads to a smaller GO crystal but the significance of this work is not to produce smaller GO crystal. Rather, this work provides a rational for specifying the target for the scientists who wish to utilize GO for different application purposes. For example, if a researcher wishes to produce a long single layer of graphene, then this study indicates that for GO synthesis step, one should start with a graphite precursor having longer a-axis, a much shorter c-axis and should avoid addition of NaNO3 during synthesis to avoid excess basal plane oxidation. Indeed, future works on graphene/graphite oxide based on the knowledge gained from this study will determine the success of this work.
Acknowledgements
A. P. acknowledges financial support from the Department of Science and Technology (DST), India, Department of Atomic Energy (DAE), India and IISER Bhopal. D. R. C. acknowledges IISER Bhopal for providing fellowship. C. S. acknowledges Council for Scientific and Industrial Research (CSIR), India for providing fellowship. We are thankful to Dr Deepak Chopra and Dr Archana Singh for critically reviewing the manuscript. We sincerely thank Prof. T. N. Guru Row and Ms Vinutha, IISc Bangalore for providing PXRD results. We thank Dr Pritam Nasipuri, IISER Bhopal for helping us in particle size analysis of graphite. We thank Mr. Amarendar Reddy M for helping us in collecting SEM images. A. P. would like to thank his PhD supervisor, Prof. David H. Waldeck, University of Pittsburgh and postdoctoral supervisor, Prof. Thomas J. Meyer, University of North Carolina, Chapel Hill.
References
- A. K. Geim and K. S. Novoselov, Nat. Mater., 2007, 6, 183–191 CrossRef CAS PubMed.
- D. Li and R. B. Kaner, Science, 2008, 320, 1170–1171 CrossRef CAS PubMed.
- E. C. H. Sykes, Nat. Chem., 2009, 1, 175–176 CrossRef CAS PubMed.
- M. D. Stoller, S. Park, Y. Zhu, J. An and R. S. Ruoff, Nano Lett., 2008, 8, 3498–3502 CrossRef CAS PubMed.
- S. Park and R. S. Ruoff, Nat. Nanotechnol., 2009, 4, 217–224 CrossRef CAS PubMed.
- K. S. Novoselov, Z. Jiang, Y. Zhang, S. V. Morozov, H. L. Stormer, U. Zeitler, J. C. Maan, G. S. Boebinger, P. Kim and A. K. Geim, Science, 2007, 315, 1379 CrossRef CAS PubMed.
- K. S. Novoselov, A. K. Geim, S. V. Morozov, D. Jiang, M. I. Katsnelson, I. V. Grigorieva, S. V. Dubonos and A. A. Firsov, Nature, 2005, 438, 197–200 CrossRef CAS PubMed.
- Y. Zhang, Y.-W. Tan, H. L. Stormer and P. Kim, Nature, 2005, 438, 201–204 CrossRef CAS PubMed.
- C. Lee, X. Wei, J. W. Kysar and J. Hone, Science, 2008, 321, 385–388 CrossRef CAS PubMed.
- S.-M. Paek, E. Yoo and I. Honma, Nano Lett., 2009, 9, 72–75 CrossRef CAS PubMed.
- D. Wang, D. Choi, J. Li, Z. Yang, Z. Nie, R. Kou, D. Hu, C. Wang, L. V. Saraf, J. Zhang, I. A. Aksay and J. Liu, ACS Nano, 2009, 3, 907–914 CrossRef CAS PubMed.
- F. Schedin, A. K. Geim, S. V. Morozov, E. W. Hill, P. Blake, M. I. Katsnelson and K. S. Novoselov, Nat. Mater., 2007, 6, 652–655 CrossRef CAS PubMed.
- J. Chen, C. Li and G. Shi, J. Phys. Chem. Lett., 2013, 4, 1244–1253 CrossRef CAS PubMed.
- E. Yoo, T. Okata, T. Akita, M. Kohyama, J. Nakamura and I. Honma, Nano Lett., 2009, 9, 2255–2259 CrossRef CAS PubMed.
- D. Chen, H. Feng and J. Li, Chem. Rev., 2012, 112, 6027–6053 CrossRef CAS PubMed.
- L. Tang, Y. Wang, Y. Li, H. Feng, J. Lu and J. Li, Adv. Funct. Mater., 2009, 19, 2782–2789 CrossRef CAS.
- S. Yang, B. Xu, J. Zhang, X. Huang, J. Ye and C. Yu, J. Phys. Chem. C, 2010, 114, 4389–4393 CAS.
- F.-R. F. Fan, S. Park, Y. Zhu, R. S. Ruoff and A. J. Bard, J. Am. Chem. Soc., 2008, 131, 937–939 CrossRef PubMed.
- Y. Wang, J. Lu, L. Tang, H. Chang and J. Li, Anal. Chem., 2009, 81, 9710–9715 CrossRef CAS PubMed.
- Y. Liu, D. Yu, C. Zeng, Z. Miao and L. Dai, Langmuir, 2010, 26, 6158–6160 CrossRef CAS PubMed.
- N. Mohanty and V. Berry, Nano Lett., 2008, 8, 4469–4476 CrossRef CAS PubMed.
- K. Liu, J. Zhang, G. Yang, C. Wang and J.-J. Zhu, Electrochem. Commun., 2010, 12, 402–405 CrossRef CAS.
- A. V. Talyzin, V. L. Solozhenko, O. O. Kurakevych, T. Szabó, I. Dékány, A. Kurnosov and V. Dmitriev, Angew. Chem., Int. Ed., 2008, 47, 8268–8271 CrossRef CAS PubMed.
- D. C. Marcano, D. V. Kosynkin, J. M. Berlin, A. Sinitskii, Z. Sun, A. Slesarev, L. B. Alemany, W. Lu and J. M. Tour, ACS Nano, 2010, 4, 4806–4814 CrossRef CAS PubMed.
- F. Kim, L. J. Cote and J. Huang, Adv. Mater., 2010, 22, 1954–1958 CrossRef CAS PubMed.
- G. Eda and M. Chhowalla, Adv. Mater., 2010, 22, 2392–2415 CrossRef CAS PubMed.
- D. R. Dreyer, S. Park, C. W. Bielawski and R. S. Ruoff, Chem. Soc. Rev., 2010, 39, 228–240 RSC.
- W. S. Hummers and R. E. Offeman, J. Am. Chem. Soc., 1958, 80, 1339 CrossRef CAS.
- S. Stankovich, R. D. Piner, S. T. Nguyen and R. S. Ruoff, Carbon, 2006, 44, 3342–3347 CrossRef CAS.
- D. W. Lee, L. De Los Santos V., J. W. Seo, L. L. Felix, A. Bustamante D., J. M. Cole and C. H. W. Barnes, J. Phys. Chem. B, 2010, 114, 5723–5728 CrossRef CAS PubMed.
- P. Scherrer, Göttinger Nachrichten Gesell., 1918, 2, 98–100 Search PubMed.
- L. G. Cançado, K. Takai, T. Enoki, M. Endo, Y. A. Kim, H. Mizusaki, A. Jorio, L. N. Coelho, R. Magalhães-Paniago and M. A. Pimenta, Appl. Phys. Lett., 2006, 88, 163106 CrossRef.
- K. Haubner, J. Murawski, P. Olk, L. M. Eng, C. Ziegler, B. Adolphi and E. Jaehne, ChemPhysChem, 2010, 11, 2131–2139 CrossRef CAS PubMed.
- A. Dimiev, D. V. Kosynkin, L. B. Alemany, P. Chaguine and J. M. Tour, J. Am. Chem. Soc., 2012, 134, 2815–2822 CrossRef CAS PubMed.
Footnote |
† Electronic supplementary information (ESI) available: SEM images, PXRD analysis and particle size of graphite precursors after sonication step. See DOI: 10.1039/c4ra01019a |
|
This journal is © The Royal Society of Chemistry 2014 |
Click here to see how this site uses Cookies. View our privacy policy here.