Preparation and characterization of highly sodium ion conducting Na3PS4–Na4SiS4 solid electrolytes

Naoto Tanibata, Kousuke Noi, Akitoshi Hayashi* and Masahiro Tatsumisago
Department of Applied Chemistry, Graduate School of Engineering, Osaka Prefecture University, 1-1, Gakuen-cho, Naka-ku, Sakai, Osaka, 599-8531, Japan. E-mail: hayashi@chem.osakafu-u.ac.jp; Fax: +81-72-2549334; Tel: +81-72-2549334

Received 5th February 2014 , Accepted 27th March 2014

First published on 27th March 2014


Abstract

This study investigated electrical and electrochemical properties of (100 − x)Na3PS4·xNa4SiS4 (mol%) glass–ceramics prepared using mechanical milling and consecutive heat treatment. Glass–ceramics at the compositions of 0 ≤ x ≤ 10 exhibited higher conductivity than 10−4 S cm−1 at room temperature, which was achieved by precipitation of cubic Na3PS4 crystal with high sodium ion conductivity. The conductivity increased concomitantly with increasing Na4SiS4 contents at compositions of 0 ≤ x ≤ 6. The glass–ceramic with 6 mol% Na4SiS4 exhibited conductivity of 7.4 × 10⁻⁴ S cm−1 at room temperature, which is the highest value reported for Na+ ion conducting sulfides to date. The conductivities of the glass–ceramics in the composition range of 25 ≤ x ≤ 100, where unknown phases are crystallized, were 10−7–10−5 S cm−1. These were lower than the conductivities of the corresponding glasses before heat treatment. The 90Na3PS4·10Na4SiS4 electrolyte showed a wide electrochemical window of 5 V.
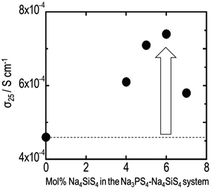

1. Introduction

Rechargeable batteries capable of storing renewable energy generated from solar and wind power sources are a key technology in the effort to reduce greenhouse gas emissions. Rechargeable lithium batteries are widely used today in portable power storage applications. However, flammable organic liquid electrolytes present safety concerns. Moreover, lithium resources are limited and are present in remote or in politically sensitive areas. Increasing demand for large lithium-ion batteries in electric vehicles will engender rising costs of lithium resources. Further development of safe, low-cost lithium batteries is necessary for widespread popularization of large rechargeable batteries for use in vehicles and distributed power applications. All-solid-state batteries are safe because they do not suffer from leakage, volatilization, or flammability of electrolytes. They employ inorganic solid electrolytes instead of organic liquid electrolytes.1,2 Rechargeable sodium-ion batteries are more suitable than lithium-ion batteries for use in energy storage systems from the viewpoint of production costs based on abundant sodium sources.3–6 Therefore, all-solid-state sodium secondary batteries are anticipated for use as next-generation batteries providing high safety and low cost for use with distributed energy sources.

Very recently, we reported that all-solid-state sodium batteries with a Na3PS4 glass–ceramic electrolyte operated successfully as rechargeable batteries at room temperature.7 The high conductivity of the Na3PS4 glass–ceramic was 4.6 × 10⁻⁴ S cm−1 at room temperature,8 which was achieved by precipitation of the cubic Na3PS4 crystal with high Na+ ion conductivity. To improve all-solid-state sodium battery performance, solid electrolytes with higher Na+ ion conductivity must be developed.

For lithium ion conductors, Kanno et al. reported that Li3PS4-based crystals, where Li4GeS4 was partially substituted for Li3PS4, showed higher conductivity than Li3PS4 and Li4GeS4 crystals.9 Recently, Li10GeP2S12 crystal showed extremely high lithium ion conductivity of more than 10−2 S cm−1 at room temperature.10 We also reported that the partial substitution of Li4SiS4 for Li3PS4 was effective for increasing the conductivity of Li3PS4 glass–ceramics.11 To increase the conductivity of Na3PS4 glass–ceramics, we have particularly studied partial substitution of Na4SiS4 for Na3PS4 because the introduction of Si element is effective for increasing conductivity of the Li3PS4 glass–ceramic system.

For this study, (100 − x)Na3PS4·xNa4SiS4 (mol%) glass–ceramics were prepared using mechanical milling and heat treatment (HT). The relation between crystals precipitated in the (100 − x)Na3PS4·xNa4SiS4 glass–ceramics and their ionic conductivities was investigated. Thermal and electrochemical properties of glass–ceramics were also evaluated.

2. Experimental

A mixture of Na2S (>99.1%; Nagao Co.), P2S5 (>99%; Aldrich Chemical Co. Inc.), and SiS2 (>99.9%; Furuuchi Chemical Co.) powders at the composition of (100 − x)Na3PS4·xNa4SiS4 (mol%) was mechanically milled at ambient temperature using a planetary ball mill apparatus (Pulverisette 7; Fritsch GmbH) with a zirconia pot (45 ml) and 500 zirconia balls (4 mm diameter). The rotation speed was 510 rpm. Milling durations were 1.5–25 hours. After mechanical milling, the powdered samples were compressed with a conventional uniaxial cold press to prepare 10 mm-diameter, 1–1.5 mm-thick pellets. To obtain the glass–ceramics, the milled sample pellets were crystallized by heating at an appropriate temperature between 220 °C and 360 °C in an electric furnace for 2 h. The heating temperature was selected based on crystallization temperatures determined using differential thermal analysis (DTA). All processes were performed in a dry Ar atmosphere. The XRD measurements of the prepared materials were performed using Cu Kα with a diffractometer (Ultima IV; Rigaku Corp.). Diffraction data were collected in 0.01° steps from 10.0° to 60.0° in 2θ. DTA was performed using a thermal analyzer (thermo Plus TG8110; Rigaku Corp.). The heating rate was 10 °C min−1.

Ionic conductivities of the pelletized (100 − x)Na3PS4·xNa4SiS4 milled samples and the heated samples prepared at various temperatures were evaluated using AC impedance measurements. The pellets were then coated with carbon paste on both faces to form ion-blocking electrodes. Two stainless steel disks coupled with Pt wires were attached to the pellets as current collectors. AC impedance measurements were conducted for the cell using dry Ar gas flow with an impedance analyzer (1260; Solartron Analytical) at frequencies of 10 Hz to 8 MHz. Cyclic voltammetry measurements were conducted to investigate the electrochemical properties of the solid electrolytes. A stainless-steel disk as the working electrode and a sodium foil as the counter and reference electrode were attached to each face of the pellet. Cyclic voltammograms of the 90Na3PS4·10Na4SiS4 glass–ceramic were obtained with a scan rate of 5 mV s−1 between −0.5 and 5.0 V (vs. Na+/Na) at 25 °C. A stainless-steel disk as the working electrode and a sodium foil as the counter and reference electrode were attached to each pellet face.

3. Results and discussion

Fig. 1 presents XRD patterns of the (100 − x)Na3PS4·xNa4SiS4 samples prepared using mechanical milling. A cubic Na3PS4 phase was crystallized using a milling process in the samples at the composition range of 0 ≤ x ≤ 10. We recently reported the cubic Na3PS4 phase that was obtained directly at the composition x = 0 using Na2S (Nagao Co.) as a starting sodium source,8 while a Na3PS4 glass was prepared using Na2S (Aldrich Co.).7 Halo patterns were observed for samples between 25 ≤ x ≤ 100, suggesting that glass samples were obtained.
image file: c4ra00996g-f1.tif
Fig. 1 XRD patterns of the (100 − x)Na3PS4·xNa4SiS4 (mol%) mechanically milled samples. The numbers in brackets are milling period of time. Inverted triangle denotes the diffraction peaks attributable to the cubic Na3PS4 phase.7

Fig. 2 shows DTA curves of the (100 − x)Na3PS4·xNa4SiS4 milled samples. An exothermic peak attributable to crystallization was observed for the glass samples (x = 67 and 100). A broad exothermic peak was also observed for the samples (x = 0 and 10) where the cubic Na3PS4 phase was precipitated directly using a milling process. A glassy component partially remaining in the milled samples was crystallized. The pelletized samples were thus heat treated at over those crystallization temperatures as shown in Fig. 2. The heat-treated samples are described as “glass–ceramics”.


image file: c4ra00996g-f2.tif
Fig. 2 DTA curves of the (100 − x)Na3PS4·xNa4SiS4 mechanically milled samples.

Fig. 3 shows XRD patterns of the (100 − x)Na3PS4·xNa4SiS4 glass–ceramics. Silicon was used as an internal standard in XRD measurements. In the composition range of 0 ≤ x ≤ 10, the intensity of the peaks attributable to the cubic Na3PS4 increased. No new peaks attributable to other crystalline phases appeared. The crystallite size of cubic Na3PS4 at the composition of x = 0 was determined by the Scherrer equation from the full width of half maximum of the peak with the highest intensity; the size of cubic Na3PS4 increased from ca. 13 nm to ca. 22 nm by the heat treatment. At the composition of x = 25, new peaks in addition to the peaks of the cubic Na3PS4 were observed. Only new peaks appeared at the composition of x = 67. The pattern at the composition of x = 100 differed completely from that of x = 67, indicating that a different unknown phase was precipitated in the glass–ceramic of x = 100. Unfortunately, we have not identified these two unknown phases at the present stage. In the following discussion, we describe the unknown phases observed at the composition of x = 67 and x = 100 as “unknown I” and “unknown II” phases, respectively.


image file: c4ra00996g-f3.tif
Fig. 3 XRD patterns of the (100 − x)Na3PS4·xNa4SiS4 heat-treated (glass–ceramic) samples. A silicon powder as an internal standard was added to the glass–ceramic powders in the composition range of 0 ≤ x ≤ 25.

The temperature dependence of conductivity of the 94Na3PS4·6Na4SiS4 glass–ceramic pellets is portrayed in Fig. 4. The inset shows a complex impedance plot of the glass–ceramic measured at 25 °C. In the plot, a part of a semicircle in the higher-frequency region and a spike in the lower-frequency region were observed, suggesting that the glass–ceramic behaves as a typical ionic conductor. The former component was attributed to bulk and grain boundary contributions, which were not separated distinctly. The total conductivity, which includes bulk and grain-boundary components, was determined from the total resistance (Rtotal) at the cross-section of the semicircle and the spike on the x-axis. The total conductivity obeys the Arrhenius equation, σ = σ0[thin space (1/6-em)]exp(−Ea/RT). Therefore, activation energy (Ea) for conduction was calculated from the slope in the temperature dependence of conductivity.


image file: c4ra00996g-f4.tif
Fig. 4 Temperature dependence of the conductivities of the 94Na3PS4·6Na4SiS4 (mol%) glass–ceramic sample. Inset is a complex impedance plot of the glass–ceramic sample at room temperature.

Fig. 5(a) shows the composition dependence of ambient temperature conductivities of the (100 − x)Na3PS4·xNa4SiS4 samples. Open circles denote the conductivity for the as-prepared samples by milling. In the composition range of 25 ≤ x ≤ 100, where amorphous samples were obtained, the conductivities of the as-prepared samples were about 10−5 S cm−1. In the composition range of 0 ≤ x ≤ 10, where the samples included the cubic Na3PS4 phase, the conductivities were 10−5–10−4 S cm−1. Closed circles denote conductivity for the heat-treated samples (glass–ceramics). In the composition range of 25 ≤ x ≤ 100, where the unknown I or II phase was precipitated, the conductivities of the glass–ceramics were 10−7–10−5 S cm−1; the conductivities were lower than those of as-prepared samples. Conductivities of the unknown I or II crystals are expected to be lower than those of the amorphous samples. In the composition range of 0 ≤ x ≤ 10, where the cubic Na3PS4 phase was mainly crystallized, the conductivities increased to more than 10−4 S cm−1 by heat treatment. All the glass–ceramics in the composition range were prepared by heat-treatment at 220 °C. Fig. 5(b) shows the composition dependence of ambient temperature conductivities and activation energies for conduction of the (100 − x)Na3PS4·xNa4SiS4 (0 ≤ x ≤ 10) glass–ceramics. The conductivity increased with an increase of the x content from x = 0 to 6 in the (100 − x)Na3PS4·xNa4SiS4, whereas the activation energies were similar in the composition range. Improvement of the conductivities would be attributed to the increase of pre-exponential factor (σ0). The 94Na3PS4·6Na4SiS4 glass–ceramic showed the highest conductivity of 7.4 × 10⁻⁴ S cm−1, which was 1.7 times higher than the conductivity of the Na3PS4 glass–ceramic (x = 0). The conductivity of glass–ceramics is affected by both precipitated crystalline phases and glass compositions. Although the conductivity of the Na4SiS4 glass (2 × 10⁻⁵ S cm−1 as shown in Fig. 5(a)) is higher than that of the Na3PS4 glass (6 × 10⁻⁶ S cm−1),7 the conductivity of the 94 Na3PS4·6 Na4SiS4 glass–ceramic is two orders of magnitude higher than that of the Na4SiS4 glass. Thus, the contribution of glass composition to the conductivity enhancement of glass–ceramic (x = 6) would be small. The origin of the conductivity enhancement is investigated by XRD measurement as shown in Fig. 3. Neither a clear shift of peak positions nor an increase in peak intensities of the cubic Na3PS4 was observed from partial substitution of Na4SiS4 for Na3PS4. To examine a possible formation of solid-solution, the Rietveld analysis for the XRD data of the glass–ceramics is now in progress. In addition, detailed structural analyses of the glass–ceramics using neutron and/or synchrotron X-ray diffraction are necessary for further discussion.


image file: c4ra00996g-f5.tif
Fig. 5 (a) Composition dependence of the room temperature conductivities for the (100 − x)Na3PS4·xNa4SiS4 samples. Open and closed circles denote the conductivities for the as-prepared samples and heat-treated (glass–ceramic) samples, respectively. (b) Composition dependence of the room temperature conductivities and the activation energies for conduction of the (100 − x)Na3PS4·xNa4SiS4 (0 ≤ x ≤ 10) glass–ceramic samples. Circles and triangles denote the conductivities and the activation energies, respectively.

The electrochemical window of the 90Na3PS4·10Na4SiS4 glass–ceramic electrolyte was examined using cyclic voltammetry. As depicted in Fig. 6, cathodic and anodic currents that are respectively attributable to sodium deposition and dissolution were observed at about 0 V vs. Na+/Na. No significant current attributable to electrolyte decomposition was detected up to 5 V vs. Na+/Na. These results suggest that the Na3PS4–Na4SiS4 glass–ceramic electrolyte exhibited a wide electrochemical window of 5 V and that it was electrochemically stable against Na metal.


image file: c4ra00996g-f6.tif
Fig. 6 Cyclic voltammogram of the 90Na3PS4·10Na4SiS4 glass–ceramic sample.

4. Conclusions

For this study, (100 − x)Na3PS4·xNa4SiS4 milled samples were prepared using a planetary ball mill apparatus. The cubic Na3PS4 phase was crystallized directly in as-prepared samples at the composition range of 0 ≤ x ≤ 10. Amorphous materials were obtained for samples between 25 ≤ x ≤ 100. All as-prepared samples showed conductivities of about 10−5 S cm−1 at 25 °C.

The (100 − x)Na3PS4·xNa4SiS4 glass–ceramics were prepared by heat treatment of the milled samples. Unknown crystals were precipitated in glass–ceramics at the compositions of x = 25, 67, and 100. The conductivities of the glass–ceramics were lower than those of the milled samples. In the composition range of 0 ≤ x ≤ 10, the cubic Na3PS4 phase was only crystallized in the glass–ceramics. Their conductivities were greater than 10−4 S cm−1 at 25 °C. Glass–ceramics with 6 mol% Na4SiS4 showed the highest conductivity of 7.4 × 10⁻⁴ S cm−1, which is higher than that of Na3PS4 glass–ceramic without Na4SiS4. Cyclic voltammetry showed that the 90Na3PS4·10Na4SiS4 glass–ceramic electrolyte exhibited a wide electrochemical window of 5 V. The Na3PS4–Na4SiS4 glass–ceramic electrolytes showed not only high ionic conductivity but also high electrochemical stability. Therefore, this electrolyte system presents benefits for improving all-solid-state sodium secondary batteries.

Acknowledgements

This research was financially supported by JST, “Advanced Low Carbon Technology Research and Development Program (ALCA)”.

References

  1. M. Armand and J. M. Tarascon, Nature, 2008, 451, 652 CrossRef CAS PubMed.
  2. J. M. Tarascon and M. Armand, Nature, 2001, 414, 359 CrossRef CAS PubMed.
  3. C. Delmas, J. Braconnier, C. Fouassier and P. Hagenmuller, Solid State Ionics, 1981, 3–4, 165 CrossRef CAS.
  4. S. Komaba, C. Takei, T. Nakayama, A. Ogata and N. Yabuuchi, Electrochem. Commun., 2012, 12, 355 CrossRef PubMed.
  5. M. Nishijima, I. D. Gocheva, S. Okada, T. Doi, J. I. Yamaki and T. Nishida, J. Power Sources, 2009, 190, 558 CrossRef CAS PubMed.
  6. C. W. Park, H. S. Ryu, K. W. Kim, J. H. Ahn, J. Y. Lee and H. J. Ahn, J. Power Sources, 2007, 165, 450 CrossRef CAS PubMed.
  7. A. Hayashi, K. Noi, A. Sakuda and M. Tatsumisago, Nat. Commun., 2012, 3, 856 CrossRef PubMed.
  8. A. Hayashi, K. Noi, N. Tanibata, M. Nagao and M. Tatsumisago, J. Power Sources, 2014, 258, 420 CrossRef PubMed.
  9. R. Kanno and M. Maruyama, J. Electrochem. Soc., 2001, 148, A742 CrossRef CAS PubMed.
  10. N. Kamaya, K. Homma, Y. Yamakawa, M. Hirayama, R. Kanno, M. Yonemura, T. Kamiyama, Y. Kato, S. Hama, K. Kawamoto and A. Mitsui, Nat. Mater., 2011, 10, 682 CrossRef CAS PubMed.
  11. A. Hayashi, Y. Ishikawa, S. Hama, T. Minami and M. Tatsumisago, Electrochem. Solid-State Lett., 2003, 6, A47 CrossRef CAS PubMed.

This journal is © The Royal Society of Chemistry 2014
Click here to see how this site uses Cookies. View our privacy policy here.