DOI:
10.1039/C4RA00849A
(Paper)
RSC Adv., 2014,
4, 14513-14526
Acid-induced formation of hydrogen-bonded double helix based on chiral polyphenyl-bridged bis(2,2′-bipyridine) ligands†
Received
29th January 2014
, Accepted 10th March 2014
First published on 11th March 2014
Abstract
A series of chiral polyphenyl-bridged bis(2,2′-bipyridine) ligands comprising one to four phenyl units were synthesized. The ligands give a weak signal in the CD spectra, but upon addition of tetrachloroferric acid or perchloric acid, a more intense CD signal is observed for ligands having two or more phenyl units. Titration experiments show that the CD signal comes from a monoprotonated species which gives broadened and upfield shifted 1H NMR signals. Variable temperature NMR experiments split the broadened signals into two sets of signals when the temperature is decreased. One of the sets is remarkably upfield while the other has chemical shifts similar to those of the free ligand. The X-ray crystal structures of a free ligand (mono phenyl), a monoprotonated ligand (biphenyl) and a biprotonated ligand (tetraphenyl) were obtained and the structure of the monoprotonated ligand shows that it is a double-stranded helix, which is stabilized by interior hydrogen bonding between the pyridinium N–H and the pyridine N of another ligand strand, and exterior CH⋯Cl hydrogen bonding between FeCl4− and the two ligand strands. Theoretical DFT calculations show that there is such stabilization in solution as well. With the perchlorate anion, the helix formation process is reversible with Et3N which accompanies an on/off CD signal change.
Introduction
The double helix is ubiquitous in biological molecules and its sophisticated structure is often closely related to its biological function.1 Inspired by nature, chemists have great interest to prepare artificial molecules with double helical structure.2–8 Self-assembly is the most commonly used approach in which non-covalent interactions, such as electrostatic,9,10 metal–ligand,7,8,11–16 π–π stacking17–19 and hydrogen bonding,20–24 drive the two strands to intertwine in the formation process. These interactions of the two strands can come from motifs that are incorporated into the strands during synthesis20 or from a third component, like a metal ion, which induces the interactions.7,8
Important to both biological and chemical process,25,26 anions can form hydrogen-bond and this hydrogen-bonding interaction has been shown to play curial role in the formation of many supramolecular system27,28 which include double helices.29–32 In the double helix examples, chloride, fluoride or sulfate, are locate at the helical axis, and form multiple strong N–H⋯Cl, N–H⋯F and N–H⋯O hydrogen bonds, respectively, to both ligand strands to stabilize the double helices.
Proton, the smallest cation, can interact with the lone pair electron of a ligand strand and lead to hydrogen bonds. Huc et al.33 and Aida et al.34 have both reported the use of proton to induced formation of single-stranded helices, however, to the best of our knowledge, double helix formation induced by proton is not known. We have previously reported the synthesis of Mn double-stranded helicates with mono- to tri-phenyl-bridged bis(2,2′-bipyridine) L1–3 ligands.35 Herein, together with a tetraphenyl-bridged bis(2,2′-bipyridine) L4, we report the synthesis of this series of ligands. Upon protonation, ligands L2–4 give intense CD signal in the presence of FeCl4− or ClO4− anion. CD and NMR titration experiments suggest that a monoprontonated ligand species is responsible for the intense CD signals and X-ray crystal structures of monoprotonated L2 shows that a double-stranded helix is responsible for the signal.
Experimental
Chemicals and starting materials
Solvents used for synthesis were of analytical grade. All starting chemicals were of reagent-grade quality and were obtained commercially and used as received without further purification. Synthesis of chiral bromobipyridine 1 was reported previously.36
Physical measurements and instrumentation
1H, COSY and NOESY NMR spectra were recorded on Bruker 400 MHz instrument. The 1H and chemical shift was referred to TMS as reference. Electrospray (ESI) mass spectra were measured by a PE SCIEX API 150 EX system. CD spectra were recorded on a Biokin MOS-450 instrument with a 1 mm cell.
Crystal structure determination
For crystal structure of L1, data was collected at 293 K with an Oxford Diffraction Gemini S Ultra X-ray single crystal diffractometer using graphite monochromatized Mo-Kα radiation (λ = 0.71073 Å). For structure of [(L2)2H2](ClO4)2 and [(L4)H2(Cl)](FeCl4), data were collected at 133 K with an Oxford Diffraction Gemini S Ultra X-ray single crystal diffractometer using graphite monochromatized Cu-Kα radiation (λ = 1.54178 Å). All collected frames were processed with the software SAINT, and absorption correction was applied (SAD-ABS) to the collected reflections. The structure of the complex was solved by direct methods (SHELXTL) in conjunction with standard difference Fourier syntheses. All non-hydrogen atoms were assigned with anisotropic displacement parameters. The hydrogen atoms were generated in their idealized positions and allowed to ride on the respective carbon atoms. Crystal data of L1. C80H76N8O, M = 1165.49, orthorhombic, a = 10.0224(4), b = 13.5194(6), c = 24.219(1) Å, U = 3281.6(2) Å3, space group P212121, Z = 4, 10071 reflections measured, 5493 unique (Rint = 0.0228) which were used in all calculation. The final wR(F2) was 0.0804 (all data). Crystal data of [(L2)2H2](FeCl4)2. C96H94Cl8Fe2N8O1.75, M = 1783.09, monoclinic, a = 30.7135(9), b = 21.8661(6), c = 15.6061(5) Å, U = 10290.2(5) Å3, space group C2, Z = 4, 24178 reflections measured, 14245 unique (Rint = 0.0346) which were used in all calculation. The final wR(F2) was 0.1416 (all data). Crystal data of [(L2)2H2](FeCl4)2. C96H94Cl8Fe2N8O1.75, M = 1783.09, monoclinic, a = 30.7135(9), b = 21.8661(6), c = 15.6061(5) Å, U = 10290.2(5) Å3, space group C2, Z = 4, 24178 reflections measured, 14245 unique (Rint = 0.0346) which were used in all calculation. The final wR(F2) was 0.1416 (all data). Crystal data of [(L4)H2](Cl)(FeCl4). C59H56Cl5FeN4O, M = 1070.18, monoclinic, a = 11.4756(3), b = 17.6487(5), c = 26.0159(7) Å, U = 5182.0(2) Å3, space group C1211, Z = 4, 12966 reflections measured, 9565 unique (Rint = 0.0259) which were used in all calculation. The final wR(F2) was 0.099 (all data).
DFT calculations
All calculations were done at M06-2X (hybrid meta exchange-correlation functional with double the amount of nonlocal exchange) functional37 using LanL2DZ basis set for Fe,38–40 6-31G(d) basis sets for H, C, N, and 6-31 + G(d) basis sets for O, Cl atoms. The solvent effect is taken account by the Polarizable Continuum Model.41,42 Atom-in-molecule (AIM) analysis is performed with AIM2000 program.43 The wavefunction was taken from the optimized structure at the M06-2X level with using LanL2DZ basis set for Fe and 6-31G(d) basis set for all non-metal elements.
Procedure for synthesis of 2 and 3
A solution of 1 (1.45 mmol) and tetrakis(triphenylphospine)palladium(0) (0.06 mmol) in degased toluene (6 ml) was treated with a solution of sodium carbonate (2.0 mmol) in H2O (3 ml). A methanolic solution (3 ml) of 3-chlorophenylboronic acid (1.45 mmol) or 3-bromophenylboronic acid (1.19 mmol) was added. The mixture was stirred at 80 °C for 3 h under nitrogen. After cooling to room temperature, aqueous NH3 (30 ml) was added and the mixture was extracted by CH2Cl2. The combined organic layers were dried by MgSO4. Solvent was removed under reduced pressure. The crude product was purified by column chromatography (petroleum ether![[thin space (1/6-em)]](https://www.rsc.org/images/entities/char_2009.gif) :
:![[thin space (1/6-em)]](https://www.rsc.org/images/entities/char_2009.gif) ethyl acetate = 10
ethyl acetate = 10![[thin space (1/6-em)]](https://www.rsc.org/images/entities/char_2009.gif) :
:![[thin space (1/6-em)]](https://www.rsc.org/images/entities/char_2009.gif) 1). Products were isolated as white solid in 95% and 83% yield for 2 and 3, respectively. 1H NMR of 2 (300 MHz, CDCl3) δ 8.94 (d, J = 7.8 Hz, 1H), 8.60 (s, 1H), 8.49 (s, 1H), 8.05 (m, 2H), 7.95 (m, 1H), 7.85 (d, J = 8 Hz, 1H), 7.42 (m, 2H), 3.29 (d, J = 2.4 Hz, 2H), 3.02 (t, J = 5.4 Hz, 1H), 2.8 (m, 1H), 2.41 (s, 1H), 1.43 (s, 3H), 1.23 (d, J = 10.3 Hz, 1H), 0.64 (s, 3H). 1H NMR of 3 (300 MHz, CD2Cl2): δ 8.37 (s, 1H), 8.35 (d, 1H, J = 8.1 Hz), 8.31 (t, 1H, J = 1.8 Hz), 8.22 (s, 1H), 8.02 (d, 1H, J = 7.8 Hz), 7.85 (t, 1H, J = 7.8 Hz), 7.67 (d, 1H, 6.9 Hz), 7.55 (d, 1H, J = 7.8 Hz), 7.36 (t, 1H, J = 7.8 Hz), 3.10 (d, 1H, J = 2.7 Hz), 2.88 (t, 1H, J = 5.4 Hz), 2.70 (m, 1H), 2.33 (m, 1H), 1.42 (s, 3H), 1.21 (d, 1H, J = 6.9 Hz), 0.67 (s, 3H).
1). Products were isolated as white solid in 95% and 83% yield for 2 and 3, respectively. 1H NMR of 2 (300 MHz, CDCl3) δ 8.94 (d, J = 7.8 Hz, 1H), 8.60 (s, 1H), 8.49 (s, 1H), 8.05 (m, 2H), 7.95 (m, 1H), 7.85 (d, J = 8 Hz, 1H), 7.42 (m, 2H), 3.29 (d, J = 2.4 Hz, 2H), 3.02 (t, J = 5.4 Hz, 1H), 2.8 (m, 1H), 2.41 (s, 1H), 1.43 (s, 3H), 1.23 (d, J = 10.3 Hz, 1H), 0.64 (s, 3H). 1H NMR of 3 (300 MHz, CD2Cl2): δ 8.37 (s, 1H), 8.35 (d, 1H, J = 8.1 Hz), 8.31 (t, 1H, J = 1.8 Hz), 8.22 (s, 1H), 8.02 (d, 1H, J = 7.8 Hz), 7.85 (t, 1H, J = 7.8 Hz), 7.67 (d, 1H, 6.9 Hz), 7.55 (d, 1H, J = 7.8 Hz), 7.36 (t, 1H, J = 7.8 Hz), 3.10 (d, 1H, J = 2.7 Hz), 2.88 (t, 1H, J = 5.4 Hz), 2.70 (m, 1H), 2.33 (m, 1H), 1.42 (s, 3H), 1.21 (d, 1H, J = 6.9 Hz), 0.67 (s, 3H).
Procedure for synthesis of 4
A solution of 3 (11.6 mmol) and tetrakis(triphenylphospine)palladium(0) (5 mol%) in degased toluene (36 ml) was treated with a solution of sodium carbonate (20 mmol) in H2O (16.5 ml). A methanolic solution (16.5 ml) of 3-chlorophenylboronic acid (11.6 mmol) was added. The mixture was stirred at 95 °C for 24 h under nitrogen. After cooling to room temperature, aqueous NH3 (50 ml) was added and the mixture was extracted by CH2Cl2. The combined organic layers were dried by MgSO4. Solvent was removed under reduced pressure. The crude product was purified by column chromatography (petroleum ether![[thin space (1/6-em)]](https://www.rsc.org/images/entities/char_2009.gif) :
:![[thin space (1/6-em)]](https://www.rsc.org/images/entities/char_2009.gif) ethyl acetate = 10
ethyl acetate = 10![[thin space (1/6-em)]](https://www.rsc.org/images/entities/char_2009.gif) :
:![[thin space (1/6-em)]](https://www.rsc.org/images/entities/char_2009.gif) 1). Products were isolated as white solid with 93% yield. 1H NMR (400 MHz, CDCl3) δ 8.56 (d, J = 7.8 Hz, 1H), 8.49 (s, 1H), 8.33 (s, 1H), 8.29 (t, J = 1.5 Hz, 1H), 8.16 (d, J = 7.3 Hz, 1H), 7.98 (t, J = 7.8 Hz, 1H), 7.85 (d, J = 7.2 Hz, 1H), 7.70 (t, J = 1.7 Hz, 1H), 7.66 (d, J = 7.7 Hz, 1H), 7.63 (d, J = 7.6 Hz, 1H), 7.59 (d, J = 7.6 Hz, 1H), 7.43 (t, J = 7.7 Hz, 1H), 7.38 (d, J = 8.0 Hz, 1H), 3.18 (d, J = 2.5 Hz, 2H), 2.96 (t, J = 5.4 Hz, 1H), 2.8 (m, 1H), 2.4 (m, 1H), 1.46 (s, 3H), 1.27 (t, J = 8.2 Hz, 1H), 0.69 (s, 3H).
1). Products were isolated as white solid with 93% yield. 1H NMR (400 MHz, CDCl3) δ 8.56 (d, J = 7.8 Hz, 1H), 8.49 (s, 1H), 8.33 (s, 1H), 8.29 (t, J = 1.5 Hz, 1H), 8.16 (d, J = 7.3 Hz, 1H), 7.98 (t, J = 7.8 Hz, 1H), 7.85 (d, J = 7.2 Hz, 1H), 7.70 (t, J = 1.7 Hz, 1H), 7.66 (d, J = 7.7 Hz, 1H), 7.63 (d, J = 7.6 Hz, 1H), 7.59 (d, J = 7.6 Hz, 1H), 7.43 (t, J = 7.7 Hz, 1H), 7.38 (d, J = 8.0 Hz, 1H), 3.18 (d, J = 2.5 Hz, 2H), 2.96 (t, J = 5.4 Hz, 1H), 2.8 (m, 1H), 2.4 (m, 1H), 1.46 (s, 3H), 1.27 (t, J = 8.2 Hz, 1H), 0.69 (s, 3H).
Procedure for synthesis of L1 and L3
Degas toluene (16 ml), MeOH (6 ml) and water (6 ml) were added to a flask containing Pd(PPh3)4 (0.17 g, 3 mol%), 1 or 3 (4.4 mmol), 1,3-phenyldiboronic acid (0.34 g, 2 mmol) and sodium carbonate (0.92 g). The mixture was heated at 80 °C for 24 h. It was cooled to room temperature. Ammonia solution in saturated Na2CO3 solution was added and the solution was stirred for 5 min. It was extracted by CH2Cl2. Solvent was dried under vacuo, and the compound was purified by column chromatograph with solvent (dichloromethane![[thin space (1/6-em)]](https://www.rsc.org/images/entities/char_2009.gif) :
:![[thin space (1/6-em)]](https://www.rsc.org/images/entities/char_2009.gif) diethyl ether = 10
diethyl ether = 10![[thin space (1/6-em)]](https://www.rsc.org/images/entities/char_2009.gif) :
:![[thin space (1/6-em)]](https://www.rsc.org/images/entities/char_2009.gif) 1). The crude yellow solution can be further purified by washing with MeCN. Products were isolated as pale yellow solid with 57% and 30% yield for L1 and L2, respectively. 1H NMR of L1 (400 MHz, CDCl3): δ 8.81 (t, 1H, J = 1.6 Hz), 8.85 (s, 2H), 8.38 (d, 2H, J = 6.7 Hz), 8.27 (d, 2H, J = 7.8 Hz), 8.25 (s, 2H), 7.93 (t, 2H, J = 7.7 Hz), 7.87 (d, 2H, J = 6.8 Hz), 7.69 (t, 1H, J = 7.7 Hz) 3.11 (d, 4H, J = 2.6 Hz), 2.90 (t, 2H, J = 5.4 Hz), 2.73 (m, 2H), 2.34 (m, 2H), 1.44 (s, 6H), 1.27 (d, 2H, J = 9.6 Hz), 0.69 (s, 6H). 13C NMR (CDCl3): δ 156.65, 156.61, 154.86, 145.68, 145.57, 143.30, 140.30, 140.36, 137.86, 129.38, 127.93, 125.80, 120.90, 120.42, 119.50, 44.82, 40.38, 39.54, 33.30, 32.08, 26.28, 21.66. 1H NMR of L3 (300 MHz, CDCl3): δ 8.43 (m, 4H), 8.36 (d, 2H, J = 6 Hz), 8.22 (s, 2H), 8.16 (d, 2H, J = 6 Hz), 8.05 (t, 1H, J = 1.8 Hz), 7.90 (t, 2H, J = 7.8 Hz), 7.81 (d, 2H, J = 7.8 Hz), 7.75 (t, 4H, J = 7.5 Hz), 7.63 (t, 3H, J = 7.5 Hz), 3.05 (d, 4H, J = 2.7 Hz), 2.88 (t, 2H, J = 5.4 Hz), 2.70 (m, 2H), 2.30 (m, 2H), 1.41 (s, 6H), 1.21 (d, 2H, J = 6.9 Hz), 0.65 (s, 6H). 13C NMR (CDCl3): δ 156.62, 156.54, 154.75, 145.65, 145.58, 143.31, 142.15, 141.91, 140.53, 137.87, 129.52, 129.43, 128.09, 126.67, 126.44, 126.26, 120.88, 120.35, 119.48, 44.80, 40.37, 39.49, 33.23, 32.06, 26.25, 21.63.
1). The crude yellow solution can be further purified by washing with MeCN. Products were isolated as pale yellow solid with 57% and 30% yield for L1 and L2, respectively. 1H NMR of L1 (400 MHz, CDCl3): δ 8.81 (t, 1H, J = 1.6 Hz), 8.85 (s, 2H), 8.38 (d, 2H, J = 6.7 Hz), 8.27 (d, 2H, J = 7.8 Hz), 8.25 (s, 2H), 7.93 (t, 2H, J = 7.7 Hz), 7.87 (d, 2H, J = 6.8 Hz), 7.69 (t, 1H, J = 7.7 Hz) 3.11 (d, 4H, J = 2.6 Hz), 2.90 (t, 2H, J = 5.4 Hz), 2.73 (m, 2H), 2.34 (m, 2H), 1.44 (s, 6H), 1.27 (d, 2H, J = 9.6 Hz), 0.69 (s, 6H). 13C NMR (CDCl3): δ 156.65, 156.61, 154.86, 145.68, 145.57, 143.30, 140.30, 140.36, 137.86, 129.38, 127.93, 125.80, 120.90, 120.42, 119.50, 44.82, 40.38, 39.54, 33.30, 32.08, 26.28, 21.66. 1H NMR of L3 (300 MHz, CDCl3): δ 8.43 (m, 4H), 8.36 (d, 2H, J = 6 Hz), 8.22 (s, 2H), 8.16 (d, 2H, J = 6 Hz), 8.05 (t, 1H, J = 1.8 Hz), 7.90 (t, 2H, J = 7.8 Hz), 7.81 (d, 2H, J = 7.8 Hz), 7.75 (t, 4H, J = 7.5 Hz), 7.63 (t, 3H, J = 7.5 Hz), 3.05 (d, 4H, J = 2.7 Hz), 2.88 (t, 2H, J = 5.4 Hz), 2.70 (m, 2H), 2.30 (m, 2H), 1.41 (s, 6H), 1.21 (d, 2H, J = 6.9 Hz), 0.65 (s, 6H). 13C NMR (CDCl3): δ 156.62, 156.54, 154.75, 145.65, 145.58, 143.31, 142.15, 141.91, 140.53, 137.87, 129.52, 129.43, 128.09, 126.67, 126.44, 126.26, 120.88, 120.35, 119.48, 44.80, 40.37, 39.49, 33.23, 32.06, 26.25, 21.63.
Procedure for synthesis of L2
To a solution of NiCl2·6H2O (1.2 mmol) in degassed DMF (15 ml) at 70 °C under nitrogen, triphenylphosphine (4.8 mmol) was added to give a blue solution. Zinc powder (2.6 mmol) was then added and the resulting mixture was stirred for an hour, in which dark-brown mixture was formed. 2 (1 mmol) in degassed DMF (5 ml) was added slowly and the mixture stirred at 70 °C for 72 hours. The mixture was then allowed to cool to room temperature and 25% aqueous NH3 (25 ml) was added. The layers were separated, and the aqueous layers were extracted with CH2Cl2. The solution was dried with MgSO4 and solvent was removed under reduced pressure. Crude product was purified by column chromatography. Product was isolated as a pale yellow solid. Yield: 37%. 1H NMR of L2 (300 MHz, CDCl3): δ 8.43 (m, 2H), 8.37 (d, 2H, J = 7.5 Hz), 8.22 (s, 1H), 8.18 (d, 1H, J = 8.1 Hz), 7.90 (t, 1H, J = 7.8 Hz), 7.83 (d, 1H, J = 7.2 Hz), 7.78 (d, 1H, J = 7.8 Hz), 7.64 (t, 1H, J = 7.5 Hz), 3.05 (d, 2H, J = 2.7 Hz), 2.88 (t, 1H, J = 5.4 Hz), 2.70 (m, 1H), 2.31 (m, 1H), 1.42 (s, 3H), 1.21 (d, 1H, J = 6.9 Hz), 0.66 (s, 3H). 13C NMR (CDCl3): δ 156.43, 156.38, 154.63, 145.46, 145.39, 143.11, 140.13, 137.68, 129.18, 127.73, 125.57, 120.70, 120.23, 119.28, 44.56, 40.12, 39.30, 33.07, 31.85, 26.05, 21.44.
Procedure for synthesis of L4
To a solution of NiCl2·6H2O (3.8 mmol) in degassed DMF (17 ml) at 70 °C under nitrogen, triphenylphosphine (16 mmol) was added to give a blue solution. Zinc powder (6.4 mmol) was then added and the resulting mixture was stirred for an hour, in which dark-brown mixture was formed. Compound 4 (3.2 mmol) in degassed DMF (9 ml) was added slowly and the mixture stirred at 70 °C for 72 hours. The mixture was then allowed to cool to room temperature and 25% aqueous NH3 (100 ml) was added. The layers were separated, and the organic layers were washed with CH2Cl2. The solution was dried with MgSO4 and solvent was removed under reduced pressure. Crude product was purified by column chromatography (dichloromethane![[thin space (1/6-em)]](https://www.rsc.org/images/entities/char_2009.gif) :
:![[thin space (1/6-em)]](https://www.rsc.org/images/entities/char_2009.gif) n-hexane
n-hexane![[thin space (1/6-em)]](https://www.rsc.org/images/entities/char_2009.gif) :
:![[thin space (1/6-em)]](https://www.rsc.org/images/entities/char_2009.gif) diethyl ether = 30
diethyl ether = 30![[thin space (1/6-em)]](https://www.rsc.org/images/entities/char_2009.gif) :
:![[thin space (1/6-em)]](https://www.rsc.org/images/entities/char_2009.gif) 6
6![[thin space (1/6-em)]](https://www.rsc.org/images/entities/char_2009.gif) :
:![[thin space (1/6-em)]](https://www.rsc.org/images/entities/char_2009.gif) 1). Product was isolated as a pale brown solid in 26% yield. 1H NMR (400 MHz, CDCl3) δ 8.42 (d, J = 2.8 Hz, 1H), 8.37 (d, J = 7.6 Hz, 1H), 8.22 (s, 1H), 8.16 (d, J = 7.3 Hz, 1H), 8.02 (s, 1H), 7.90 (t, J = 7.8 Hz, 1H), 7.80 (d, J = 7.7 Hz, 1H), 7.74 (t, J = 7.2 Hz, 2H), 7.62 (d, J = 13.8, 7.6 Hz), 3.06 (d, J = 2.3 Hz, 1H), 2.89 (t, J = 5.4 Hz, 1H), 2.7 (m, 1H), 2.32 (s, 1H), 1.43 (s, 2H), 1.25 (d, J = 9.8 Hz, 1H), 0.67 (s, 2H). 13C NMR (CDCl3): δ 156.40, 156.33, 254.57, 145.46, 125.40, 143.12, 141.98, 141.84, 141.65, 140.31, 137.71, 129.28, 127.90, 126.54, 126.43, 126.30, 126.05, 120.72, 120.19, 119.33, 44.57, 40.14, 39.28, 33.02, 31.87, 23.06, 21.45.
1). Product was isolated as a pale brown solid in 26% yield. 1H NMR (400 MHz, CDCl3) δ 8.42 (d, J = 2.8 Hz, 1H), 8.37 (d, J = 7.6 Hz, 1H), 8.22 (s, 1H), 8.16 (d, J = 7.3 Hz, 1H), 8.02 (s, 1H), 7.90 (t, J = 7.8 Hz, 1H), 7.80 (d, J = 7.7 Hz, 1H), 7.74 (t, J = 7.2 Hz, 2H), 7.62 (d, J = 13.8, 7.6 Hz), 3.06 (d, J = 2.3 Hz, 1H), 2.89 (t, J = 5.4 Hz, 1H), 2.7 (m, 1H), 2.32 (s, 1H), 1.43 (s, 2H), 1.25 (d, J = 9.8 Hz, 1H), 0.67 (s, 2H). 13C NMR (CDCl3): δ 156.40, 156.33, 254.57, 145.46, 125.40, 143.12, 141.98, 141.84, 141.65, 140.31, 137.71, 129.28, 127.90, 126.54, 126.43, 126.30, 126.05, 120.72, 120.19, 119.33, 44.57, 40.14, 39.28, 33.02, 31.87, 23.06, 21.45.
Procedure for reversibility experiment
To a solution of L (L2–4, 3 × 10⁻⁴ M in CH2Cl2) in a 3 mm cell, 1 equiv. of HClO4 was added, and the CD spectrum of the solution was obtained. After that, 1.2 equiv. of NEt3 was added to the above solution to fully restore the original spectrum. The experiments were repeated by following the sequence, and the absorption at 334 nm which is the maximum of the induced CD signals was plotted.
Results and discussion
Synthesis of polyphenyl-bridged bis(2,2′-bipyridine) ligands
Chiral polyphenyl-bridged bis(2,2′-bipyridine) ligands L1–4 with pinene-based chiral substituents at the 4,5-position of terminal pyridine rings were prepared from bipyridine intermediate 1, which was obtained from reported Kröhnke condensation between of pyridinium iodide and α,β-unsaturated ketone.36 The Pd-catalyzed Suzuki coupling between 1 and m-phenylenediboronic acid with Na2CO3 in a mixture of H2O, MeOH and toluene yielded the monophenyl-bridged L1 in 57% yield. For the synthesis of biphenyl-bridged L2, Pd-catalyzed Suzuki coupling between 1 and 3-chlorophenylboronic acid resulted in the chlorophenylbipyridine intermediate 2. Ni(0)-mediated homocoupling of 2 in DMF gave L2 in 37% yield. For the synthesis of triphenyl-bridged L3, the reaction between 2 and m-phenylenediboronic acid with Pd(PPh3)4 as catalyst was first tried, but no reaction was observed. Then, bromophenylbipyridine intermediate 3, prepared by Pd-catalyzed Suzuki coupling between 1 and 3-bromophenylboronic acid, was employed. A sub-stoichiometric amount of 3-bromophenylboronic acid was used to reduce the formation of the bromobiphenylbipyridine and Suzuki coupling between 3 and m-phenylenediboronic acid yielded L3 in 30% yield. For the synthesis of tetraphenyl-bridged L4, intermediate 4, synthesized by the reaction between 3 and 3-chlorophenylboronic acid with Pd(PPh3)4 as catalyst, was used. Ni(0)-mediated homocoupling of 4 yielded L4 in 26% yield (Scheme 1).
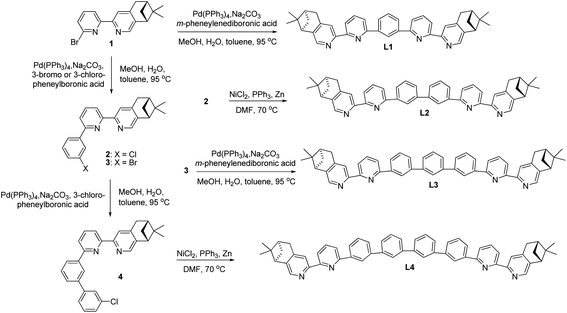 |
| | Scheme 1 Preparation of polyphenyl-bridged bis(2,2′-bipyridine) L1–4. | |
Effect of acid on the CD spectra of polyphenyl-bridged bis(2,2′-bipyridine) ligands
Although L1–4 contains chiral substitution at the 4,5-position of the terminal pyridine rings, they gave only a weak CD absorption. Fig. 1a–d show the effect of different acids on the CD spectrum of the ligands. The phenyl-bridged L1 does not show much effect with addition of acid. Only very small change in the CD spectrum of L1 is observed (Fig. 1a). However, L2–4 show much greater change with addition of some acid. Fig. 1b shows the results obtained with the biphenyl-bridged L2. Addition of HFeCl4 gives an intense induced CD signal absorption at 334 nm with Δε = 6.0 M−1 cm−1.44 HClO4 and HOTf give similar change but with weaker intensity, Δε = 4.0 and 2.0 M−1 cm−1, respectively. Fig. 1c shows the results obtained with the triphenyl-bridged L3. Similar to the results of L2, addition of HFeCl4, HClO4 and HOTf to L3 leads to induced CD signals at 333 nm with Δε = 10.2, 4.3, and 3.0 M−1 cm−1, respectively. These signals have larger intensity when compared to L2. Fig. 1d shows the results obtained with the tetraphenyl-bridged L4. Intense induced CD signals with Δε = 9.0, 5.0, and 1.7 M−1 cm−1 are observed at 330 nm with addition of HFeCl4, HClO4 and HOTf, respectively, which are comparable to L3. The trend of HFeCl4 giving the strongest absorption, followed by HClO4 and then HOTf, is very similar to L2 and L3. With the additions of acids other than HFeCl4, HClO4 and HOTf, the CD spectra of L2–4 give very minimal change.
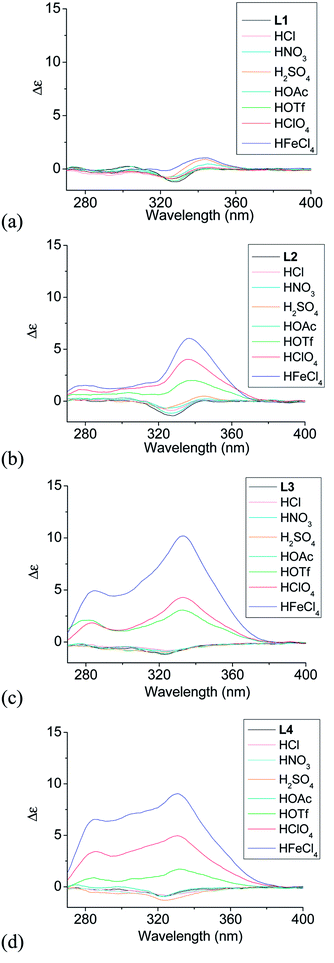 |
| | Fig. 1 CD spectra of L1–4 (3 × 10⁻⁴ M) with addition of different acids (1 equiv.). | |
When comparing the polyphenyl-bridged ligands, much stronger acid-induced CD spectral change are observed with L2–4 than L1 and it seems to suggest that L2–4 give similar species upon protonation. For L2–4, the CD signal change does not seem to follow the trend of the pKa value; for example, HClO4 (pKa = −10.0) give a more intense signal than HOTf (pKa = −14.0). Other acids like HOAc (pKa = −4.8), HCl (pKa = −8.0), HNO3 (pKa = −1.3), H2SO4 (pKa = −3.0) give only very small or no CD change. These results suggest that the CD signal change is not triggered by protonation alone. Anion seems to have a role in the change of the CD signal as well.
ESI-MS study
With HFeCl4 giving the largest CD signals, the ESI-MS spectra of the ligands with 1 equiv. of HFeCl4 were obtained for L1–4 (3 × 10⁻⁴ M). The spectrum with L1 is shown in Fig. 2a. The spectrum show peaks at m/z 575.8 and 1151.6, which can be assigned to [(L1)H]+ and [(L1)2H]+, respectively, indicating protonation of L1 by HFeCl4. Fig. 2b shows the spectrum with L2. Similar to L1, peaks corresponding to [(L2)H]+ and [(L2)2H]+ are observed, however, in addition to these peaks, a peak at 1500.8 which can be assigned to [(L2)2H2](FeCl4)+ is also observed. This formula indicates that a dimeric form of monoprotonated L2 may have been formed. The spectrum with L3, which is shown in Fig. 2c, has peaks at m/z 729.1, 1452.4 which corresponds to [(L3)H]+ and [(L3)2H]+, respectively. Again, the spectrum of L3 shows peak corresponded to a dimeric species, [(L3)2H2](FeCl4)+, at 1654.3. For L4, the spectrum show peaks corresponded to [(L4)H]+, [(L4)2H]+, and [(L4)2H2](FeCl4)+ at m/z 805.7, 1606.4, and 1806.5 respectively (Fig. 2d). The signals of [(L)2H2](FeCl4)+ (L = L2–4) observed in the spectra suggest the presences of dimeric species [(L)2H2](FeCl4)2, but this species is not observed with L1.
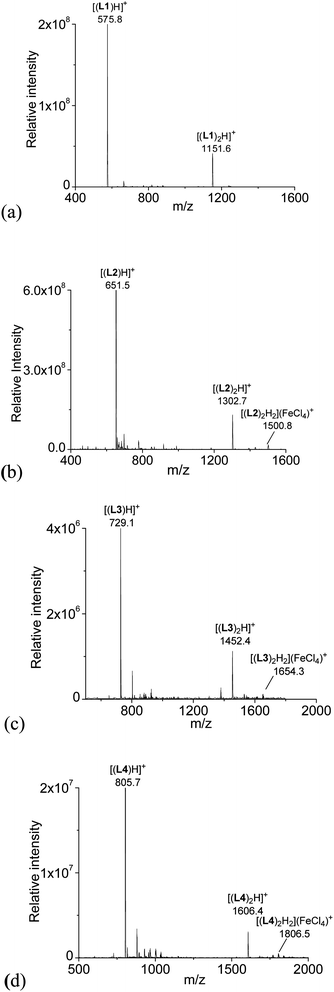 |
| | Fig. 2 ESI-MS spectrum of a CH2Cl2 solution of L1–4 with addition of HFeCl4. | |
Acid titration monitored by CD
In order to have a better understanding of the change in CD signals, titration experiments were carried out. As shown in Fig. 3, addition of various concentration of HFeCl4 into a 3 × 10⁻⁴ M solution of L2 first give positive absorption, then decrease in absorption. The inset shows the change in intensity of the absorption at 334 nm. The intensity of the signal reaches maximum when there is 1 equiv. of HFeCl4. Further addition decreases the signal intensity, and finally the positive CD absorption completely disappeared when 3 equiv. of HFeCl4 is added. A similar trend in the change of CD signals was also observed in the titration experiments of L3 and L4. Fig. 4 and 5 show the change of the intensity of the CD signals with concentration of HFeCl4. The signal reach maximum when there is 1 equiv. of HFeCl4, and the intensity of signal decreases with further increase of HFeCl4. These titration experiments suggest that the CD signals are originated from a monoprotonated state, and the acid-induced signal is lost upon further protonation.
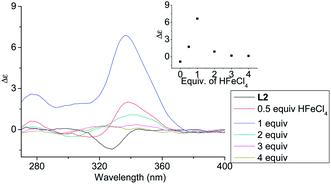 |
| | Fig. 3 CD spectrum of L2 (3 × 10⁻⁴ M) in CH2Cl2 with addition of HFeCl4 (0 to 4 equiv.). The inset shows the change in absorption at 334 nm. | |
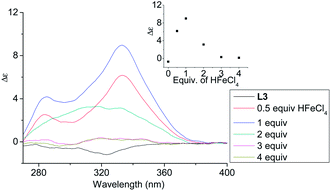 |
| | Fig. 4 CD spectrum of L3 in CH2Cl2 (3 × 10⁻⁴ M) with addition of HFeCl4 (0 to 4 equiv.). The inset shows the change in absorption at 333 nm. | |
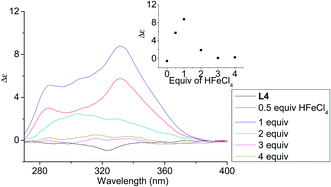 |
| | Fig. 5 CD spectrum of L4 in CH2Cl2 (3 × 10⁻⁴ M) with addition of HFeCl4 (0 to 4 equiv.). The inset shows the change in absorption at 332 nm. | |
Acid titration monitored by NMR
With the paramagnetic nature of HFeCl4, NMR informations were obtained by using HClO4. With L2–4, titration experiments were carried out under the same concentration as the CD experiments. Fig. 6 shows the results with L2. With addition of HClO4, there is an immediate upfield shift and broadening of the 1H NMR signals. The most upfield and broadened signals appear when 2 equiv. of HClO4 is added. Further addition of HClO4 leads to a downfield shift and sharpening of the signals. Sharpened signals with chemical shift similar to the unprotonated L2 is obtained when more acid is added. However, unlike CD titration where the concentration is limited, the NMR titration can be carried out at a much higher concentration. Fig. 7 shows the spectra when the experiment is carried out at 2 × 10⁻² M of L2, only 1 equiv. of HClO4 is needed to lead to the upfield signals. Fig. 8 and 9 are the spectra of titrations with L3 and L4 which also show similar change, but in both of this case only one equiv. of HClO4 is needed for reaching the most upfield signal at the CD experiments concentration. These results suggest that the upfield signals may come from the monoprotonation of the polyphenyl-bridged bis(2,2′-bipyridine) ligands. By considering that the induced CD signals and the upfield 1H signals occurred at the same time, we believe that they come from the same protonated species.
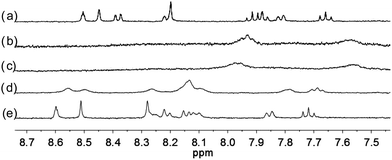 |
| | Fig. 6 1H NMR spectra (400 MHz) of (a) L2 (3 × 10⁻⁴ M) in CD2Cl2 with addition of (b) 1 equiv. (c) 2 equiv. (d) 3 equiv. (e) 4 equiv. of HClO4. | |
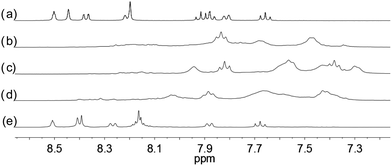 |
| | Fig. 7 1H NMR spectra for (a) L2 (2 × 10⁻² M) in CD2Cl2 with addition of (b) 0.5 equiv. (c) 1.0 equiv. (d) 1.5 equiv. (e) 2.0 equiv. of HClO4. | |
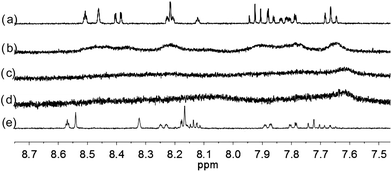 |
| | Fig. 8 1H NMR spectra for (a) L3 (3 × 10⁻⁴ M) in CD2Cl2 with addition of (b) 0.5 equiv. (c) 1 equiv. (d) 2 equiv. (e) 3 equiv. of HClO4. | |
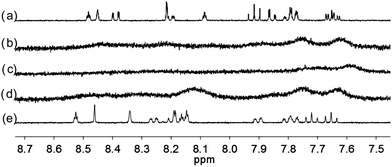 |
| | Fig. 9 1H NMR spectra for (a) L4 (3 × 10⁻⁴ M) in CD2Cl2 with addition of (b) 0.5 equiv. (c) 1 equiv. (d) 2 equiv. (e) 3 equiv. of HClO4. | |
1H NMR assignment
To have a better understanding of the species, 2D NMR was carried out. The NOESY spectrum of L2 is shown in Fig. 10. The correlation signals between the pyridine proton H5 and both protons at the 2- and 6-position of the bridging phenyl ring, H6 and H9, suggests that L2 interconverts between two conformations with H5 syn either to H6 or H9. Although broadened signals observed with addition of 1 equiv. of HClO4 cannot be assigned, the sharpened signals observed at 2 equiv. of HClO4 were fully assigned. The syn-conformation of the mono-protonated 2,2′-bipyridine is well established by both X-ray crystal structure and theoretical calculation.45,46 The correlation signal between H2 and H3 observed in the NOESY spectrum (Fig. 11) suggests that the pyridyl rings of both bipyridine units are in syn-conformation which is consistence with the mono-protonation of the bipyridine units. By considering that proton at the 2-position of the phenyl ring, H9, gives correlation signals to both protons at the 4-position of the phenyl ring, H8, and the 5′-position of the bipyridine, H5, a biprotonated species with a linear conformation is proposed. This biprotonated species comes from the further protonation of the species giving the upfield signals, which is consistent with the suggestion that the upfield signal is most likely a monoprotonated species of L2.
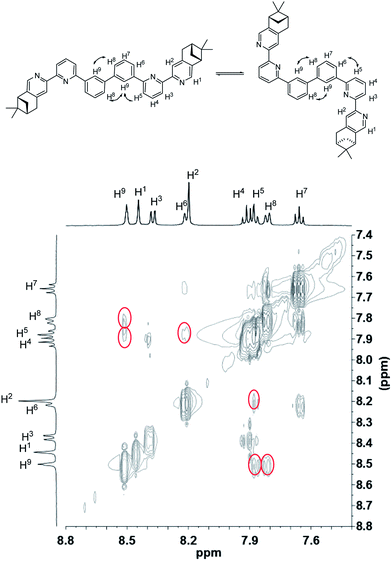 |
| | Fig. 10 NOESY spectrum (400 MHz) of L2 in CD2Cl2. | |
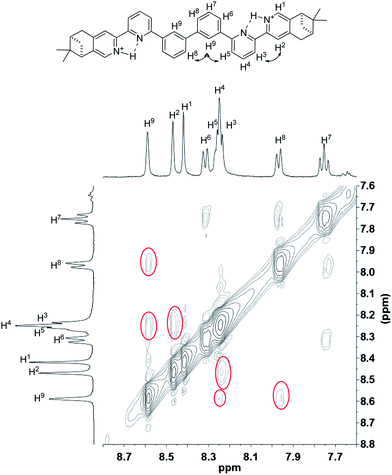 |
| | Fig. 11 NOESY spectrum (400 MHz) of L2 with addition of 2 equiv. of HClO4 in CD2Cl2. | |
Low temperature 1H NMR study
Apart from the upfield shift, broadening of signals of were also observed in NMR spectra of L2–4 when HClO4 was added. Variable temperature NMR experiments were then carried out to study the broadened signals. Fig. 12–14 shows the effect of the temperature on the 1H NMR signals. Fig. 12 shows that the broadened signals of L2 with 2 equiv. of HClO4 become even broader when the sample is cooled to 0 °C. Further decrease in temperature leads to sharpening and splitting of the signals into two sets with one set significantly upfield shifted while the other set shifted downfield to chemical shift similar to that of the free ligand. Fig. 13 shows the spectra obtained with L3 and 1 equiv. of HClO4. Similar signals splitting is observed, but it starts at higher temperature of 0 °C. The most sharpened signals are observed at −40 °C. Fig. 14 shows that signals of L4 with 1 equiv. HClO4 also split into in two sets at 0 °C. The line-shape of the signals does not change much when the temperature is below −30 °C. These results suggest that the broadening of signals observed with L2–4 and HClO4 come from the exchange between an upfielded and a downfielded species. The differences in temperature in giving the splitting and change in line-shape of the signals suggest that the exchange rates are different. Analysis of the linewidth of the signals at temperature below coalescence give the free energy of activation for the exchange process47,48 of 13.0, 13.4, and 14.0 kcal mol−1 for L2, L3 and L4, respectively. By considering that the signals broadening and the upfield shift of signals occur at the same time, we believe that the exchanges involve monoprotonated species of L2–4.
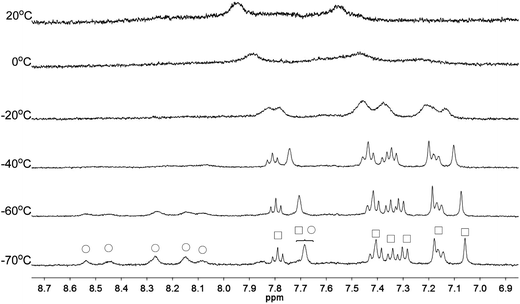 |
| | Fig. 12 1H NMR spectra for L2 (3 × 10⁻⁴ M) in CD2Cl2 with HClO4 (2 equiv.) at variable temperature. The species giving upfield and downfield signals are labelled □ and ○, respectively. | |
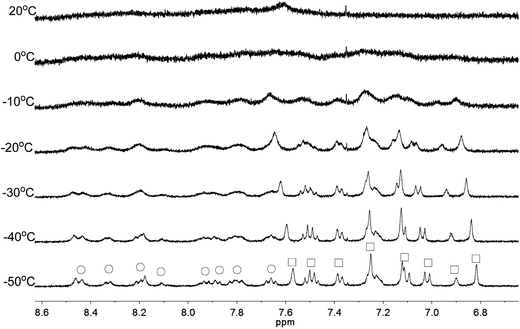 |
| | Fig. 13 1H NMR spectra for L3 (3 × 10⁻⁴ M) in CD2Cl2 with HClO4 (1 equiv.) at variable temperature. The species giving upfield and downfield signals are labelled □ and ○, respectively. | |
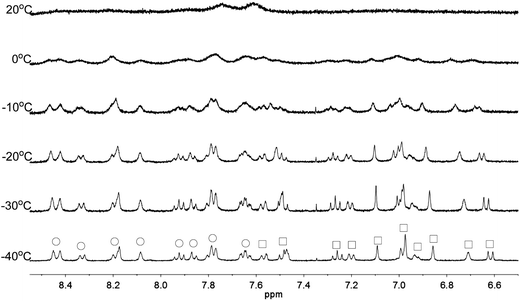 |
| | Fig. 14 1H NMR spectra for L4 (3 × 10⁻⁴ M) in CD2Cl2 with HClO4 (1 equiv.) at variable temperature. The species giving upfield and downfield signals are labelled □ and ○, respectively. | |
After the variable temperature experiments, the NMR solutions were then characterized by ESI-MS at room temperature (Fig. S1†). The spectra show similar results to that of HFeCl4 as both [(L)2H2](ClO4)+ and [(L)H]+ were observed. These monoprotonated species can be considered monomer and dimer. We believe that the broadening of signals may be due to the exchange between the dimer and its monomeric form, and the stacking between the strands of the dimeric species is the reason that leads to anisotropic effects of the aromatic rings and upfield signals.
X-ray characterization
Single crystals suitable for X-ray analysis were obtained for the nonprotonated state of L1, the biprotonated state of L4, and the dimeric form of the monoprotonated L2. Crystals of L1 were obtained by slowly evaporation of a diethyl ether solution. It is crystalized in a P212121 space group. Fig. 15 shows the ORTEP diagram. The pyridine rings adopt a transoid geometry and L1 is not coplanar. Twisting is observed between the aromatic rings with the torsional angles between the pyridyl rings being 2.8° and 19.1°, and between the phenyl and pyridyl rings being 22.7° and 24.8°. The ligand is not long enough to have a complete helical turn, and there is no stacking interaction.
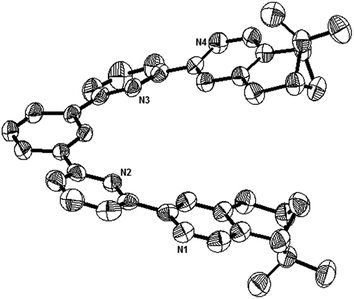 |
| | Fig. 15 The ORTEP plot of crystal structure of L1. Hydrogen atoms are removed for clarity. | |
Single crystals of the biprotonated L4 were obtained by ether diffusion into a methanol and chloroform solution of L4 and HFeCl4. The compound crystallized in a P1211 space group. Although the mixture was prepared using a one to one molar ratio of L4 and HFeCl4, the biprotonated species of L4 is a structure with a chloride and a tetrachloroferrate anions. The biprotonated L4 coils up around the chloride ion to give two helical structures, the P- and M-helices, which are coexist in the crystal lattice. The structures of P- and M-helices are shown in Fig. 16a–d. Beside the methyl groups of the P-form is pointing towards the chloride and the methyl groups of the M-form is pointing away from the chloride, the structures of the two helices are very similar. In both structures, the pyridyl rings adopt a cisoid geometry and point toward the chloride ion. The coiling of L4 comes from the twisting between the aromatic rings with most of it is contributed by the bridging phenyl rings. The dihedral angles between the phenyl rings are in the range 33.53–48.49°. The chloride anion has a close proximity with the terminal pyridine rings with N–H⋯Cl distances and angles in range 2.28–2.41 Å and 139.37–147.24°, respectively, which suggests the presence of hydrogen bonding. Although these species have helical structures, by considering that the anions are different, and the coexistence of the P- and M-form, these species are not related to the CD signals observed in the CD experiments. In addition, these biprotonated species shows that the tetraphenyl-bridged L4 is long enough to give a complete helical turn, and there are stacking interactions between the terminal pyridine rings, however, no upfield signals shift is observed while the biprotonated species is formed in the 1H NMR studies with HClO4. It is not likely that this helical form of biprotonated L4 is presented when only ClO4− anion is presented.
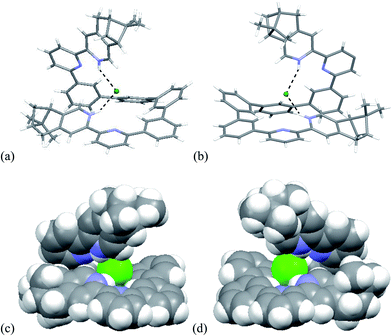 |
| | Fig. 16 Capped stick drawing of X-ray crystal structure of (a) P- and (b) M- [(L4)H2](Cl)(FeCl4). Dotted lines show hydrogen bonding with the chloride. The FeCl4− ion is not shown for clearance. (c) and (d) are the spacefilling model of P- and M-[(L4)H2](Cl)(FeCl4) respectively. | |
Single crystals of the monoprotonated L2 was obtained by ether diffusion into a solution of L2 in the presence of 1 equiv. of HFeCl4. It crystallizes in a monoclinic C2 space group and it is a dimeric form of formula, [(L2)2H2](FeCl4)2. The structure, shown in Fig. 17, has syn pyridine rings and the two protonated strands twist around each other resulting in the double-stranded helical structure with P-helical chirality (Flack parameter = 0.026(7)). The two molecules of L2 are held tightly together by intermolecular hydrogen bonding between the pyridinium proton of one strand and pyridine ring of the other strand. The N–H⋯N distances are 1.987 and 1.989 Å, and the angles N–H⋯N are 154.14 and 156.98°. The helix is also stabilized by π–π stacking interactions. There are extensive stacking interactions between the aromatic rings of the two molecules which start from the stacking of the pyridinium of one strand with the forth aromatic ring of the other, and extend along the whole ligand strand. Fig. 18 shows the crystal lattice of [(L2)2H2](FeCl4)2. There are FeCl4− anions surrounding the helix core. Some of the chloride atoms of the FeCl4− are close to the aromatic hydrogens of the helix, and their distances and angles are summarized in Table 1. The C–H⋯Cl distances and angles are in the range 2.713–3.125 Å and 124.83–171.65° respectively. These results suggest the presence of the C–H⋯Cl hydrogen bonding interactions between the helix and FeCl4− anions.49–51 Fig. 19 shows some of these interactions.
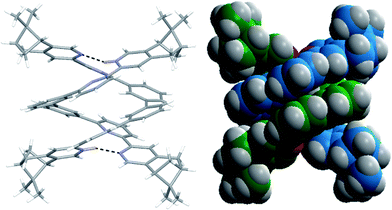 |
| | Fig. 17 (a) Capped stick drawing of X-ray crystal structure of [(L2)2H2](FeCl4)2. Dotted lines show hydrogen bonding within the double helix. (b) Spacefilling model of X-ray crystal structure of [(L2)2H2](FeCl4)2. | |
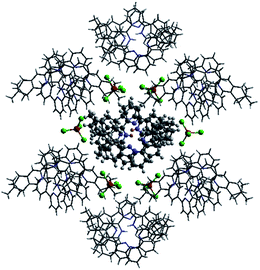 |
| | Fig. 18 Crystal structure of [(L2)2H2](FeCl4)2 showing crystal packing and location of FeCl4− anions surrounding the [(L2)2H2]2+ core. | |
Table 1 Hydrogen bonding parameters of [(L2)2H2]2+ and surrounding FeCl4− observed in X-ray crystal structure of [(L2)2H2](FeCl4)2
| D–H⋯A |
H⋯A/Å |
D–H⋯A/° |
| N1–H1⋯N5 |
1.987 |
156.14 |
| N8–H8⋯N4 |
1.989 |
154.98 |
| C–H77⋯Cl1 |
3.036 |
165.66 |
| C–H11⋯Cl2 |
2.713 |
162.04 |
| C–H14⋯Cl3 |
3.119 |
124.83 |
| C–H78⋯Cl5 |
2.906 |
139.35 |
| C–H79⋯Cl6 |
3.097 |
136.80 |
| C–H16⋯Cl7 |
3.057 |
132.81 |
| C–H71⋯Cl6 |
3.042 |
128.50 |
| C–H72⋯Cl6 |
3.090 |
126.66 |
| C–H67⋯Cl8 |
3.031 |
137.48 |
| C–H32⋯Cl1 |
2.880 |
162.13 |
| C–H62⋯Cl3 |
2.996 |
136.51 |
| C–H65⋯Cl4 |
2.747 |
128.67 |
| C–H27⋯Cl8 |
2.994 |
171.65 |
| C–H20⋯Cl4 |
3.125 |
152.81 |
| C–H21⋯Cl4 |
2.768 |
166.47 |
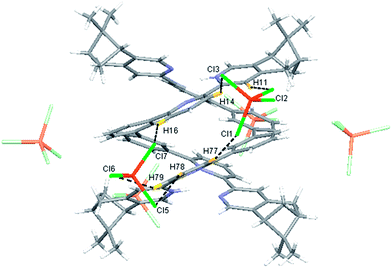 |
| | Fig. 19 Crystal structure of [(L2)2H2](FeCl4)2 showing crystal packing and location of FeCl4− anions surrounding [(L2)2H2]2+ core. Dotted lines shows some of the hydrogen bonding between FeCl4− and the helix. | |
Solution state structure by DFT calculation
From the crystal structure of [(L2)2H2](FeCl4)2, we believe that a double-stranded helix is formed in solution when L2 is monoprotonated in the presence of FeCl4− or ClO4−, and the formation of the double helix is the origin the spectro-change observed in CD and NMR. The P-helical chirality of the [(L2)2H2](FeCl4)2 is consistent with the first positive CD signals observed in the CD spectra52 which is similar to the spectra of the rigid Mn double-stranded helicates of L2 and L3.35 The extensive π–π stacking of the aromatic rings of the strands of the double-stranded helical structure which lead to anisotropic effect also agree well with the upfield signals observed in the NMR spectra. Considering the observation and results obtained with L2, L3 and L4 in the experiments, we believe that the monoprotonated form of triphenyl-bridged L3 and tetraphenyl-bridged L4 also form double-stranded helical structure. To show that this is the case and to have a better understanding to the helices in solution, DFT calculations were carried out on the monoprotonated species of L2, L3 and L4 using both the FeCl4− and ClO4− anions.
Models of [(L)2H2](FeCl4)2 and [(L)2H2](ClO4)2 (L = L2–4) were first constructed, then their formation were investigated using theoretical DFT calculation at M06-2X level, with solvent effect taken account by the Polarizable Continuum Model. Fig. 20 shows the calculation with the biphenyl-bridged L2. The calculation starts from protonation of L2 and formation of the double-stranded helical core [(L2)2H2]2+. The formation of the helical core stabilizes the system by 164.4 and 107.8 kcal mol−1, respectively, with HFeCl4 and HClO4. The energy different is the sum of dissociation of the HFeCl4, protonation of L2, the stacking between the ligands and the pyridinium pyridine hydrogen bondings. Interactions between [(L2)2H2]2+ with FeCl4− and ClO4− anion further stabilize the system by 30.1 and 26.1 kcal mol−1, respectively, which give [(L2)2H2](FeCl4)2 and [(L2)2H2](ClO4)2 with an overall stabilization 194.1 and 133.9 kcal mol−1, respectively.
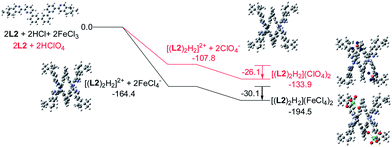 |
| | Fig. 20 Energy profile of the formation of [(L2)2H2](X)2 (X = ClO4− or FeCl4−) obtained by calculation at M06-2X/6-31G(d)/LANL2DZ with solvent effect. The red line indicates the formation of [(L2)2H2](ClO4)2 and black line indicates the formation of [(L2)2H2](FeCl4)2. The relative energy is given in kcal mol−1. | |
Similar calculations were carried out using L3 and L4 and the results are shown in Fig. 21 and 22. The results suggest that the formation of the double-stranded helices with L3 and L4 are also feasible, and also give additional information to the difference between these systems. In the presence of HFeCl4, the formation of the double-stranded helical core [(L)2H2]2+ with L4 being the most stable (−173.4 kcal mol−1), which is followed by L3 (−172.1 kcal mol−1), and then followed by L2 (−164.4 kcal mol−1). The same trend also occurs with HClO4. These trends seem most likely due to the increase in the number of the bridging phenyl-rings of the ligands which increase the stacking interactions. Interactions between [(L)2H2]2+ and FeCl4− are in range −30.1 to −31.7 kcal mol−1. With ClO4−, the interactions are in the range −25.3 to −28.3 kcal mol−1. The FeCl4− anion seems to have better stabilization than ClO4−. With the same anion, the differences in energy among L2–4 suggest that the helices interact differently with different anions. The energy of −133.9 kcal mol−1 for [(L2)2H2](ClO4)2 is less stable than other helices which agrees quite well with the observations in the CD experiments.
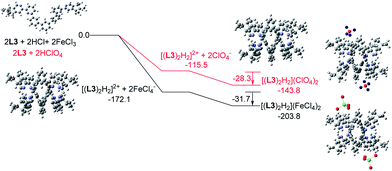 |
| | Fig. 21 Energy profile of the formation of [(L3)2H2](X)2 (X = ClO4− or FeCl4−) obtained by calculation at M06-2X/6-31G(d)/LANL2DZ with solvent effect. The red line indicates the formation of [(L3)2H2](ClO4)2 and black line indicates the formation of [(L3)2H2](FeCl4)2. The relative energy is given in kcal mol−1. | |
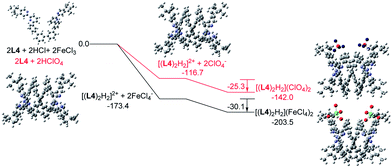 |
| | Fig. 22 Energy profile of the formation of [(L4)2H2](X)2 (X = ClO4− or FeCl4−) obtained by calculation at M06-2X/6-31G(d)/LANL2DZ with solvent effect. The red line indicates the formation of [(L4)2H2](ClO4)2 and black line indicates the formation of [(L4)2H2](FeCl4)2. The relative energy is given in kcal mol−1. | |
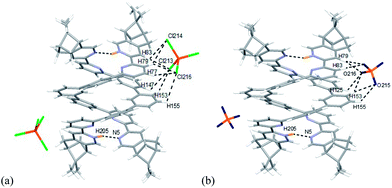
The models of [(L)2H2](FeCl4)2 and [(L)2H2](ClO4)2 (L = L2–4) are shown in Fig. 23–25. Fig. 23a shows the model of [(L2)2H2](FeCl4)2. The optimized geometry is in satisfactory agreement with its crystal structure, and the X-ray and calculated data are summarized in Table 2. Beside the pyridinium N+H and pyridine hydrogen bonding, there are C–H⋯Cl type hydrogen bonding interactions between the [(L2)2H2]2+ core and the two FeCl4− anions very much similar to that observed in the X-ray structure. The bond distances and angles are summarized in Table S1.† The presence of C–H⋯Cl hydrogen bondings are also confirmed by Atom in Molecules (AIM) analysis, and the results are shown in Table S2.† The FeCl4− anions use three out of the four chloride atoms to hold the double-stranded helical structure by forming multi-centered hydrogen bonding to the protons on the first and the second aromatic rings of one strands, and the protons on the forth and firth aromatic rings of the other. The model of [(L2)2H2](ClO4)2 is shown in Fig. 21b. There are C–H⋯O type hydrogen bonding interactions. The smaller ClO4− anions use three out of the four its oxygen atoms to form hydrogen bondings to the same aromatic protons on the backbone of both strands as FeCl4− but with slightly different orientation. The data are summarized in Tables S3 and S4.†
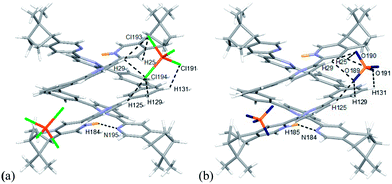 |
| | Fig. 23 Minimized energy model of (a) [(L2)2H2](FeCl4)2, and (b) [(L2)2H2](ClO4)2 obtained from theoretical calculation at M06-2X/6-31G(d)/LANL2DZ. Hydrogen bonding interactions are shown with dotted lines on only one of the anions for clearance. | |
 |
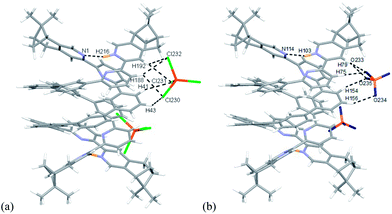
| | Fig. 24 Minimized energy model of (a) [(L3)2H2](FeCl4)2, and (b) [(L3)2H2](ClO4)2 obtained from theoretical calculation at M06-2X/6-31G(d)/LANL2DZ. Hydrogen bonding interactions are shown with dotted lines on only one of the anions for clearance. | |
 |
| | Fig. 25 Minimized energy model of (a) [(L4)2H2](FeCl4)2, and (b) [(L4)2H2](ClO4)2 obtained from theoretical calculation at M06-2X/6-31G(d)/LANL2DZ. Hydrogen bonding interactions are shown with dotted lines on only one of the anions for clearance. | |
Table 2 A summary of the selected bond lengths and angles of X-ray and calculated data of [(L2)2H2](FeCl4)2
| X-ray structure of [(L2)2H2](FeCl4)2 |
Model of [(L2)2H2](FeCl4)2 |
| Atoms |
Bond lengths or angles |
Atoms |
Bond lengths or angles |
| N1–H1⋯N5 |
1.987 Å |
N89–H195⋯N194 |
1.890 Å |
| N1–H1⋯N5 |
156.14° |
N89–H195⋯N194 |
157.00° |
| N8–H8⋯N4 |
1.989 Å |
N181–H196⋯N92 |
1.894 Å |
| N8–H8⋯N4 |
154.98° |
N181–H196⋯N92 |
156.48° |
| N1–C12–C13–N2 |
17.58° |
N89–C26–C27–N90 |
23.83° |
| N2–C17–C18–C23 |
20.49° |
N90–C34–C35–C43 |
12.87° |
| C23–C22–C24–C29 |
32.74° |
C43–C42–C45–C53 |
29.67° |
| C29–C28–C30–N3 |
24.58° |
C53–C52–C55–N91 |
20.82° |
| N3–C34–C35–N4 |
21.82° |
N91–C62–C63–N92 |
21.30° |
| N5–C58–C59–N6 |
24.04° |
N181–C116–C119–N182 |
23.85° |
| N6–C63–C64–C69 |
22.81° |
N182–C126–C127–C135 |
11.47° |
| C69–C68–C70–C75 |
34.24° |
C135–C134–C137–C145 |
30.08° |
| C75–C74–C76–N7 |
13.29° |
C145–C144–C147–N183 |
21.48° |
| N7–C80–C81–N8 |
20.35° |
N183–C154–C155–N184 |
20.64° |
Models with L3 are shown in Fig. 22a and b. The stacking between the aromatic rings observed in [(L3)2H2]2+ are different from [(L2)2H2]2+. In the case of [(L2)2H2]2+, the pyridinium of one strand stacks with the forth aromatic ring of the other, but the pyridinium stacks with the third aromatic ring in case of [(L3)2H2]2+. Exterior hydrogen bindings between the helices and the anions are also observed. Data are summarized in Table S5–8.† Some differences are observed when comparing to L2. For L3, the FeCl4− forms hydrogen bonds to the protons on the first and the second aromatic rings of one strands, but to the protons on the third and the forth aromatic rings of the other. In the presence of ClO4−, it forms hydrogen bonds to the same aromatic rings as FeCl4− but with slightly different protons.
Models with L4 are shown in Fig. 23a and b. The stacking observed in the helix of L4 is different from L2 and L3. The pyridinium of one strand stacks with the second aromatic ring of the other. The close proximity of the anions with the aromatic protons again suggest the presents of hydrogen bondings. The data are summarized in Table S9–11.† However, due to the size of the model of [(L4)2H2](FeCl4)2 excess the limit of the software, AIM analysis was only carried out on [(L4)2H2](ClO4)2. The FeCl4− forms hydrogen bonds to the protons on the first and the second aromatic rings of one strand, but to the protons on the third aromatic rings of the other, which is different from helix of L2 and L3. The ClO4− also form hydrogen bonds to the same aromatic protons. Although the C–H⋯O and C–H⋯Cl hydrogen bonding are generally considered as weak hydrogen bonding,49 the calculation results show that the sum of the interactions from the two anions are not weak (in range −30.1 to −31.7 kcal mol−1 for FeCl4−, and −25.3 to −28.3 kcal mol−1 for ClO4−), and is comparable to a strong hydrogen bond.53 As shown in Scheme 2, we believe that the formation of the double-stranded helix is a delicate combination of the two types of hydrogen bonding, the interior hydrogen bonding between pyridinium and pyridine, and the exterior hydrogen bonding between the core and anions.
 |
| | Scheme 2 Formation of hydrogen-bonded double-stranded helix [(L2)2H2](ClO4)2 with ClO4− anions represented by  . . | |
Reversibility of the formation of the hydrogen-bonded double helix
Since reversible interconversion between multistable states of a molecule in response to protonation is of interest,54–56 we tried to see if L2–4 can be developed into reversible interconverting systems with CD signal change by sequential addition of acid and base. With HFeCl4 and NEt3 as base, excess NEt3 (5 equiv.) is needed to turn off the CD signal, but addition of the HFeCl4 cannot fully restore the original CD signal suggesting that the process is not reversible with HFeCl4. However, with HClO4, the results were quite different. Fig. 26a shows the results of reaction of L2 with HClO4 and NEt3. When HClO4 is used, addition of NEt3 turns the signal “off”. Addition of another equiv. of HClO4 turns the signal “on” again restoring the CD signal. This cycle can be repeated without the decrease in signal's intensity for at least four to five cycles. This on and off CD signal switching properties can be demonstrated by using L3 and L4 (Fig. 26b and c). The results suggest that these systems have potential to be developed as chiroptical switches.
 |
| | Fig. 26 CD absorption at 334 nm of (a) L2, (b) L3, and (c) L4, with alternate addition of HClO4 and NEt3. | |
Conclusion
We have presented the synthesis of a series of chiral polyphenyl-bridged bis(2,2′-bipyridine) ligands. Protonation of the ligands give intense CD signals. The protonation processes were studied in detail by both CD and 1H NMR. The results suggest that the CD signals come from monoprotonated species. X-ray crystal structures of free ligand and protonated ligands were obtained. The structure of the monoprotonated ligand shows that it is a double-stranded helix that is stabilized by a delicate combination of interior hydrogen bonds between the ligand strands and exterior hydrogen bonds between the helical core and anions. Theoretical DFT calculations on the formation of hydrogen-bonded double helices with the series of ligands were carried out. We believe that hydrogen-bonded double helices are formed upon monoprotonation of the ligands and they are stabile in solution as well. With perchlorate anion, the system can be interconverted between non-helical and helical states by addition and removal of proton, making it an on/off chiroptical switch. Further investigation of these properties for other applications line is now in progress.
Acknowledgements
The work described in this paper was supported by grants from the University Grants Committee of Hong Kong Special Adminstrative Region, China (Project no. [AoE/P-03/08] and CityU 7004018).
References
- W. Saenger, Principles of Nucleic Acid Structure, Springer-Verlag, New York, 1999 Search PubMed.
- J.-M. Lehn, Supramolecular Chemistry: Concepts and Perspectives, VCH, Weinheims, 1995, section 9.3 Search PubMed.
- J. W. Steed and J. L. Atwood, S. Chemistry, J. Wiley and S. Ltd, Chichester, 2000, ch. 7.7 Search PubMed.
- S. Howson and P. Scott, Dalton Trans., 2011, 40, 10268 RSC.
- C. Piguet, M. Borkovec, J. Hamacek and K. Zeckert, Coord. Chem. Rev., 2005, 249, 705 CrossRef CAS PubMed.
- M. J. Hannon and L. J. Childs, Supramol. Chem., 2004, 16, 7 CrossRef CAS.
- M. Albrecht, Chem. Rev., 2001, 101, 3457 CrossRef CAS PubMed.
- C. Piguet, G. Bernardinlli and G. Hopfgartner, Chem. Rev., 1997, 97, 2005 CrossRef CAS PubMed.
- H. Ito, Y. Furusho, T. Hasegawa and E. Yashima, J. Am. Chem. Soc., 2008, 130, 14008 CrossRef CAS PubMed.
- Y. Tanaka, H. Katagiri, Y. Furusho and E. Yashima, Angew. Chem., Int. Ed., 2005, 44, 3867 CrossRef CAS PubMed.
- A. Stephenson and M. D. Ward, RSC Adv., 2012, 2, 10844 RSC.
- A. Stephenson and M. D. Ward, Chem. Commun., 2012, 48, 3605 RSC.
- V. Vreshch, M. E. S. Moussa, B. Nohra, M. Srebro, N. Vanthuyne, C. Roussel, J. Autschbach, J. Crassous, C. Lescop and R. Réau, Angew. Chem., Int. Ed., 2013, 52, 1968 CrossRef CAS PubMed.
- V. E. Campbell, X. de Hatten, N. Delsuc, B. Kauffman, I. Huc and J. R. Nitschke, Chem.–Eur. J., 2009, 15, 6138 CrossRef CAS PubMed.
- A. R. Stefankiewicz, M. Walesa, P. Jankowski, A. Ciesielski, V. Patroniak, M. Kubicki, Z. Hnatejko, J. M. Harrowfield and J.-M. Lehn, Eur. J. Inorg. Chem., 2008, 2910 CrossRef CAS PubMed.
- E. C. Constable, M. J. Hannon, A. Martin and P. R. Raithby, Polyhedron, 1992, 11, 2967 CrossRef CAS.
- R. Amemiya and M. Yamaguchi, Chem. Rec., 2008, 8, 116 CrossRef CAS PubMed.
- D. Haldar, H. Jiang, J.-M. Léger and I. Huc, Angew. Chem., Int. Ed., 2006, 45, 5483 CrossRef CAS PubMed.
- D. Haldar, H. Jiang, J.-M. Léger and I. Huc, Tetrahedron, 2007, 63, 6322 CrossRef CAS PubMed.
- D. Haldar and C. Schmuck, Chem. Soc. Rev., 2009, 38, 363 RSC.
- H.-B. Wang, B. P. Mudraboyina and J. A. Wisner, Chem.–Eur. J., 2012, 18, 1322 CrossRef CAS PubMed.
- H. Yamada, K. Maeda and E. Yashima, Chem.–Eur. J., 2009, 15, 6794 CrossRef CAS PubMed.
- H. Jiang, V. Maurizot and I. Huc, Tetrahedron, 2004, 60, 10029 CrossRef CAS PubMed.
- V. Berl, I. Huc, R. G. Khoury, M. J. Krische and J.-M. Lehn, Nature, 2000, 407, 720 CrossRef CAS PubMed.
- S. Mangani and M. Ferraroni, Natural Anion Receptors: Anion Recognition by Protein. in Supramolecular Chemistry of Anions, ed. A. Bianchi, K. Bowman-James and E. García-España, Wiley-VCH, New York, 1997 Search PubMed.
- Comprehensive Coordination Chemistry II, ed. J. A. McCleverty and T. J. Meyer, Elsevier, Oxford, 2004, vol. 9 Search PubMed.
- M. S. Vivkers and P. D. Beer, Chem. Soc. Rev., 2007, 36, 211 RSC.
- R. Vilar, Angew. Chem., Int. Ed., 2003, 42, 1460 CrossRef CAS PubMed.
- Y. Haketa and H. Maeda, Chem.–Eur. J., 2011, 17, 1485 CrossRef CAS PubMed.
- S. J. Coles, J. G. Frey, P. A. Gale, M. B. hursthouse, M. E. Light, K. Navakhun and G. L. Thomas, Chem. Commun., 2003, 568 RSC.
- J. Keegan, P. E. Kruger, M. Nieuwenhuyzen, J. O'Brien and N. Martin, Chem. Commun., 2001, 2192 RSC.
- J. Sánchez-Quesada, C. Seel, P. Prados and J. de Mendoza, J. Am. Chem. Soc., 1996, 118, 277 CrossRef.
- C. Dolain, V. Maurizot and I. Huc, Angew. Chem., Int. Ed., 2003, 42, 2738 CrossRef CAS PubMed.
- J. Cho, M. Tanaka, S. Sato, K. Kinbara and T. Aida, J. Am. Chem. Soc., 2010, 132, 13176 CrossRef CAS PubMed.
- K.-C. Sham, H.-L. Yeung, S.-M. Yiu, T.-C. Lau and H.-L. Kwong, Dalton Trans., 2010, 39, 9469 RSC.
- H.-L. Yeung, W.-Y. Wong, C.-Y. Wong and H.-L. Kwong, Inorg. Chem., 2009, 48, 4108 CrossRef CAS PubMed.
- Y. Zhao and D. G. Truhlar, Theor. Chem. Acc., 2008, 120, 215 CrossRef CAS.
- P. J. Hay and W. R. Wadt, J. Chem. Phys., 1985, 82, 270 CrossRef CAS PubMed.
- P. J. Hay and W. R. Wadt, J. Chem. Phys., 1985, 82, 284 CrossRef PubMed.
- P. J. Hay and W. R. Wadt, J. Chem. Phys., 1985, 82, 299 CrossRef CAS PubMed.
- S. Miertuš, E. Scrocco and J. Tomasi, Chem. Phys., 1981, 55, 117 CrossRef.
- S. Miertuš and J. Tomasi, Chem. Phys., 1982, 65, 239 CrossRef.
- F. Biegler-König, AIM2000, University of Applied Sciences, Bielefeld, Germany Search PubMed.
- HFeCl4 was prepared in situ from HCl and FeCl3.
- S. T. Howard, J. Am. Chem. Soc., 1996, 118, 10269 CrossRef CAS.
- S. J. Kavitha, K. Panchanaheswaran, J. N. Low and C. Glidewell, Acta Crystallogr., 2005, C61, o473 CAS.
- J. Sandström, Dynamic NMR Spectroscopy; Academic Press, London, 1982, ch. 6 Search PubMed.
- R. L. Paul, S. P. Argent, J. C. Jeffery, L. P. Hardling, J. M. Lynam and M. D. Ward, Dalton Trans., 2004, 3453 RSC.
- T. Steiner, Angew. Chem., Int. Ed, 2002, 41, 48 CrossRef CAS.
- L. Brammer, E. A. Bruton and P. Sherwood, Cryst. Growth Des., 2001, 1, 277 CAS.
- C. B. Aakeröy, T. A. Evans, K. R. Seddon and I. Pálinkó, New J. Chem., 1999, 145 RSC.
- M. Zieglar and A. von Zelewsky, Coord. Chem. Rev., 1998, 257 CrossRef.
- G. A. Jeffery, An introduction to Hydrogen Bonding, Oxford University Press, Oxford, 1997 Search PubMed.
- S. M. Landge and I. Aprahamian, J. Am. Chem. Soc., 2009, 131, 18269 CrossRef CAS PubMed.
- I. Okamoto, M. Nabeta, Y. Hayakawa, N. Morita, T. Takeya, H. Masu, I. Azumaya and O. Tamura, J. Am. Chem. Soc., 2007, 129, 1892 CrossRef CAS PubMed.
- J. D. Badjić, V. Balzani, A. Credi, S. Silvi and J. F. Stoddart, Science, 2004, 303, 1845 CrossRef PubMed.
Footnote |
| † Electronic supplementary information (ESI) available. CCDC 983706–983708. For ESI and crystallographic data in CIF or other electronic format see DOI: 10.1039/c4ra00849a |
|
| This journal is © The Royal Society of Chemistry 2014 |
Click here to see how this site uses Cookies. View our privacy policy here. ![[thin space (1/6-em)]](https://www.rsc.org/images/entities/char_2009.gif) :
:![[thin space (1/6-em)]](https://www.rsc.org/images/entities/char_2009.gif) ethyl acetate = 10
ethyl acetate = 10![[thin space (1/6-em)]](https://www.rsc.org/images/entities/char_2009.gif) :
:![[thin space (1/6-em)]](https://www.rsc.org/images/entities/char_2009.gif) 1). Products were isolated as white solid in 95% and 83% yield for 2 and 3, respectively. 1H NMR of 2 (300 MHz, CDCl3) δ 8.94 (d, J = 7.8 Hz, 1H), 8.60 (s, 1H), 8.49 (s, 1H), 8.05 (m, 2H), 7.95 (m, 1H), 7.85 (d, J = 8 Hz, 1H), 7.42 (m, 2H), 3.29 (d, J = 2.4 Hz, 2H), 3.02 (t, J = 5.4 Hz, 1H), 2.8 (m, 1H), 2.41 (s, 1H), 1.43 (s, 3H), 1.23 (d, J = 10.3 Hz, 1H), 0.64 (s, 3H). 1H NMR of 3 (300 MHz, CD2Cl2): δ 8.37 (s, 1H), 8.35 (d, 1H, J = 8.1 Hz), 8.31 (t, 1H, J = 1.8 Hz), 8.22 (s, 1H), 8.02 (d, 1H, J = 7.8 Hz), 7.85 (t, 1H, J = 7.8 Hz), 7.67 (d, 1H, 6.9 Hz), 7.55 (d, 1H, J = 7.8 Hz), 7.36 (t, 1H, J = 7.8 Hz), 3.10 (d, 1H, J = 2.7 Hz), 2.88 (t, 1H, J = 5.4 Hz), 2.70 (m, 1H), 2.33 (m, 1H), 1.42 (s, 3H), 1.21 (d, 1H, J = 6.9 Hz), 0.67 (s, 3H).
1). Products were isolated as white solid in 95% and 83% yield for 2 and 3, respectively. 1H NMR of 2 (300 MHz, CDCl3) δ 8.94 (d, J = 7.8 Hz, 1H), 8.60 (s, 1H), 8.49 (s, 1H), 8.05 (m, 2H), 7.95 (m, 1H), 7.85 (d, J = 8 Hz, 1H), 7.42 (m, 2H), 3.29 (d, J = 2.4 Hz, 2H), 3.02 (t, J = 5.4 Hz, 1H), 2.8 (m, 1H), 2.41 (s, 1H), 1.43 (s, 3H), 1.23 (d, J = 10.3 Hz, 1H), 0.64 (s, 3H). 1H NMR of 3 (300 MHz, CD2Cl2): δ 8.37 (s, 1H), 8.35 (d, 1H, J = 8.1 Hz), 8.31 (t, 1H, J = 1.8 Hz), 8.22 (s, 1H), 8.02 (d, 1H, J = 7.8 Hz), 7.85 (t, 1H, J = 7.8 Hz), 7.67 (d, 1H, 6.9 Hz), 7.55 (d, 1H, J = 7.8 Hz), 7.36 (t, 1H, J = 7.8 Hz), 3.10 (d, 1H, J = 2.7 Hz), 2.88 (t, 1H, J = 5.4 Hz), 2.70 (m, 1H), 2.33 (m, 1H), 1.42 (s, 3H), 1.21 (d, 1H, J = 6.9 Hz), 0.67 (s, 3H).
![[thin space (1/6-em)]](https://www.rsc.org/images/entities/char_2009.gif) :
:![[thin space (1/6-em)]](https://www.rsc.org/images/entities/char_2009.gif) ethyl acetate = 10
ethyl acetate = 10![[thin space (1/6-em)]](https://www.rsc.org/images/entities/char_2009.gif) :
:![[thin space (1/6-em)]](https://www.rsc.org/images/entities/char_2009.gif) 1). Products were isolated as white solid with 93% yield. 1H NMR (400 MHz, CDCl3) δ 8.56 (d, J = 7.8 Hz, 1H), 8.49 (s, 1H), 8.33 (s, 1H), 8.29 (t, J = 1.5 Hz, 1H), 8.16 (d, J = 7.3 Hz, 1H), 7.98 (t, J = 7.8 Hz, 1H), 7.85 (d, J = 7.2 Hz, 1H), 7.70 (t, J = 1.7 Hz, 1H), 7.66 (d, J = 7.7 Hz, 1H), 7.63 (d, J = 7.6 Hz, 1H), 7.59 (d, J = 7.6 Hz, 1H), 7.43 (t, J = 7.7 Hz, 1H), 7.38 (d, J = 8.0 Hz, 1H), 3.18 (d, J = 2.5 Hz, 2H), 2.96 (t, J = 5.4 Hz, 1H), 2.8 (m, 1H), 2.4 (m, 1H), 1.46 (s, 3H), 1.27 (t, J = 8.2 Hz, 1H), 0.69 (s, 3H).
1). Products were isolated as white solid with 93% yield. 1H NMR (400 MHz, CDCl3) δ 8.56 (d, J = 7.8 Hz, 1H), 8.49 (s, 1H), 8.33 (s, 1H), 8.29 (t, J = 1.5 Hz, 1H), 8.16 (d, J = 7.3 Hz, 1H), 7.98 (t, J = 7.8 Hz, 1H), 7.85 (d, J = 7.2 Hz, 1H), 7.70 (t, J = 1.7 Hz, 1H), 7.66 (d, J = 7.7 Hz, 1H), 7.63 (d, J = 7.6 Hz, 1H), 7.59 (d, J = 7.6 Hz, 1H), 7.43 (t, J = 7.7 Hz, 1H), 7.38 (d, J = 8.0 Hz, 1H), 3.18 (d, J = 2.5 Hz, 2H), 2.96 (t, J = 5.4 Hz, 1H), 2.8 (m, 1H), 2.4 (m, 1H), 1.46 (s, 3H), 1.27 (t, J = 8.2 Hz, 1H), 0.69 (s, 3H).
![[thin space (1/6-em)]](https://www.rsc.org/images/entities/char_2009.gif) :
:![[thin space (1/6-em)]](https://www.rsc.org/images/entities/char_2009.gif) diethyl ether = 10
diethyl ether = 10![[thin space (1/6-em)]](https://www.rsc.org/images/entities/char_2009.gif) :
:![[thin space (1/6-em)]](https://www.rsc.org/images/entities/char_2009.gif) 1). The crude yellow solution can be further purified by washing with MeCN. Products were isolated as pale yellow solid with 57% and 30% yield for L1 and L2, respectively. 1H NMR of L1 (400 MHz, CDCl3): δ 8.81 (t, 1H, J = 1.6 Hz), 8.85 (s, 2H), 8.38 (d, 2H, J = 6.7 Hz), 8.27 (d, 2H, J = 7.8 Hz), 8.25 (s, 2H), 7.93 (t, 2H, J = 7.7 Hz), 7.87 (d, 2H, J = 6.8 Hz), 7.69 (t, 1H, J = 7.7 Hz) 3.11 (d, 4H, J = 2.6 Hz), 2.90 (t, 2H, J = 5.4 Hz), 2.73 (m, 2H), 2.34 (m, 2H), 1.44 (s, 6H), 1.27 (d, 2H, J = 9.6 Hz), 0.69 (s, 6H). 13C NMR (CDCl3): δ 156.65, 156.61, 154.86, 145.68, 145.57, 143.30, 140.30, 140.36, 137.86, 129.38, 127.93, 125.80, 120.90, 120.42, 119.50, 44.82, 40.38, 39.54, 33.30, 32.08, 26.28, 21.66. 1H NMR of L3 (300 MHz, CDCl3): δ 8.43 (m, 4H), 8.36 (d, 2H, J = 6 Hz), 8.22 (s, 2H), 8.16 (d, 2H, J = 6 Hz), 8.05 (t, 1H, J = 1.8 Hz), 7.90 (t, 2H, J = 7.8 Hz), 7.81 (d, 2H, J = 7.8 Hz), 7.75 (t, 4H, J = 7.5 Hz), 7.63 (t, 3H, J = 7.5 Hz), 3.05 (d, 4H, J = 2.7 Hz), 2.88 (t, 2H, J = 5.4 Hz), 2.70 (m, 2H), 2.30 (m, 2H), 1.41 (s, 6H), 1.21 (d, 2H, J = 6.9 Hz), 0.65 (s, 6H). 13C NMR (CDCl3): δ 156.62, 156.54, 154.75, 145.65, 145.58, 143.31, 142.15, 141.91, 140.53, 137.87, 129.52, 129.43, 128.09, 126.67, 126.44, 126.26, 120.88, 120.35, 119.48, 44.80, 40.37, 39.49, 33.23, 32.06, 26.25, 21.63.
1). The crude yellow solution can be further purified by washing with MeCN. Products were isolated as pale yellow solid with 57% and 30% yield for L1 and L2, respectively. 1H NMR of L1 (400 MHz, CDCl3): δ 8.81 (t, 1H, J = 1.6 Hz), 8.85 (s, 2H), 8.38 (d, 2H, J = 6.7 Hz), 8.27 (d, 2H, J = 7.8 Hz), 8.25 (s, 2H), 7.93 (t, 2H, J = 7.7 Hz), 7.87 (d, 2H, J = 6.8 Hz), 7.69 (t, 1H, J = 7.7 Hz) 3.11 (d, 4H, J = 2.6 Hz), 2.90 (t, 2H, J = 5.4 Hz), 2.73 (m, 2H), 2.34 (m, 2H), 1.44 (s, 6H), 1.27 (d, 2H, J = 9.6 Hz), 0.69 (s, 6H). 13C NMR (CDCl3): δ 156.65, 156.61, 154.86, 145.68, 145.57, 143.30, 140.30, 140.36, 137.86, 129.38, 127.93, 125.80, 120.90, 120.42, 119.50, 44.82, 40.38, 39.54, 33.30, 32.08, 26.28, 21.66. 1H NMR of L3 (300 MHz, CDCl3): δ 8.43 (m, 4H), 8.36 (d, 2H, J = 6 Hz), 8.22 (s, 2H), 8.16 (d, 2H, J = 6 Hz), 8.05 (t, 1H, J = 1.8 Hz), 7.90 (t, 2H, J = 7.8 Hz), 7.81 (d, 2H, J = 7.8 Hz), 7.75 (t, 4H, J = 7.5 Hz), 7.63 (t, 3H, J = 7.5 Hz), 3.05 (d, 4H, J = 2.7 Hz), 2.88 (t, 2H, J = 5.4 Hz), 2.70 (m, 2H), 2.30 (m, 2H), 1.41 (s, 6H), 1.21 (d, 2H, J = 6.9 Hz), 0.65 (s, 6H). 13C NMR (CDCl3): δ 156.62, 156.54, 154.75, 145.65, 145.58, 143.31, 142.15, 141.91, 140.53, 137.87, 129.52, 129.43, 128.09, 126.67, 126.44, 126.26, 120.88, 120.35, 119.48, 44.80, 40.37, 39.49, 33.23, 32.06, 26.25, 21.63.
![[thin space (1/6-em)]](https://www.rsc.org/images/entities/char_2009.gif) :
:![[thin space (1/6-em)]](https://www.rsc.org/images/entities/char_2009.gif) n-hexane
n-hexane![[thin space (1/6-em)]](https://www.rsc.org/images/entities/char_2009.gif) :
:![[thin space (1/6-em)]](https://www.rsc.org/images/entities/char_2009.gif) diethyl ether = 30
diethyl ether = 30![[thin space (1/6-em)]](https://www.rsc.org/images/entities/char_2009.gif) :
:![[thin space (1/6-em)]](https://www.rsc.org/images/entities/char_2009.gif) 6
6![[thin space (1/6-em)]](https://www.rsc.org/images/entities/char_2009.gif) :
:![[thin space (1/6-em)]](https://www.rsc.org/images/entities/char_2009.gif) 1). Product was isolated as a pale brown solid in 26% yield. 1H NMR (400 MHz, CDCl3) δ 8.42 (d, J = 2.8 Hz, 1H), 8.37 (d, J = 7.6 Hz, 1H), 8.22 (s, 1H), 8.16 (d, J = 7.3 Hz, 1H), 8.02 (s, 1H), 7.90 (t, J = 7.8 Hz, 1H), 7.80 (d, J = 7.7 Hz, 1H), 7.74 (t, J = 7.2 Hz, 2H), 7.62 (d, J = 13.8, 7.6 Hz), 3.06 (d, J = 2.3 Hz, 1H), 2.89 (t, J = 5.4 Hz, 1H), 2.7 (m, 1H), 2.32 (s, 1H), 1.43 (s, 2H), 1.25 (d, J = 9.8 Hz, 1H), 0.67 (s, 2H). 13C NMR (CDCl3): δ 156.40, 156.33, 254.57, 145.46, 125.40, 143.12, 141.98, 141.84, 141.65, 140.31, 137.71, 129.28, 127.90, 126.54, 126.43, 126.30, 126.05, 120.72, 120.19, 119.33, 44.57, 40.14, 39.28, 33.02, 31.87, 23.06, 21.45.
1). Product was isolated as a pale brown solid in 26% yield. 1H NMR (400 MHz, CDCl3) δ 8.42 (d, J = 2.8 Hz, 1H), 8.37 (d, J = 7.6 Hz, 1H), 8.22 (s, 1H), 8.16 (d, J = 7.3 Hz, 1H), 8.02 (s, 1H), 7.90 (t, J = 7.8 Hz, 1H), 7.80 (d, J = 7.7 Hz, 1H), 7.74 (t, J = 7.2 Hz, 2H), 7.62 (d, J = 13.8, 7.6 Hz), 3.06 (d, J = 2.3 Hz, 1H), 2.89 (t, J = 5.4 Hz, 1H), 2.7 (m, 1H), 2.32 (s, 1H), 1.43 (s, 2H), 1.25 (d, J = 9.8 Hz, 1H), 0.67 (s, 2H). 13C NMR (CDCl3): δ 156.40, 156.33, 254.57, 145.46, 125.40, 143.12, 141.98, 141.84, 141.65, 140.31, 137.71, 129.28, 127.90, 126.54, 126.43, 126.30, 126.05, 120.72, 120.19, 119.33, 44.57, 40.14, 39.28, 33.02, 31.87, 23.06, 21.45.


 .
.


