Development and validation of a stability indicating LC-PDA-MS/MS method for separation, identification and characterization of process related and stress degradation products of rivaroxaban
Nageswara Rao Ramisetti* and
Ramakrishna Kuntamukkala
HPLC Group, Analytical Chemistry Division, CSIR-Indian Institute of Chemical Technology, Tarnaka, Hyderabad-500007, India. E-mail: rnrao55@yahoo.com; rnrao@iict.res.in; Fax: +91 40 27160387; Tel: +91 40 27193193
First published on 15th May 2014
Abstract
An isocratic reversed phase high-performance liquid chromatography coupled with a photo diode array and electrospray ionization tandem mass spectrometry (LC-PDA-ESI-MS/MS) method was developed for the identification and characterization of stress degradation products (DPs) and an unknown process related impurity (PR) of rivaroxaban (RVR) in bulk drugs. RVR, a selective and direct factor Xa inhibitor, was subjected to hydrolysis (acidic, alkaline and neutral), photolysis, thermolysis, and oxidation as per ICH guidelines and found susceptible to acid and base hydrolytic stress conditions. In total, three DPs (DP-1, DP-2, and DP-3) were formed. All the DPs, PR and RVR were well separated on a Kinetex C18 (150 × 4.6 mm, 5 μm) column using a mobile phase consisting of 20 mM ammonium acetate and acetonitrile (65![[thin space (1/6-em)]](https://www.rsc.org/images/entities/char_2009.gif) :
:![[thin space (1/6-em)]](https://www.rsc.org/images/entities/char_2009.gif) 35 v/v) at a flow rate of 1.0 ml min−1. To elucidate the structures of PR and DPs, MS/MS experiments were carried out to study the molecular ion fragmentation of RVR, PR, and DPs. The product ions of PR and DPs were compared with those of the RVR molecular ion to assign most possible structures. Potential impurities were isolated by semi-preparative HPLC and subjected to NMR spectroscopy. The LC-PDA method was validated with respect to specificity, linearity, accuracy, precision and robustness as per ICH guidelines.
35 v/v) at a flow rate of 1.0 ml min−1. To elucidate the structures of PR and DPs, MS/MS experiments were carried out to study the molecular ion fragmentation of RVR, PR, and DPs. The product ions of PR and DPs were compared with those of the RVR molecular ion to assign most possible structures. Potential impurities were isolated by semi-preparative HPLC and subjected to NMR spectroscopy. The LC-PDA method was validated with respect to specificity, linearity, accuracy, precision and robustness as per ICH guidelines.
Introduction
Rivaroxaban (RVR, molecular formula C19H18ClN3O5S, Mw 435), chemically known as (S)-5-chloro-N-((2-oxo-3-(4-(3-oxomorpholino)phenyl)oxazolidin-5-yl)methyl) thiophene-2-carboxamide is a novel, oral, selective and highly potent direct Factor Xa inhibitor, a key component of the blood coagulation cascade, which leads to thrombin activation and blood clotting. It has been approved by Health Canada, the European commission and US FDA for the prevention of venous thromboembolism in adult patients undergoing elective total hip or knee replacement surgery. It is also in advanced clinical development for the prevention and treatment of a variety of other thromboembolic disorders.1–4A few LC-MS methods have been reported for the determinations of RVR in biological fluids.5,6 One HPLC method on acid degradation of RVR has also been reported.7 A thorough literature survey revealed that no studies have been reported on identification and characterization of degradation products (DPs) and other possible impurities present in RVR bulk drugs. Since majority of the drugs are susceptible to degradation on storage, they must be analyzed by validated stability-indicating methods, which can selectively determine the drug in the presence of its possible potential impurities. It is also essential to characterize the DPs and unknown impurities present in drugs in their discovery and development process. Therefore, it is necessary to carry out stability testing studies of a drug substance under various conditions (humidity, heat and light) and report the formed DPs as per the guidelines of ICH and other international agencies.8,9 Liquid chromatography combined with mass spectrometry has been well established and found to be a very useful technique for the identification and characterization of DPs.10–14 The pharmaceutical importance of drugs has prompted us to undertake a detailed LC-MS/MS study on identification, and characterization of DPs and unknown process related impurities of RVR. Hence an attempt has been made. The current study involves the development and validation of a stability indicating RP-HPLC-PDA method for the determination RVR and PR, as well as the identification and characterization of DPs and PR with the help of MS/MS and accurate mass measurements.
Materials and methods
Chemicals
HPLC purity water was obtained by Millipore Milli-Q water purification system (Millipore synergy, France). RVR standard and samples were obtained from a local industry, Hyderabad, India. HPLC grade acetonitrile (Sigma Aldrich, India), AR grade ammonium acetate, acetic acid, dimethyl sulphoxide were purchased from S.D. Fine chemicals Pvt. Ltd., Mumbai, India. Dimethyl sulfoxide-d6 (DMSO-d6) containing 0.05% v/v tetramethylsilane (TMS) was purchased from Cambridge Isotope Laboratories, Inc., USA. All required chromatographic solvents and solutions were sonicated and filtered through 0.45 μm PTFE filters (Millipore, India) prior to use. Mixture of water and acetonitrile (40![[thin space (1/6-em)]](https://www.rsc.org/images/entities/char_2009.gif) :
:![[thin space (1/6-em)]](https://www.rsc.org/images/entities/char_2009.gif) 60) was used as diluent.
60) was used as diluent.
High performance liquid chromatography
LC-PDA studies were performed on a Prominence series HPLC system comprised of a quaternary UFLC LC-20AD pump, a DGU-20A5 degasser unit, a SPD-M20A diode array detector, a SIL-20AC auto sampler, a CTO-20AC column oven and a CBM-20A communications bus module for method development and validation studies using LC Solutions software for chromatographic data acquisition and processing (All from Shimadzu, Kyoto, Japan). A Phenomenex Kinetex C18 column (150 × 4.6 mm; 5 μm particle size) was used with mobile phase consisting of 20 mM aqueous ammonium acetate (pH = 6.5, not adjusted) (solvent A), and acetonitrile (solvent B) in an isocratic elution mode (A![[thin space (1/6-em)]](https://www.rsc.org/images/entities/char_2009.gif) :
:![[thin space (1/6-em)]](https://www.rsc.org/images/entities/char_2009.gif) B 65
B 65![[thin space (1/6-em)]](https://www.rsc.org/images/entities/char_2009.gif) :
:![[thin space (1/6-em)]](https://www.rsc.org/images/entities/char_2009.gif) 35 v/v) pumped through the column at a flow rate of 1.0 ml min−1 at a column temperature of 30 °C. The sample injection volume was 10 μl. Eluents were monitored at a wavelength of 254 nm. Same chromatographic conditions were used for LC-MS/MS studies for the identification and characterization of DPs and PR. An Agilent XDB C18 (250 × 9.6 mm; 5 μm particle size) column with a mobile phase consisting of water and acetonitrile (65
35 v/v) pumped through the column at a flow rate of 1.0 ml min−1 at a column temperature of 30 °C. The sample injection volume was 10 μl. Eluents were monitored at a wavelength of 254 nm. Same chromatographic conditions were used for LC-MS/MS studies for the identification and characterization of DPs and PR. An Agilent XDB C18 (250 × 9.6 mm; 5 μm particle size) column with a mobile phase consisting of water and acetonitrile (65![[thin space (1/6-em)]](https://www.rsc.org/images/entities/char_2009.gif) :
:![[thin space (1/6-em)]](https://www.rsc.org/images/entities/char_2009.gif) 35 v/v) at a flow rate of 2.5 ml min−1 at an ambient column temperature was used for semi-preparative isolation of impurities PR and DP-3, respectively. The sample injection volume taken was 100 μl.
35 v/v) at a flow rate of 2.5 ml min−1 at an ambient column temperature was used for semi-preparative isolation of impurities PR and DP-3, respectively. The sample injection volume taken was 100 μl.
Mass spectrometry
LC-MS analyses and accurate mass measurements were carried out using a HPLC system coupled to a quadrupole time-of-flight (Q-TOF) mass spectrometer (Q-TOF LC/MS 6510 series classic G6510A) equipped with an ESI source (all from Agilent Technologies, USA). The data acquisition was under the control of Mass Hunter workstation software. The mass spectra were recorded in positive mode of electro spray ionization (ESI). A splitter was placed prior the ESI source to allow the entry of only 40% of the eluent. The typical operating ESI source conditions for MS scan of RVR in positive mode were optimized as follows; the fragmentor voltage, 80 V; the capillary voltage, 3000–3500 V; the skimmer voltage, 60 V; nitrogen gas was used for drying (200 °C; 400 L h−1) and nebulization (50 L h−1). For collision-induced dissociation (CID) experiments, keeping MS1 static, the precursor ion of interest was selected using the quadrupole analyzer and the product ions were analyzed using a time-of-flight (TOF) analyzer. Ultra high pure nitrogen gas was used for collision, and the pressure in the collision cell was maintained at 18 Torr. All the spectra were an average of 25–30 scans recorded under identical experimental conditions.High energy CID experiments were performed on an Exactive bench top Orbitrap mass spectrometer using Thermo Xcalibur 2.1 software (Thermo Scientific, USA). The operating ESI source conditions optimized as spray voltage 5000 V; capillary temperature 250 °C; the flow rate (arb.) of sheath gas 30 and auxiliary gas 10; and heater temperature 180 °C.
Nuclear magnetic resonance spectroscopy
1H and 13C NMR spectra were recorded in DMSO-d6 on Bruker AVANCE DRX-300 MHz (RVR and PR) and 500 MHz (DP-3) spectrometers.Infrared spectroscopy
The IR spectra were recorded in solid state as KBr powder dispersion using a Thermo Nicolet Nexus 670 FT-IR spectrophotometer.Preparation of analytical solutions
Stock solutions of RVR (2.0 mg ml−1) and PR (0.5 mg ml−1) were prepared by dissolving them in minimum amount of dimethyl sulphoxide and made up to volume with diluent. The specification concentrations of RVR are 500 μg ml−1 and 100 μg ml−1 for related substance and assay methods, respectively. Specification concentration (100%) of PR is 0.1% (i.e., 0.5 μg ml−1) with respect to RVR concentration 500 μg ml−1. Working solutions of RVR at 500 μg ml−1 spiked with 0.1% of PR, and 100 μg ml−1 (unspiked) were prepared from the above stock solutions for the related substance and assay determinations, respectively. The stock solutions of RVR and PR were adequately mixed and diluted to study accuracy, precision, linearity, robustness, limits of detection and limits of quantification.Specificity and forced degradation
Specificity is the ability of the HPLC method to measure the analyte (RVR) response unequivocally in the presence of its potential process related impurities and degradation products. Forced degradation studies of RVR drug substance can help to identify the possible DPs, which in turn can help to establish the degradation pathways and the intrinsic stability of the molecule and validate the stability indicating nature of the developed analytical method. The specificity of the developed LC method for RVR was carried out in the presence of its DPs. About 10 mg of RVR (1.0 mg ml−1) solution was subjected to stress degradation such as acid (1 N HCl, 1 h), alkaline (1 N NaOH, 1 h), neutral hydrolysis (60 °C, 8 h) and oxidation (10% H2O2, 24 h) conditions. RVR drug substance was also exposed to heat (60 °C, 7 days) and UV light (254 nm, 7 days) degradation in solid state. Different stress conditions were carried out to achieve significant degradation. The collected degradation samples were neutralized (for acidic and basic hydrolyzed) and diluted five times prior to analysis. Peak purity tests were carried out to check purity and homogeneity of RVR peak in stressed samples by using PDA detector. Assay of RVR in stressed samples was performed by comparison with qualified reference standard and the mass balance (% assay + % impurities + % degradation products) was calculated. The specificity of the method was also checked by comparing the assays of RVR in both spiked (with 0.1% PR), and unspiked samples.Method validation
The proposed HPLC method was validated for assay and related substance (PR, as it is commonly observed in two batch samples out of three tested) as per ICH guidelines.15System suitability
The system suitability tests were conducted throughout the validation studies by injecting 500 μg ml−1 of RVR solution containing 0.5 μg ml−1 (0.1%) of PR and 100 μg ml−1 of RVR solution for related substance and assay methods, respectively.Sensitivity
The limits of detection (LOD) and quantitation (LOQ) for RVR and PR were determined at a signal-to-noise ratio of 3![[thin space (1/6-em)]](https://www.rsc.org/images/entities/char_2009.gif) :
:![[thin space (1/6-em)]](https://www.rsc.org/images/entities/char_2009.gif) 1 and 10
1 and 10![[thin space (1/6-em)]](https://www.rsc.org/images/entities/char_2009.gif) :
:![[thin space (1/6-em)]](https://www.rsc.org/images/entities/char_2009.gif) 1, respectively, by injecting a series of dilute solutions of known concentrations.
1, respectively, by injecting a series of dilute solutions of known concentrations.
Accuracy
The accuracy of the assay was evaluated in triplicate at the three concentration levels ranging from 50–150% (i.e., 50, 100 and 150 μg ml−1) of RVR drug substance concentration 100 μg ml−1, and the recoveries were calculated for each concentration. For related substances, the recovery of PR was determined in triplicate at four concentration levels LOQ, 50, 100, and 150% (i.e., 0.20, 0.25, 0.50 and 0.75 μg ml−1, respectively) of its specification concentration with respect to 500 μg ml−1 of RVR.Precision
The system precisions were evaluated by analyzing six replicates of standard solution for both assay (RVR, 100 μg ml−1) and related substance (RVR (500 μg ml−1) spiked with 0.1% of PR) methods individually. The method precisions for assay and related substance were evaluated by injecting six individual test preparations of RVR (100 μg ml−1), and RVR (500 μg ml−1) spiked with 0.1% of PR, respectively. The intermediate precisions were evaluated on a different day by different analyst using an instrument located within the same laboratory. Precision at LOQ level was also evaluated by injecting six individual preparations of PR spiked to RVR (500 μg ml−1) at its LOQ level. The %RSDs of the areas of PR and RVR were calculated for precision studies.Linearity
Linearity test solutions for the assay were prepared from RVR stock solutions at five different concentration levels ranging from 50–150% of assay analyte concentration (i.e., 50, 75, 100, 125 and 150 μg ml−1). Linearity test solutions for the related substances were prepared by diluting stock solution of PR to the required concentrations. The solutions were prepared at six concentration levels from LOQ to 250% of the specification level (i.e., LOQ, 0.25, 0.5, 0.75, 1.0, and 1.25 μg ml−1) with respect to 500 μg ml−1 of RVR. The peak area versus concentration data of RVR and PR were treated by linear least-squares regression analysis. The correlation coefficients (r2), slopes and Y-intercepts of the regression plots were determined.Robustness
The robustness study was carried out to evaluate the influence of small and deliberate changes in the optimized chromatographic conditions. The factors chosen for this study were the column oven temperature by ±2 °C, mobile phase pH by ±0.2 units, organic modifier concentration by ±3% and flow rate by ±0.1 ml min−1. System suitability parameters and changes in assay of RVR and content of PR were checked under all altered conditions.Results and discussion
Method development and optimization of chromatographic conditions
The main aim of the present study was to develop a mass spectrometry compatible stability-indicating LC method to separate RVR, PR (during method development it was found in RVR bulk drug samples, so that isolated, characterized and used for determination), DPs formed under different stress conditions. For method development RVR spiked with PR, and stressed sample solutions were simultaneously injected in to HPLC. The mobile phase components chosen for initial trails were aqueous buffers (ammonium acetate and ammonium formate), methanol and acetonitrile. Different C18 columns (Waters Xterra, Agilent XDB, and Phenomenex Kinetex) were studied by injecting RVR and degradation samples. In initial trails, it was observed that acetonitrile showed better peak symmetry compared to methanol, and better resolutions (>2) between RVR and its DPs were observed when used acetate buffer compared to formate buffer at very short HPLC run times (<5 min). During optimization, it was observed that all three columns showed good separations but peak asymmetry was found more in Xterra and XDB columns compared to Kinetex column. After several attempts, Kinetex C18 column with mobile phase consisting of acetonitrile and 20 mM ammonium acetate buffer (without adjusting pH) (35![[thin space (1/6-em)]](https://www.rsc.org/images/entities/char_2009.gif) :
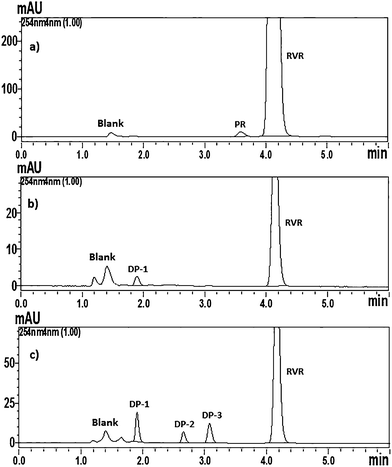
:![[thin space (1/6-em)]](https://www.rsc.org/images/entities/char_2009.gif) 65 v/v) in an isocratic elution mode at a column temperature of 30 °C and at a flow rate of 1.0 ml min−1 showed optimized chromatographic separation among RVR, PR and DPs with very good peak parameters. Chromatograms of RVR spiked with PR, and stressed samples (acid and base) are shown in Fig. 1. Same chromatographic conditions were applied for the identification and characterization of DPs and PR by LC-ESI-Q-TOF-MS/MS.
65 v/v) in an isocratic elution mode at a column temperature of 30 °C and at a flow rate of 1.0 ml min−1 showed optimized chromatographic separation among RVR, PR and DPs with very good peak parameters. Chromatograms of RVR spiked with PR, and stressed samples (acid and base) are shown in Fig. 1. Same chromatographic conditions were applied for the identification and characterization of DPs and PR by LC-ESI-Q-TOF-MS/MS.
Method validation
The system suitability results confirm that the instrument was deemed to be suitable for use as the tailing factors for RVR and PR (relative retention time is 0.87) were less than 1.2 and the resolution between the two analytes was 2.3. It also confirms the good selectivity of the method. System suitability results are given in Table 1.| Parameter | RVR | PR |
|---|---|---|
| a tR, retention time; Rs, resolution; kl, retention factor; As, tailing factor; N, number of theoretical plates; r2, correlation coefficient.b Average of six determinations.c Average of three determinations. | ||
| System suitabilityb | ||
| tR (min) | 4.15 | 3.59 |
| Rs | 2.31 | — |
| kl | 1.99 | — |
| As | 1.20 | 1.17 |
| N | 6937 | 4744 |
| Sensitivityc | ||
| LOD (μg ml−1) | 0.05 | 0.07 |
| LOQ (μg ml−1) | 0.15 | 0.20 |
| Precision (%RSD)b | ||
| System | 0.41 | 2.46 |
| Method | 0.88 | 3.67 |
| Intermediate | 0.91 | 2.18 |
| LOQ | — | 4.04 |
| Linearityc | ||
| Range (μg ml−1) | 50–150 | 0.2–1.25 |
| r2 | 0.9997 | 0.9975 |
| Slope | 31![[thin space (1/6-em)]](https://www.rsc.org/images/entities/char_2009.gif) 017 017 |
15![[thin space (1/6-em)]](https://www.rsc.org/images/entities/char_2009.gif) 106 106 |
| Intercept | 12![[thin space (1/6-em)]](https://www.rsc.org/images/entities/char_2009.gif) 863 863 |
−15.347 |
| Accuracy at 50% levelc | ||
| Amount added (μg ml−1) | 50 | 0.25 |
| Amount recovered (μg ml−1) | 49.64 | 0.2577 |
| % Recovery | 99.29 | 103.09 |
| Accuracy at 100% levelc | ||
| Amount added (μg ml−1) | 100 | 0.50 |
| Amount recovered (μg ml−1) | 100.18 | 0.4866 |
| % Recovery | 100.18 | 97.33 |
| Accuracy at 150% levelc | ||
| Amount added (μg ml−1) | 150 | 0.75 |
| Amount recovered (μg ml−1) | 149.75 | 0.7401 |
| % Recovery | 99.83 | 98.69 |
| Accuracy at LOQ levelc | ||
| Amount added (μg ml−1) | — | 0.20 |
| Amount recovered (μg ml−1) | — | 0.2106 |
| % Recovery | — | 105.28 |
The LOD and LOQ results were obtained in the range of 0.05–0.2 μg ml−1 indicating the higher detection sensitivity of the method (Table 1). The percentage recovery range for PR (97.33–105.28) and RVR assay (99.29–100.18) indicate the good quantitative ability of the developed HPLC method (Table 1). %RSD values of precision experiments were obtained below 1 for RVR and 5 for PR indicating the good precision of the method (Table 1). The linear calibration curves for RVR and PR were plotted over the tested calibration range and the linear least squares regression analysis of peak area versus concentration data demonstrated good linearity for RVR and PR (r2 > 0.997). Slope, intercept and correlation coefficient values are given in Table 1. Under all varied chromatographic conditions the resolutions between PR and RVR were obtained greater than 2.0 and tailing factors obtained below 1.5; and variability in the estimation of RVR assay and PR recovery was within ±1 and ±6%, respectively indicating the robustness of the developed method.
Degradation behavior of drug
Significant degradation of RVR drug substance was observed in acidic and basic hydrolytic stress conditions where as it was found stable to neutral hydrolysis, thermolysis, photolysis and oxidation. In total, three DPs (designated as DP-1, DP-2, and DP-3 of relative retention times 0.46, 0.64, and 0.74, respectively) were observed stress conditions. Base hydrolysis resulted all three DPs, whereas acid hydrolysis showed only DP-1 (Fig. 1). Peak purity test results derived from PDA detector confirmed that the RVR peak was homogeneous and pure in all analyzed stressed samples. Assay studies were carried out for the stressed samples against a qualified reference standard of RVR. The mass balance of all the stressed samples of RVR was obtained in the range of 99.2–99.9%. The summary of forced degradation results are given Table 2. All the degradation products formed were well separated from RVR and each other (Rs > 2), the assay of RVR was also found unaffected in the presence of impurity (PR) confirming the specificity and selectivity of the developed LC method.| Stress condition | Time | Assay of active substance (% w/w) | Total impurities (% w/w) | Mass balance (assay + total impurities) (% w/w) | Remarks |
|---|---|---|---|---|---|
| a N.F., not found. | |||||
| Acid hydrolysis (1 N HCl) | 1 h | 93.5 | 6.1 | 99.6 | Degradation designated as DP-1 |
| Base hydrolysis (1 N NaOH) | 1 h | 80.8 | 18.4 | 99.2 | Degradation designated as DP-1, DP-2, and DP-3 |
| Neutral hydrolysis (60 °C) | 8 h | 99.7 | N.F. | 99.7 | No degradation products formed |
| Oxidation (10% H2O2) | 24 h | 99.9 | N.F. | 99.9 | No degradation products formed |
| Thermal (60 °C) | 7 days | 99.5 | N.F. | 99.5 | No degradation products formed |
| Photo (UV light) | 7 days | 99.7 | N.F. | 99.7 | No degradation products formed |
Characterization of RVR, DPs, and PR by LC-MS/MS
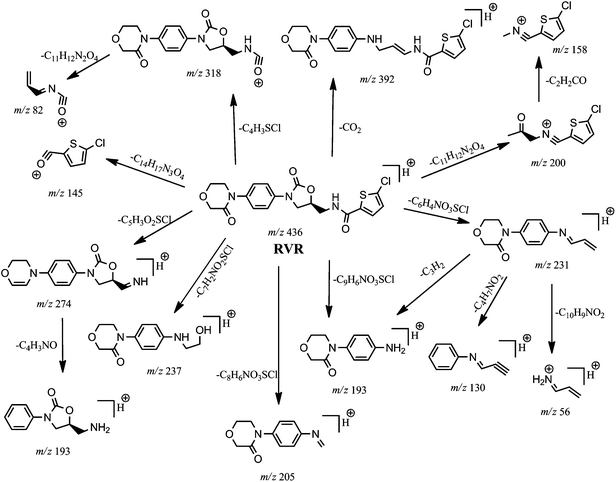
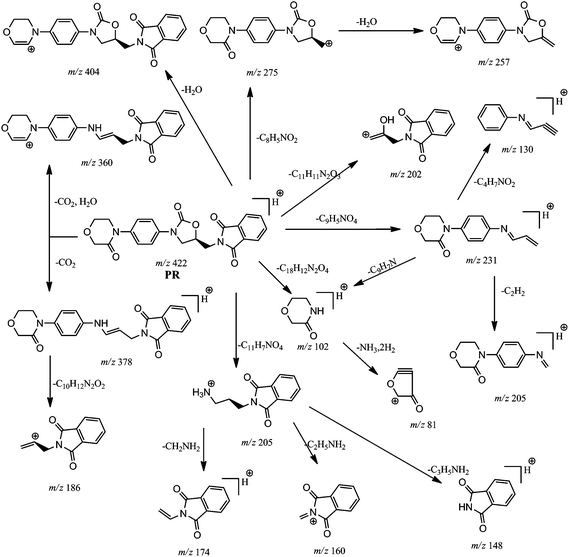
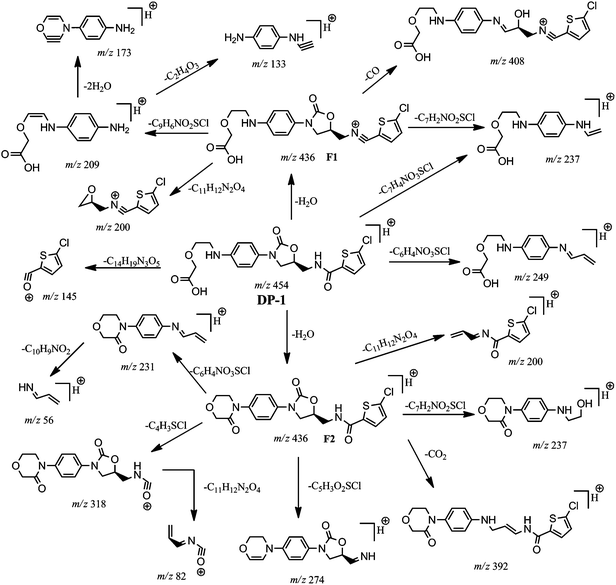
RVR and all its DPs (DP-1, DP-2 and DP-3), and PR were well separated by LC. All the compounds showed abundant protonated ([M + H]+) molecular ions under positive ESI conditions, except DP-2. DP-2 was found unionized in source and no ion resulted. Collision induced dissociation (CID) experiments were carried out on the molecular ions of RVR, DP-1, DP-3 and PR to obtain their structural information. For CID experiments, RVR, PR, and DP-3 samples were also directly infused into the ESI source in addition to LC-MS/MS. The fragmentation patterns of [M + H]+ ions of RVR, DP-1, and PR were arrived based on MS/MS experiments and accurate mass measurements from high resolutions mass spectrometry (HRMS). But DP-3 was found highly stable under CID experiments in positive mode. Most possible structures were proposed for DP-1 and PR by comparing their fragmentation patterns with that of RVR. The ESI-MS/MS spectra of RVR, PR, and DP-1 are shown in Fig. 2, and the proposed fragmentation patterns of their [M + H]+ ions are depicted in Fig. 3, 4, and 5 respectively.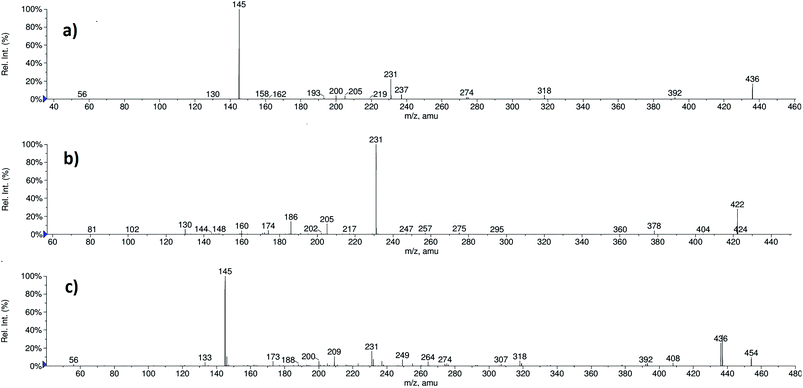 | ||
| Fig. 2 ESI-MS/MS spectra of [M + H]+ ions of (a) RVR (m/z 436), (b) PR (m/z 422), and (c) DP-1 (m/z 454). | ||
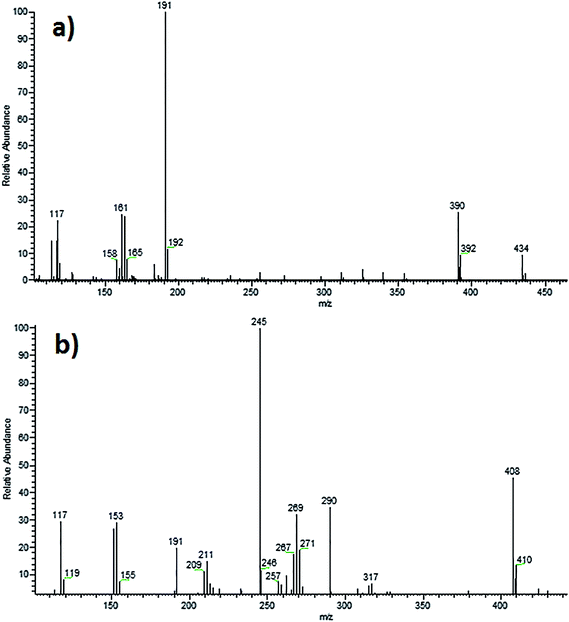
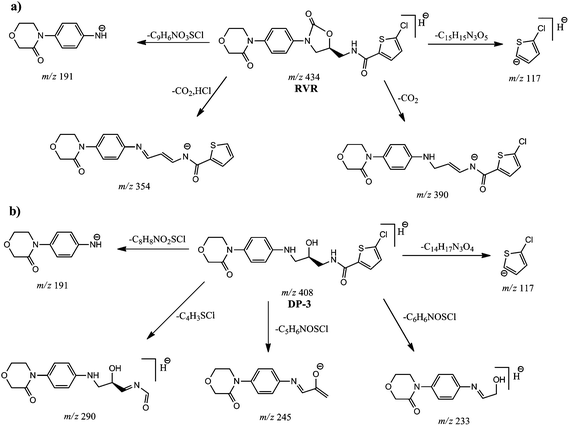
DP-3 also showed abundant molecular ion in negative ionization mode. CID spectrum was achieved at very high collision energies (150 eV). The structure of DP-3 was elucidated by comparing the fragmentation pattern with that of RVR CID spectrum achieved in negative ESI mode. ESI-MS/MS spectra of [M − H]− ions of RVR and DP-3 are shown in Fig. 6 and their corresponding proposed fragmentation patterns are depicted in Fig. 7.
MS/MS of RVR (m/z 436)
In order to elucidate the structures of PR and DP-1, RVR was initially subjected to mass spectral studies. Under ESI-MS conditions RVR showed abundant [M + H]+ ions at m/z 436. The ESI-MS/MS spectrum of [M + H]+ ion of RVR (Fig. 2) exhibited abundant product ions at m/z 145 and 231. It was proposed that, the product ion at m/z 145 (base peak) corresponds to chlorothiophene amide moiety (((5-chlorothiophen-2-yl)methylidyne)oxonium ion; C5H2ClOS) formed by the cleavage of bonds between oxazolidine and chlorothiophene moieties. The ion at m/z 231 corresponding to N-allylidene-4-(3-oxomorpholino)benzenaminium ion (C13H15N2O2) was also resulted by the cleavage of oxazolidine and chlorothiophene moieties followed by further loss of CO2 from oxazolidine ring present in RVR. In addition, the product ion spectrum also include low abundant fragment ions at m/z 392, 318, 274, 237, 205, 200, 193, 158, 130, 82, and 56. The ion at m/z 392 is may be due to the loss of CO2 molecule (−44 Da) from the [M + H]+ ion of RVR. The product ions at m/z 318 might be due to the formation of (S)-((((2-oxo-3-(4-(3-oxomorpholino)phenyl)oxazolidin-5-yl)methyl)amino)methylidyne)oxonium ion (C15H16N3O5) by loss of chlorothiophene moiety from m/z 436; m/z 274 might be due to protonated ion of 3-(4-(2H-1,4-oxazin-4(3H)-yl)phenyl)-5-(iminomethyl)oxazolidin-2-one formed by loss of chlorothiophene moiety and H2O from morpholine moiety, m/z 237 might be due to (4-(4-((2-hydroxyethyl)amino)phenyl)morpholin-3-one; C12H17N2O3) formed by the loss of thiophene amide moiety followed by CO from RVR; m/z 205 (loss of acetylene from m/z 231). N-((5-Chlorothiophen-2-yl)methylidyne)-2-oxopropan-1-aminium ion might be responsible for ion at m/z 200 (C8H7ClNOS) and m/z 158 formed by loss of ketene from m/z 200. Other product ions at m/z 193, 130, 82, and 56 might be due to protonated (S)-5-(aminomethyl)-3-phenyloxazolidin-2-one or 4-(4-aminophenyl)morpholin-3-one (C10H13N2O2), N-(prop-2-yn-1-ylidene)aniline (C9H8N), ((allylideneamino)methylidyne) oxonium (C4H4NO), and prop-2-en-1-imine (C3H6N), respectively. The product ions at m/z 145 and 231 found characteristic fragment ions of thiophene amide and oxazolidine moieties, respectively from the structure of RVR. The elemental compositions of all the precursor and product ions have been confirmed by accurate mass measurements (i.e., error ppm values were obtained below 5). The proposed fragmentation pathways of RVR are shown in Fig. 3.MS/MS of PR (m/z 422)
The ESI-MS/MS spectrum of [M + H]+ ion (m/z 422) of PR (Fig. 2) displayed abundant product ion at m/z 231 as base peak confirms the presence of oxazolidine moiety in PR as in RVR. The spectrum displayed no peak at m/z 145 confirming the absence of thiophene amide moiety in the structure of PR. The spectrum also displayed common product ions to RVR MS/MS spectrum at m/z values 205 and 130 further confirms the presence of oxazolidine moiety in PR. From elemental analysis (HRMS and CHNSO) and NMR spectral data, it is clear that PR possesses three carbon atoms more, one hydrogen atom less with an increase in aromatic protons to eight from six, and absence of sulphur atoms with additional oxygen atom compared to RVR. Lack of chlorine pattern in mass spectrum of PR indicates the absence of chlorine atom in PR. Form these results, possibility of presence of isoindoline type moiety instead of thiophene amide in the structure of PR is supposed. These results are supported by MS/MS studies. In addition to ions at m/z 231, 205, and 130, spectrum also exhibited less abundant product ions at m/z 404 (loss of H2O from [M + H]+ ion), m/z 378 (loss of CO2 from [M + H]+ ion), m/z 360 (loss of H2O followed by CO2 from [M + H]+ ion), m/z 275 corresponds to (S)-(2-oxo-3-(4-(3-oxomorpholino)phenyl)oxazolidin-5-yl)methylium ion formed by loss of isoindoline moiety from [M + H]+ ion, m/z 257 (loss of H2O from m/z 275), m/z 186 (loss of 4-(4-aminophenyl)morpholin-3-one from m/z 378), m/z 174 (loss of CH3NH2 from m/z 205), m/z 160 (loss of CH3CH2NH2 from m/z 205), m/z 148 (loss of CH2![[double bond, length as m-dash]](https://www.rsc.org/images/entities/char_e001.gif) CHCH2NH2 from m/z 205), m/z 102 (corresponds to protonated morpholin-3-one), and m/z 81 (loss of NH3 and H2 from m/z 102). The ions at m/z 148, 102 and 81 are found very less abundant in MS/MS spectrum of PR. The ions at m/z 186 (3-(1,3-dioxoisoindolin-2-yl)prop-1-en-2-ylium ion), 174 (protonated 2-vinylisoindoline-1,3-dione), 160 (2-methylene-1,3-dioxoisoindolin-2-ium ion), and 148 (protonated isoindoline-1,3-dione) clearly indicate the presence of propyl substituted isoindoline moiety connected to nitrogen atom present on phenyl ring of oxazolidine moiety in the molecular structure of PR. Loss of CO2 (44 Da) from [M + H]+ ion indicates the similar structure of RVR in PR towards oxazolidine moiety side. The elemental compositions of all the above discussed ions have been confirmed by accurate mass measurements. From these fragmentation patterns (Fig. 4), PR was concluded as (S)-2-((2-oxo-3-(4-(3-oxomorpholino)phenyl)oxazolidin-5-yl)methyl)isoindoline-1,3-dione.
CHCH2NH2 from m/z 205), m/z 102 (corresponds to protonated morpholin-3-one), and m/z 81 (loss of NH3 and H2 from m/z 102). The ions at m/z 148, 102 and 81 are found very less abundant in MS/MS spectrum of PR. The ions at m/z 186 (3-(1,3-dioxoisoindolin-2-yl)prop-1-en-2-ylium ion), 174 (protonated 2-vinylisoindoline-1,3-dione), 160 (2-methylene-1,3-dioxoisoindolin-2-ium ion), and 148 (protonated isoindoline-1,3-dione) clearly indicate the presence of propyl substituted isoindoline moiety connected to nitrogen atom present on phenyl ring of oxazolidine moiety in the molecular structure of PR. Loss of CO2 (44 Da) from [M + H]+ ion indicates the similar structure of RVR in PR towards oxazolidine moiety side. The elemental compositions of all the above discussed ions have been confirmed by accurate mass measurements. From these fragmentation patterns (Fig. 4), PR was concluded as (S)-2-((2-oxo-3-(4-(3-oxomorpholino)phenyl)oxazolidin-5-yl)methyl)isoindoline-1,3-dione.
MS/MS of DP-1 (m/z 454)
The ESI-MS/MS spectrum of the ion m/z 454 corresponding to the [M + H]+ ion of DP-1 is shown in Fig. 2. The molecular ion of DP-1 possessing the m/z value more by 18 Da compared to RVR, which might be due to addition of H2O molecule to RVR during stress conditions. It was confirmed based on the MS/MS fragmentation pattern of [M + H]+ ion of DP-1 and HRMS data. The MS/MS spectrum of [M + H]+ ion of DP-1 displayed more abundant product ions at m/z 145 and 436. The ion at m/z 145 (base peak) could be due to (((5-chlorothiophen-2-yl)methylidyne)oxonium ion; C5H2ClOS) as observed in RVR, which indicates the presence of thiophene amide moiety in DP-1. The spectrum also included another abundant product ion at m/z 436, which might be formed by a loss of H2O molecule from the [M + H]+ ion (i.e., [MH − H2O]+). The spectrum also contains low abundant, but characteristic ion at m/z 249 (m/z 231 + 18 Da), which indicates the hydrolysis of amide bond in morphine ring under stress conditions instead of oxazolidine ring in RVR. In addition, the spectrum also showed low abundance ions at m/z 408 (loss of CO from [MH − H2O]+ ion), m/z 392 (loss of H2O followed by CO2 from [M + H]+ ion), m/z 318 might be resulted by the loss of H2O followed by chlorothiophene moiety from [M + H]+ ion as in RVR, m/z 274 (loss of H2O and thiophene moiety with CO from [M + H]+ ion), m/z 237 (loss of thiophene amide moiety from m/z 408), m/z 231 (loss of thiophene amide moiety from m/z 392), m/z 209 (due to 4-((2-(carboxymethoxy)ethylidene)amino)benzenaminium ion), m/z 200 (might be due to protonated N-allylidene-5-chlorothiophene-2-carboxamide or (S)-1-(5-chlorothiophen-2-yl)-N-(oxiran-2-ylmethyl)methanaminium arose from m/z 436), very less abundant ion at m/z 82 corresponds to ((allylideneamino)methylidyne)oxonium ion, and m/z 56 might be due to protonated prop-2-en-1-imine. Two proposed structures are possible for m/z 236 based on fragment ions as shown in Fig. 5. One of the proposed structures of m/z 436 (F2) has all common fragment ions to that of other structure F1 except m/z 209, which is possible only for F1. In addition to common fragment ions, F2 also possess m/z 231, 82, and 56, which may not be possible for F1. Therefore, F1 and F2 are more probable structures for product ion of m/z 436. The elemental compositions of all the above ions have been confirmed by accurate mass measurements. Based on the above discussed fragmentation pattern (Fig. 5), DP-1 was concluded as (S)-2-(2-((4-(5-((5-chlorothiophene-2-carboxamido)methyl)-2-oxooxazolidin-3-yl)phenyl)amino)ethoxy) acetic acid.Isolation and characterization of DP-3 (m/z 410 and 408)
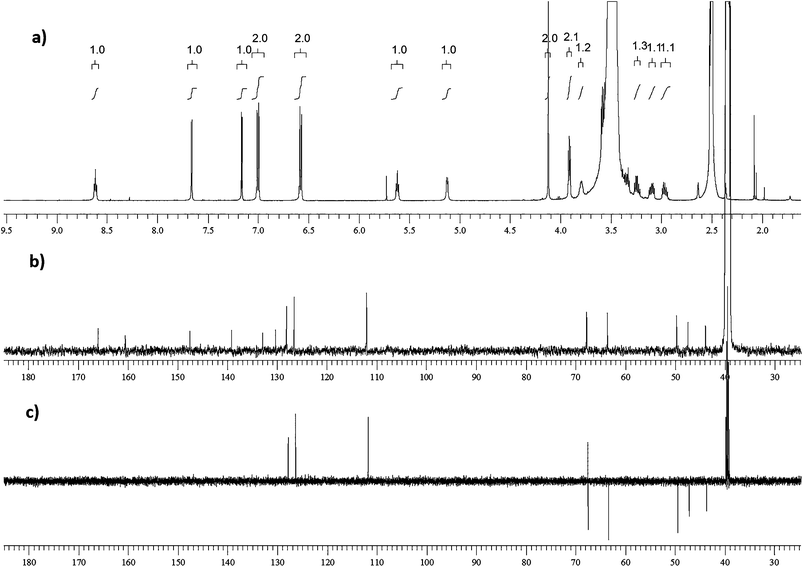
Despite the formation of three degradation products (DP-1, DP-2, and DP-3) in basic stress conditions, only DP-3 concentration was found to be increased on extended exposure of RVR to stress. Long exposure of the drug substance to 1 N NaOH, 6 h at room temperature or 0.1 N NaOH, 2 h at 65 °C resulted in ≈90% conversion to DPs with >80% of DP-3. During this process DP-2 was consumed to <1%. Both DP-2 and DP-3 were isolated by semi-preparative HPLC and subjected to NMR and ESI-MS/MS studies for structure elucidation. No structural confirmation has been accomplished for DP-2 as it showed no mass spectrum in both positive and negative ionization modes, and an unpredicted NMR spectrum. Whereas structural elucidation of DP-3 has been accomplished from NMR, FT-IR and mass spectral data.Proton, carbon-13, and DEPT-135 NMR spectra of DP-3 are shown in Fig. 8 and data is given below.
![[double bond, length as m-dash]](https://www.rsc.org/images/entities/char_e001.gif) O), 160.49 (C
O), 160.49 (C![[double bond, length as m-dash]](https://www.rsc.org/images/entities/char_e001.gif) O), 147.51 (Cq), 139.16 (Cq), 132.89 (Cq), 130.30 (Cq), 128.11 (Ar–CH), 128.08 (Ar–CH), 126.58 (2Ar–CH), 112.01 (2Ar–CH), 67.84 (CH), 67.76 (CH2), 63.61 (CH2), 49.70 (CH2), 47.42 (CH2), 43.91 (CH2).
O), 147.51 (Cq), 139.16 (Cq), 132.89 (Cq), 130.30 (Cq), 128.11 (Ar–CH), 128.08 (Ar–CH), 126.58 (2Ar–CH), 112.01 (2Ar–CH), 67.84 (CH), 67.76 (CH2), 63.61 (CH2), 49.70 (CH2), 47.42 (CH2), 43.91 (CH2).It could be clearly seen from NMR spectra, that there was an increase in protons by two and decrease in carbons by one in DP-3 compared to RVR. Additional protons could be due to –OH (δ 5.12) and –NH (δ 5.62) formed by the hydrolysis of oxazolidine-2-one ring. Up field shift of –CH proton (δ 4.84 to 3.81) was also observed in DP-3 confirming formation of –OH. From the NMR data, DP-3 was identified as (R)-5-chloro-N-(2-hydroxy-3-((4-(3-oxomorpholino) phenyl)amino)propyl)thiophene-2-carboxamide. It was further confirmed by FT-IR, ESI-MS/MS and accurate mass measurements.
ESI-MS spectra of DP-3 showed molecular ions at m/z 410 and 408 corresponding to the [M + H]+ and [M − H]− ions in positive and negative ionization modes, respectively. CID experiments on molecular ions of DP-3 at low collision energies resulted no fragmentation in both positive and negative ionization modes. At very high collision energies (150 eV) fragmentation of [M − H]− ions was observed, whereas no fragmentation was achieved for [M + H]+ ions. For structure elucidation of DP-3, RVR was also subjected to CID experiments in negative ionization mode for comparison of the data.
In negative ESI mode, RVR showed molecular ion ([M − H]−) at m/z 434 in MS spectrum. ESI-MS/MS spectrum of RVR (Fig. 6) showed base peak at m/z 191, which might be corresponding to (4-(3-oxomorpholino)phenyl)amide. CID spectrum also showed abundant fragment ions at m/z 390, 161 and 116. Ion at m/z 390 might be due to (5-chlorothiophene-2-carbonyl)(3-((4-(3-oxomorpholino)phenyl)amino)prop-1-en-1-yl)amide resulted by the loss of CO2 from m/z 434. The other ion of m/z 117 might be resulted due to the formation of 5-chlorothiophen-2-ide. In addition, the spectrum also showed low abundant fragment ions at m/z 354, 339, 325 and 311. Among them, ion at m/z 354 might be resulted due to the formation of (3-((4-(3-oxomorpholino)phenyl)imino)prop-1-en-1-yl)(thiophene-2-carbonyl)amide. The elemental compositions of all the precursor and fragment ions have been confirmed by accurate mass measurements.
The ESI-MS spectrum of DP-3 showed abundant molecular ion ([M − H]−) at m/z 408 in negative mode (Fig. 6). Decrease in m/z value less of molecular ion of DP-3 by 26 Da compared to RVR might be due to loss of CO during basic stress conditions. It was confirmed based on the MS/MS fragmentation pattern of [M − H]− ion of DP-3 and accurate mass measurement experiments. The ESI-MS/MS spectrum of [M − H]− ion of DP-3 displayed more abundant product ion (base peak) at m/z 245, which might be due to the formation of 3-((4-(3-oxomorpholino)phenyl)imino)prop-1-en-2-olate by the loss of thiophene moiety. This ion was absent in the case of RVR as there was no free –NH and –OH (i.e., oxazolidin-2-one) confirming the hydrolysis. The spectrum also showed abundant ions at m/z 290, 269, 191, 151 and 117. The ion at m/z 290 might be resulted by loss of thiophene moiety from m/z 408, m/z 191 might be formed due to (4-(3-oxomorpholino)phenyl)amide as in RVR, and m/z 117 might be corresponding to 5-chlorothiophen-2-ide. The minor fragment ion observed at m/z 233 might be resulted by the loss of thiophene amide moiety from m/z 408. The fragment ions of m/z 245, and 191 clearly confirming the hydrolysis of oxazolidine-2-one moiety. Above discussed fragmentation pattern (Fig. 7) confirms the proposed structure for DP-3. The elemental compositions of all the above ions have been confirmed by accurate mass measurements.
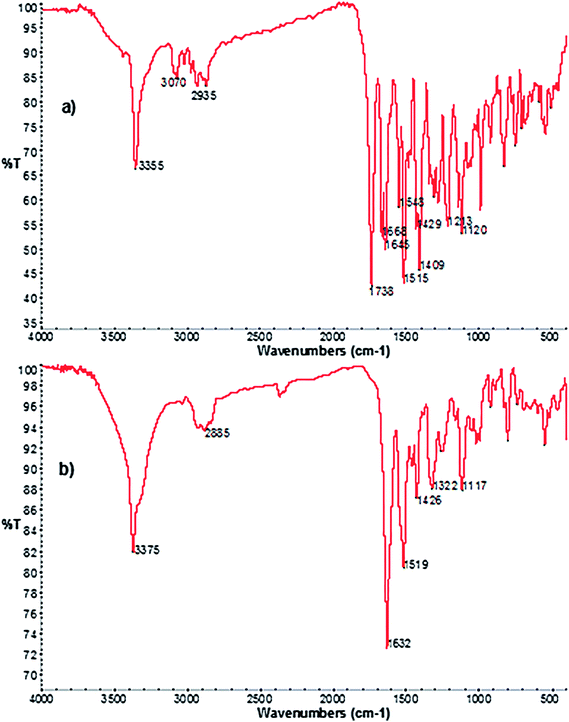
FT-IR spectra of RVR and DP-3 (Fig. 9) showed an additional stretching peak at 1738 and 3200–3700 cm−1, respectively corresponding to C![[double bond, length as m-dash]](https://www.rsc.org/images/entities/char_e001.gif) O (RVR) and –OH (DP-3). This difference clearly confirms the proposed structure of DP-3 (loss of –CO from RVR and formation of –OH) formed by hydrolysis of RVR.
O (RVR) and –OH (DP-3). This difference clearly confirms the proposed structure of DP-3 (loss of –CO from RVR and formation of –OH) formed by hydrolysis of RVR.
Isolation and characterization of PR by NMR
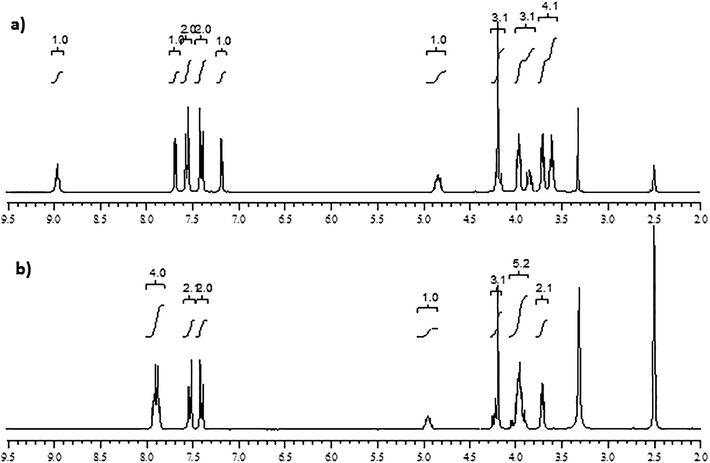
An unknown impurity (PR) observed in some of the bulk drug samples of RVR was isolated by using semi preparative HPLC technique and fraction collection using conditions as mentioned in Experimental section. 10 g of RVR (containing 0.09% of PR) was dissolved in minimum amount of DMSO and 30 ml of acetonitrile was added, sonicated and filtered to remove undissolved RVR, concentrated under high vacuum and injected into HPLC system to isolate PR by collecting the fractions. All the collected fractions were pooled together and dried under high vacuum on a rota-evaporator to get PR and subjected to NMR spectroscopy for structural characterization. Based on differences in 1H and 13C NMR, MS/MS, and CHNSO elemental analyses data of RVR and PR confirms the proposed structure of PR. 1H NMR spectra of RVR and PR are shown on Fig. 10.![[double bond, length as m-dash]](https://www.rsc.org/images/entities/char_e001.gif) O), 160.69 (C
O), 160.69 (C![[double bond, length as m-dash]](https://www.rsc.org/images/entities/char_e001.gif) O), 153.98 (C
O), 153.98 (C![[double bond, length as m-dash]](https://www.rsc.org/images/entities/char_e001.gif) O), 138.35 (Cq), 136.96 (Cq), 136.38 (Cq), 133.16 (Ar–CH), 128.33 (Cq), 128.02 (Ar–CH), 125.82 (2Ar–CH), 118.24 (2Ar–CH), 71.23 (CH), 67.63 (CH2), 63.38 (CH2), 48.91 (CH2), 47.35 (CH2), 42.12 (CH2).
O), 138.35 (Cq), 136.96 (Cq), 136.38 (Cq), 133.16 (Ar–CH), 128.33 (Cq), 128.02 (Ar–CH), 125.82 (2Ar–CH), 118.24 (2Ar–CH), 71.23 (CH), 67.63 (CH2), 63.38 (CH2), 48.91 (CH2), 47.35 (CH2), 42.12 (CH2).![[double bond, length as m-dash]](https://www.rsc.org/images/entities/char_e001.gif) O), 165.84 (C
O), 165.84 (C![[double bond, length as m-dash]](https://www.rsc.org/images/entities/char_e001.gif) O), 153.71 (C
O), 153.71 (C![[double bond, length as m-dash]](https://www.rsc.org/images/entities/char_e001.gif) O), 137.05 (Cq), 136.29 (Cq), 134.50 (2Ar–CH), 131.40 (2Cq), 125.84 (2Ar–CH), 123.14 (2Ar–CH), 118.32 (2Ar–CH), 69.94 (CH), 67.63 (CH2), 63.37 (CH2), 48.91 (CH2), 47.72 (CH2), 40.37 (CH2).
O), 137.05 (Cq), 136.29 (Cq), 134.50 (2Ar–CH), 131.40 (2Cq), 125.84 (2Ar–CH), 123.14 (2Ar–CH), 118.32 (2Ar–CH), 69.94 (CH), 67.63 (CH2), 63.37 (CH2), 48.91 (CH2), 47.72 (CH2), 40.37 (CH2).Mechanism of degradation
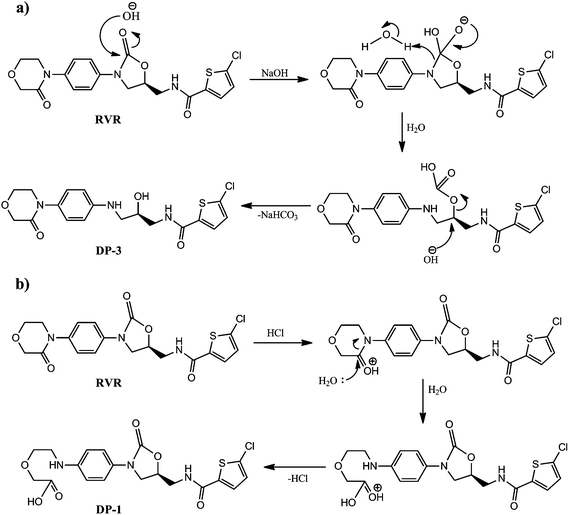
From the stress conditions, it was clear that acidic hydrolysis resulted only DP-1 and basic hydrolysis resulted DP-3. The schematic representations of mechanism of formation of DP-1 and DP-3 under hydrolytic stress are depicted in Fig. 11.Conclusions
The forced degradation behavior of RVR was studied as per ICH prescribed guidelines. Three degradation products were formed under stress conditions as detected by HPLC. ESI-MS/MS studies were carried out to characterize structures of degradation products and unknown process related impurity (PR) observed in RVR bulk drug samples. The proposed structures of PR and two of the degradation products (DP-1 and DP-3) were well supported by high resolution ESI-MS/MS analysis and accurate mass measurements. PR and DP-3 were isolated and characterized also by NMR spectroscopy. A simple, rapid, and isocratic stability indicating RP-HPLC method has been developed and validated for the determination of RVR and its related substance PR in bulk drugs. The developed method was found to be selective, precise, accurate, sensitive and robust, and is applicable for detecting related substances (PR and other possible degradation products) which may be present at trace level in bulk drugs.Acknowledgements
The authors thank Director, IICT, Hyderabad, India for encouragement and permission to communicate results for publication. RK thanks CSIR, New Delhi, for Research Fellowship.References
- K. G. Mann, K. Brummel and S. Butenas, J. Thromb. Haemostasis, 2003, 1, 1504–1514 CrossRef CAS.
- W. Mueck, S. Schwers and J. Stampfuss, Thromb. J., 2013, 11, 10 CrossRef CAS PubMed.
- S. Roehrig, A. Straub, J. Pohlmann, T. Lampe, J. Pernerstorfer and K. H. Schlemmer, J. Med. Chem., 2005, 48, 5900–5908 CrossRef CAS PubMed.
- B. J. Biemond, E. Perzborn, P. W. Friederich, M. Levi, U. Buetehorn and H. R. Buller, Thromb. Haemostasis, 2007, 97, 471–477 CAS.
- G. Rohde, J. Chromatogr. B: Anal. Technol. Biomed. Life Sci., 2008, 872, 43–50 CrossRef CAS PubMed.
- C. Weinz, T. Schwarz, D. Kubitza, W. Mueck and D. Lang, Drug Metab. Dispos., 2009, 37, 1056–1064 CrossRef CAS PubMed.
- A. K. Pinaz and K. S. Muralikrishna, Asian J. Pharm. Ana., 2013, 3, 62–65 Search PubMed.
- ICH, Stability testing of new drug substances and products Q1A (R2), in International Conference on Harmonization, IFPMA, Geneva, 2003 Search PubMed.
- WHO, Draft Stability Testing of Active Pharmaceutical Ingredients and Pharmaceutical Products, World Health Organization, Geneva, 2007 Search PubMed.
- S. Gorog, TrAC, Trends Anal. Chem., 2006, 25, 755–757 CrossRef PubMed.
- S. Singh, T. Handa, M. Narayanam, A. Sahu, M. Junwal and R. P. Shah, J. Pharm. Biomed. Anal., 2012, 69, 148–173 CrossRef CAS PubMed.
- R. N. Rao and A. N. Raju, J. Sep. Sci., 2006, 29, 2733–2744 CrossRef CAS.
- R. N. Rao, A. N. Raju and R. Narsimha, J. Sep. Sci., 2008, 31, 1729–1738 CrossRef CAS PubMed.
- R. N. Rao, K. Ramakrishna, B. Sravan and K. Santhakumar, J. Pharm. Biomed. Anal., 2013, 77, 49–54 CrossRef PubMed.
- ICH Q2 (R1), International Conference on Harmonization, Validation of Analytical Procedures: Test and Methodology, November, 2005 Search PubMed.
| This journal is © The Royal Society of Chemistry 2014 |

