Improvement of wood material properties via in situ polymerization of styrene into tosylated cell walls

Mahmut A. Ermeydana, Etienne Cabanebc, Notburga Gierlingerbc, Joachim Koetzd and Ingo Burgert*bc
aMax Planck Institute of Colloids and Interfaces, Department of Biomaterials, Potsdam, Germany
bETH Zurich, Institute for Building Materials, Zurich, Switzerland. E-mail: iburgert@ethz.ch
cEmpa - Swiss Federal Laboratories for Material Testing and Research, Applied Wood Research Laboratory, Dübendorf, Switzerland
dUniversity of Potsdam, Institute of Chemistry, Potsdam, Germany

Received 24th January 2014 , Accepted 24th February 2014

First published on 24th February 2014


Abstract

As an engineering material derived from renewable resources, wood possesses excellent mechanical properties in view of its light weight but also has some disadvantages such as low dimensional stability upon moisture changes and low durability against biological attack. Polymerization of hydrophobic monomers in the cell wall is one of the potential approaches to improve the dimensional stability of wood. A major challenge is to insert hydrophobic monomers into the hydrophilic environment of the cell walls, without increasing the bulk density of the material due to lumen filling. Here, we report on an innovative and simple method to insert styrene monomers into tosylated cell walls (i.e. –OH groups from natural wood polymers are reacted with tosyl chloride) and carry out free radical polymerization under relatively mild conditions, generating low wood weight gains. In-depth SEM and confocal Raman microscopy analysis are applied to reveal the distribution of the polystyrene in the cell walls and the lumen. The embedding of polystyrene in wood results in reduced water uptake by the wood cell walls, a significant increase in dimensional stability, as well as slightly improved mechanical properties measured by nanoindentation.

Introduction

Wood has been an essential engineering material for humankind since ancient times due to its global abundance, light weight, excellent mechanical properties, and processability. In modern societies, wood still has a significant impact because of its sustainability, with increasing utilization as an indoor and outdoor construction material. However, due to its hygroscopic nature, wood swells and shrinks by absorbing and desorbing water upon humidity changes, which makes it dimensionally instable.1–3

The quest for solutions against this major disadvantage has led to a number of studies with the aim to modify wood and further improve its quality. Increasing demand for high quality products, environmental awareness of societies, increasing prices and concerns about use of tropical hardwoods accelerated research activities in the field.2,3

Various esterifications and etherifications,2–4 silylations,5–7 and polymerization reactions have been tried so far. However, none of these approaches entirely fulfilled the required product properties (e.g. long-term dimensional stability, increased or retained mechanical properties, moderate increases in density, absence of by-products, reasonable commercialization prizes, minimized or no environmental/health risk, etc.). To date, only a few modification methods have been introduced to the market, such as acetylation,8,9 or furfurylation,4 mainly because of limitations in up-scaling and product costs.

The wood treatments can be classified according to the targeted wood components and the type of interactions created within the wood structure. Hydrophilic reactants are known to penetrate the hygroscopic wood cell walls easily and can be used to establish covalent bonds addressing functional hydroxyl groups of the natural polymers (lignin, cellulose, and hemicellulose). Another approach consists in bulking the micro- and nano-voids in the cell walls with reagents that can be locked in wood and provide permanent dimensional stability and water repellence.2–4,10

One possibility to lock new material in wood is to introduce monomers with low molecular weight and convert them into polymer chains in situ. Several publications report on the modification of wood by polymerizing monomers impregnated in wood blocks.11–19 Among the hydrophobic monomers studied, styrene has several advantages related to up-scale possibilities and easy polymerization at mild temperatures. Styrene itself is highly hydrophobic and has very limited penetration into the cell wall. In some studies, minor amounts of hydrophilic solvents (methanol or ethanol) were used with styrene, which resulted in an improvement of dimensional stability with very high weight gains only,3 most probably due to the absence of polymer within the cell walls.

Indeed, it is well known that the addition of new material inside the lumen of the wood cells only has little effect on the hygroscopic nature of wood.2,3,12,17 In order to improve the treatment efficiency, it is of high importance to load cell walls rather than lumen. By doing this, a limited weight gain upon modification is possible and wood's light weight advantages can be retained.

Polymerization of hydrophobic molecules does not take place in the cell wall without pre-treatment.18 In a previous study, our group has introduced “activation” of cell walls by a pre-treatment which allows for further impregnation by hydrophobic molecules (flavonoids) and resulted in a reduction of moisture uptake up to 31%.20 In short, the “activation” of the cell walls consists in reacting some of the –OH groups from the wood polymer network with tosyl chloride moieties. This chemical pre-treatment was shown to hydrophobize wood cell walls, hence improving the penetration of hydrophobic molecules in a second stage.20 The mild conditions used for this two-step modification treatment are suitable for wood, and avoid significant losses in natural properties, as opposed to other techniques. Following this preceding work with flavonoids, here we aim at successfully inserting hydrophobic polymers within spruce cell walls for a further modification development. Polystyrene chains entangled within the cell wall structure would yield a more durable treatment and enhanced bulking in the wood micro- and nano-voids with affordable starting materials. Hence, we postulate that the tosylation technique could be advantageously used with hydrophobic monomers to prepare wood–polymer materials. Here we demonstrate that polystyrene chains are present in the cell walls, which means that they contribute to the improvement of the dimensional stability of spruce wood (Picea abies) without dominant densification.

Experimental

Materials

para-Toluene sulfonyl chloride (TsCl), dry pyridine (Py), dimethyl formamide (DMF), styrene (St), azobisisobutyronitrile (AIBN), and acetone were bought from Sigma-Aldrich and used as received.

Chemical modification of wood cubes

Wood sampling. Norway spruce (Picea abies) wood cubes (1 cm × 1 cm × 0.5 cm; radial × tangential × longitudinal) were cut along the grain, and dried in oven (see ESI Fig. S1). For each of the different treatments, fifteen cubes were used and assigned as follows: reference wood (Ref – unmodified), tosylated wood (Ts1 – low weight gain tosylation, Ts2 – high weight gain tosylation), modified wood (St – in situ styrene polymerization without pre-treatment, St1 – pre-treated with low WPG tosylation followed by in situ styrene polymerization, St2 and St3 – pre-treated with high WPG tosylation followed by in situ styrene polymerization). After the treatments, ten cubes from each group were used for physical characterization (i.e. swelling, water uptake, anti-swelling efficiency, and equilibrium moisture content tests). Five cubes from each set were used for structural and chemical analysis. A detailed description of the experimental workflow is given in ESI (Fig. S1), and the sample nomenclature is clarified in Fig. 1.
image file: c4ra00741g-f1.tif
Fig. 1 Nomenclature for the reaction of spruce wood cubes with different steps and conditions.
Step 1: tosylation of wood cubes. The tosylation conditions used in this work are reported elsewhere.20 The wood cubes were dried at 60 °C for one day, and their weight was measured (oven dry weight). Cubes were placed in 40 ml of dry pyridine. After one day of swelling, the reaction flask was cooled down in an ice bath before adding para-toluene sulfonyl chloride (TsCl). We immersed wood blocks in pyridine for 24 h before starting tosylation reaction as mentioned (St1 sample set was directly put into pyridine–tosyl chloride solution). The amount of TsCl added was calculated as one equivalent of TsCl per OH functionality in wood (n(OH), calculated as anhydrous glucopyranose equivalent, AGU, MW = 162 g mol−1). Tosylated wood was produced with a low weight gain (Ts1) and a high weight gain (Ts2). The wood and TsCl were allowed to react at 5 °C for one day. After reaction completion, the control cubes were washed with acetone and the other samples were cleaned with pyridine before step two.
Step 2: styrene impregnation and polymerization. After washing of the tosylated wood cubes to get rid of unreacted tosyl groups, a styrene solution in DMF or pyridine (St[thin space (1/6-em)]:[thin space (1/6-em)]Py – 50[thin space (1/6-em)]:[thin space (1/6-em)]50 v/v for St1 and St2, St[thin space (1/6-em)]:[thin space (1/6-em)]DMF – 60/40 v/v for St3), containing 1% of AIBN as initiator was added to the wood blocks. The cubes were stored in this solution for one day, in order to maximize monomer impregnation in wood cell walls before starting the polymerization. Prior to reaction, the solution was degassed by bubbling argon for 30 minutes to get rid of oxygen. The reaction flasks were heated at 75 °C overnight to polymerize styrene. After reaction completion, the cubes were washed with several volumes of acetone, then with water, and finally dried in the oven at 65 °C for 24 h.

Characterization

Swelling coefficient (S), anti-swelling efficiency (ASE), and water uptake (WU). Initial weights and dimensions of all three sets of cubes (5 × unmodified, 5 × control, 5 × modified) were measured. Then the cubes were placed into deionized water in separate flasks and stirred for 5 days with moderate shaking. Weights and dimensions were measured after 5 days and then the cubes were stored in an oven at 103 °C for drying (first cycle). Weights and dimensions of the dry cubes were measured and samples were placed again in deionized water for the second water-soaking and drying cycle (second cycle). The degree of dimensional stability was obtained by calculating swelling coefficient (S) and anti-shrinking/anti-swelling efficiency (ASE) as reported.21 The water repellence efficiency was given by the water uptake calculations. The equations for S, ASE, and water uptake calculations are given in ESI (Fig. S2).
Equilibrium moisture content (EMC). Reference, tosylated, and modified samples were equilibrated in a sealed container at a relative humidity of ∼75% obtained with a saturated solution of NaCl at room temperature. Weight equilibrium of the samples was recorded by weighing samples until constant weight. Afterwards, samples were oven-dried at 103 ± 2 °C and weighed again to determine final moisture content. For each treatment 5 samples were measured. Equation for the EMC calculation is given in the ESI (Fig. S3).
Volume change and weight percentage gain (WPG). Dimensions and weights of the wood cubes were measured before and after treatments in order to determine volume and weight changes caused by chemicals introduced.
Raman imaging and spectroscopy. 40 μm thick cross-section slices were cut on a rotary microtome (LEICA RM2255, Germany) and kept between glass slides with a drop of water to retain cell walls in wet condition. The cross-section of modified spruce wood was analysed using confocal Raman microscopy. Spectra were acquired with a confocal Raman microscope (alpha300, WITec GmbH, Ulm, Germany) equipped with an objective (60×, NA = 0.8, 0.17 mm coverslip correction, from Nikon Instruments, Amstelveen, The Netherlands). A 532 nm laser with λ = 532 nm (Crysta Laser, Reno, NV, USA) is focused with a diffraction limited spot size of 0.61λ/NA and the Raman signal detected with an air cooled, back illuminated CCD camera (DV401-BV, Andor, Belfast, North Ireland) behind a spectrograph (UHTS 300, WITec) with a spectral resolution of 3 cm−1. For mapping, an integration time of 0.4 s was chosen, every pixel corresponding to one spectrum acquired every 0.5 μm. Two-dimensional chemical images of cellulose, lignin, and tosylated tissues were compiled by Witec Project software using the integration filter. A classical integration method could not be used to generate polystyrene image, due to the weak intensity of the polystyrene band at 1005 cm−1. The Raman images of polystyrene distribution were obtained using the “advance fitting” option of the Witec Plus software. The polystyrene band at 1005 cm−1 was fitted to multispectral data set by a Gaussian function yielding an image showing the distribution of this specific band from the data set (for detailed information please see Fig. S4 in the ESI). The intensity profiles of polystyrene, cellulose, and lignin were obtained along the marked line on the Raman image by plotting the intensity of selected bands assigned to the different components (lignin, cellulose, polystyrene).
Scanning electron microscopy (SEM). The morphologies of the modified and reference wood samples were documented via imaging cross-sections using an (E)SEM device (FEI FEG-ESEM Quanta 600, FEI Company, Hillsboro, OR, USA) with a backscattered electron (BSE) detector operated at 7.5–10 kV with a 10 mm sample-detector distance, 4.0/5.0 nm spot size, and 0.75 torr pressure.
Nanoindentation. The mechanical characterization of tracheid cell walls was carried out on a Dimension DI-3100 atomic force microscope (Digital Instruments, Veeco Metrology Group, Santa Barbara, CA) equipped with a Hysitron add-on force transducer for nanoindentation (Surface, Hueckelhoven, Germany). For this purpose, samples were dried overnight in an oven at 60 °C and subsequently embedded in AGAR resin (AGAR low viscosity resin kit, AGAR Scientific Ltd., Stansted, UK). Specimens were impregnated with the embedding resin and cured overnight in an oven at 60 °C. 2 mm thick slices were cut from the resin block. The embedded specimens were glued onto metal discs (15 mm AFM specimen discs), and the surface was smoothed with a Leica Ultracut-R ultramicrotome equipped with a Diatome Histo diamond knife. Quasi-static indentation tests were performed in a force-controlled mode; the indenter tip (Berkovich-type triangular pyramid) was loaded to a peak force of 250 μN at a loading rate of 100 μN s−1, held at constant load for 15 s, and unloaded at a rate of 100 μN s−1.

Results and discussion

Loading of spruce wood with polystyrene

Wood modification process. In the first step, our aim was to address the –OH groups of the cell wall components (lignin, cellulose, and hemicellulose), via a covalent reaction with tosyl chloride. In a previous study, it was shown that such a treatment is effective in reducing the hydrophilicity of wood, and facilitates the penetration of hydrophobic chemicals in the second treatment step.20 In the second step, wood was impregnated with a solution of styrene containing an azo-initiator (AIBN). Since styrene is a hydrophobic molecule, it was dissolved in a good solvent for wood such as DMF or pyridine to maximize cell wall penetration.22 The free radical polymerization of styrene was then conducted for 18 hours at 75 °C (Fig. 2).
image file: c4ra00741g-f2.tif
Fig. 2 Schematic representation of the modification route: functionalization of cell wall –OH groups with tosyl groups, followed by in situ polymerization of styrene monomer.

Prior to in depth characterization of cell walls, we can already collect important information on the success of the wood modification by the weight gains and the dimensional changes immediately after reaction. The weight gains determined after tosylation (step 1), polymerization (step 2), and after full treatment (cumulative) are respectively named WPG1, WPG2, and WPG, and are given in Table 1. For the tosylation pre-treatment, WPG1 directly relates to the number of hydroxyl groups reacted with tosyl chloride. As we reported before, the amount of tosyl in wood after the first step has a critical influence on the insertion of hydrophobic compounds in wood. By reacting the –OH groups with TsCl, the hydrophilic nature of the cell wall is changed to a more hydrophobic environment, hence improving penetration of non-polar molecules such as styrene. The total weight gains after full treatment, i.e. after washing with a good solvent for polystyrene, show that in all experiments a significant amount of polymer was retained in the wood structure.

Table 1 Summary of weight percent gains and volume changes of spruce wood blocks after tosylation and polymerization reactions with various TsCl–St compositions
Exp. ID Tosylation Polymerization Total
WPG1 (%) Vol. change (%) WPG2 (%) WPG (%) Vol. change (%)
St N/A N/A 38.8 38.8 −1.2
St1 3.1 − Ts1 −0.6 − Ts1 35.7 40.0 −1.7
St2 14.2 − Ts2 0.9 − Ts2 19.7 36.3 1.6
St3 16.7 − Ts2 1.7 − Ts2 30.2 52.0 4.0


Table 1 also provides information on the dimensional changes of the wood cubes upon treatment. A positive change in volume (i.e. the wood cubes are slightly swollen after treatment) reflects the presence of material in the cell wall, via a bulking effect (experiment St2 and St3). Theoretically, filling up only the wood lumen with materials should result in a constant volume. The shrinkage (negative volume change observed for St and St1 sample series) is most likely due the release of internal stresses due to rearrangements of cell wall polymers during the solvent treatment.

The results given in Table 1 suggest that in the case of modification treatments without tosylation (St experiment) or with very little tosyl groups in cell wall (St1), the polymer added in step 2 does not enter cell wall. On the contrary, it seems that when a significant amount of tosyl group functionalizes wood, the polymer is present in the cell wall to some extent (St2 and St3).

Understanding the polymer distribution in wood is of high importance. It has already been shown that the location of a polymer or any other added material in wood has a strong influence on the overall properties of the modified wood.23,24 If the added material sits in the lumina area, then properties such as dimensional stability (which is directly related to cell wall deformation) or biodegradability will hardly be changed.

In order to affect such properties, the added material (a polymer in our case) should be located within the wood cell wall. In the next part, we carefully studied the chemical composition, morphology and structure of the wood after full treatment using Scanning Electron Microscopy (SEM) as well as confocal Raman imaging and spectroscopy. Results of a semi-quantitative method which was developed to estimate polymer content in the cell walls will also be discussed.

Polymer location using Raman spectroscopy. Confocal Raman microscopy is a powerful technique for the detailed analysis of plant cell walls in general.25–27 With this technique, the chemical signatures of the different cell wall constituents of wood as well as the polystyrene can be singled out within the complex spectra obtained. Typical spectra of reference, tosylated, and modified cell walls, as well as pure polystyrene are presented in Fig. 3. For polystyrene the band at 1005 cm−1, which belongs to ring breathing of benzenes, was used for integration.28
image file: c4ra00741g-f3.tif
Fig. 3 Top: comparison of full Raman spectra of polystyrene, reference cell wall, tosylated cell wall, and fully modified cell wall with polystyrene. Bottom: Raman images (55 × 60 μm2) of latewood cell wall tissue. Images were plotted by integration of Raman bands from spectral data set: (a) CH-groups (2860–3020 cm−1), (b) lignin (1555–1645 cm−1), (c) tosyl groups (780–825 cm−1), and (d) polystyrene distribution in the cell wall and in the lumen which was plotted by the advance Gaussian fitting of the single band at 1005 cm−1.

The Raman bands of tosyl groups on tosylated and modified cell walls can be assigned to asymmetric stretching of sulfonyl group (νas SO2) at 1372 cm−1, and symmetric stretching of sulfonyl group (νs SO2) at 1176 cm−1 (Fig. 3d).29 The C–H stretching band of aromatic ring at 3073 cm−1 also belongs to tosyl groups covalently bonded to the cell wall polymers.

The Raman images shown in Fig. 3 were obtained via scanning of a latewood cross-section from fully treated wood (St3), followed by integration of relevant peaks for wood constituents, tosyl groups, and polystyrene (see methods part). Fig. 3a and b represent the CH-groups and lignin distributions and help to visualize the cell wall structure. Integration of the CH-groups clearly depicts the secondary cell wall regions (bright turquoise zones), while the lignin intensity is higher in the cell interstitial space, cell corners (CC) and compound middle lamella (CML) (bright red zones). The tosyl groups distribution indicates that functionalization took place deep within the secondary cell wall (Fig. 3c), and the high intensity regions suggest that the chemicals diffused from the lumen interface towards inner cell wall regions. Fig. 3d represents the polystyrene distribution, which was generated by using a Gaussian fitting as explained in methods part (see also ESI Fig. S4). This image clearly shows that styrene polymerized in the lumen area of some cells. Regions with weak intensity (orange zones in Fig. 3d) also reveal the presence of polymer in the secondary cell wall. However, the strong contrast between pure polymer in the lumen, and polystyrene enriched regions of the cell wall makes it difficult to interpret these images.

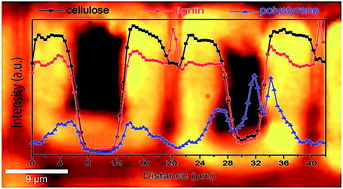
In order to get a better understanding of the distribution of polystyrene in cell walls, Raman intensity profiles of a specific band from polystyrene (1005 cm−1) were recorded along a line drawn across two latewood cells, as shown in Fig. 4A. The intensity profiles of cellulose and lignin recorded along the line and superimposed with the polystyrene profile were used to assess the presence of polymer in the cell wall (Fig. 4B). The null intensity regions correspond to the empty lumen area, and are immediately framed by high intensity regions representing the cell walls. Besides the characteristic distribution patterns of cellulose and lignin, the plot clearly shows an overlap with polystyrene in the cell wall regions. These profiles indicate that polystyrene chains can be found in cell wall, up to 2–3 μm below the lumen interfacial area (reflected in the schematic illustration in Fig. 2). Along the polystyrene profile, the peak around 31 μm corresponds to polymer present in the lumen, which was observed in Fig. 3d.


image file: c4ra00741g-f4.tif
Fig. 4 (A) Raman image from C–H stretching integration and visualization of the profile line and measurement points. (B) Intensity profiles of cellulose, lignin, and polystyrene in cell walls and lumen along the line shown in (A). (C) Raman spectra of the 10 points shown in (A), compared to polystyrene and reference cell wall spectra.

The Raman spectra associated to the points shown on Fig. 4A are given in Fig. 4C. These spectra can be compared with the reference wood spectrum and the pure polystyrene spectrum, and show that the peak at 1005 cm−1 can be used as a clear marker for the presence or absence of polystyrene in wood.

Polymer location and content studied with SEM. To support findings from Raman spectroscopy, and propose an estimation of polymer content in the different wood regions, a series of SEM pictures of cube cross sections was performed (Fig. 5). In order to have an idea of the polymer distribution within the cubes, the images were taken from cross sections 0.5 to 1 mm below the initial cube surfaces. SEM images of unmodified cell walls are provided as reference (Fig. 5C and D). During the reaction process, wood cubes are soaked in the reaction solution; therefore polymerization in the cell lumen cannot be avoided. Although a large amount of unbound polymer chains is extracted upon washes with acetone, SEM images show that some cells are still partially or fully filled with polymer residues (Fig. 5A and B).
image file: c4ra00741g-f5.tif
Fig. 5 SEM images of microtomed cross-sections. (A) and (B): fully modified wood (St3). (C) and (D): unmodified, reference spruce wood.

The repartition of polystyrene between cell wall and lumen area could be estimated through a semi-quantitative method based on SEM image analysis and measured polymer weight gain. Details about the calculation are given in the ESI (Fig. S5). Based on the assumption that polymerization does not take place in the cell walls of the polystyrene samples without pre-treatment (St), we calculated the following cell wall loading for the other experiments: St1 1.3%, St2 17.6%, and St3 22.7%.

These results correlate well with the initial tosyl content in wood (WPG1), and support our hypothesis that tosylation enhances penetration of styrene in the second step of the modification, and consequently allows for higher polymer loading.

Besides the presence of polymer within cell lumina, SEM pictures reveal that the modification process does not damage the overall wood structure, leaving well defined cells, without noticeable destruction.

Improved wood properties

Water uptake and swelling upon water sorption were measured using the water-soaking method developed by Rowell et al.21 This method is based on subsequent cycles of drying and wetting, and is particularly efficient to assess the stability of the treatment, to estimate the water repellence (or water uptake), and to measure the dimensional change of wood in response to water sorption.
Water repellence. The results (after the first and second cycles) in Fig. 6 show that for all modification treatments (i.e. Ts1, Ts2, St, St1, St2, and St3) the water uptake was reduced to some extent when compared to reference wood. As expected, the tosylation step already makes wood more hydrophobic, and the water repellence efficiency correlates with the degree of hydroxyl functionalization (a trend illustrated by the water uptakes for Ts1 and Ts2 experiments).
image file: c4ra00741g-f6.tif
Fig. 6 Left: water uptake values for unmodified wood (Ref), tosylated wood (Ts1, Ts2), and modified wood (St, St1, St2, and St3). Right: equilibrium moisture content (EMC) values of reference, tosylated, and modified samples.

According to the graph, all treatments with polystyrene have enhanced hydrophobic properties when compared to both unmodified and tosylated wood: after five days in water, unmodified wood gained about 160% water, while all wood–polystyrene composites only gain about 70%. Wood samples with polystyrene in lumen only (St experiment) also show a clear reduction in water uptake similar to St3 in the first water-soaking cycle. It is well known that lumen filling by polymers decreases the space available for water, blocks cell cavities and consequently retards or avoids water entrance into the cell walls.30–32 Interestingly, after the first drying cycle better results are achieved with wood samples combining activation with tosyl and subsequent polymerization (namely St1, St2, and St3 experiments): those samples have higher polymer contents in the cell walls, which further reduces the space available for water molecules. The significant differences of water uptake between cycle 1 and cycle 2 for pre-treated and polymerized samples (St1, St2, and St3) may be explained by a re-organization of the polystyrene chains inside the cell walls during the first drying in a way that polymers further occupy the nanovoids (Fig. 6). As stated in the experimental part, wood cubes were dried at 65 °C after the chemical treatment, but at 103 °C during the water uptake experiments. The glass transition temperature (Tg) of pure polystyrene is around 100 °C (depending on the molecular weight).33 Therefore, during the drying step for the water uptake measurements, polystyrene chains may flow freely within the wood cell wall and re-organization and additional filling of nanovoids can take place.

Equilibrium moisture content (EMC) measurements of tosylated and modified samples at room temperature and at a relative humidity of 75% also reflect the improved hydrophobic character of treated samples (Fig. 6). In such conditions, reference wood had an EMC of 14.3%. All modified samples adsorb less moisture with a minimum of 9.9% and 8.8% for St2 and St3 experiments respectively, which means that humidity adsorption of St3 is almost 40% reduced (and 31% for St2).

Dimensional stability. We looked at the swelling and shrinkage behaviour of the wood cubes upon soaking–drying cycles, from which we can calculate volumetric swelling coefficient (S) and anti-swelling efficiency (ASE) according to the equations given in ESI (Fig. S2). Swelling and anti-swelling efficiency are basic quantities that reflect improvements in terms of dimensional stability of wood based materials. The average volumetric swelling values of the different treatments after the water-soaking cycles, and the anti-swelling efficiency values can be seen in Fig. 7. The swelling coefficient is directly related to volume changes during water uptake–drying cycles: a low swelling value corresponds to high dimensional stability.
image file: c4ra00741g-f7.tif
Fig. 7 Left: average swelling values from the first immersion cycle. Right: anti-swelling efficiency values for tosylated wood (Ts1, Ts2), and treated wood (St, St1, St2, and St3) from the first immersion cycle.

ASE compares the swelling of untreated wood to the swelling of modified samples: a high ASE value means high dimensional stability (see ESI for equations). In accordance with the water uptake results, the tosylation step (Ts2) already provides some anti-swelling efficiency (Fig. 7). The samples of experiment Ts2 (high WPG1) show ASE values around 15%, whereas Ts1 (low WPG1) samples present negative values (−15%). This negative value may be explained by the rearrangements of the cell wall polymer during the solvent impregnation, which make the cell wall more accessible to water, and which is not compensated by the reduction of the –OH functionalities. The shrinkage of the Ts1 samples directly after reaction reported in Table 1 also supports this hypothesis.

The best ASE was observed with St3 samples (which have the highest WPG, and presented the most significant bulking effect after treatment) with values around 25% after first water immersion cycle, which represents a significant improvement. Cell wall modifications that exclusively lead to cell lumen filling and fail in modifying the cell wall itself have limited efficiency. This is clearly shown by the negative ASE value observed for the St sample set, where the polymer is found in lumen only. The difference between the ASE values of St2 and St3 suggests that the total polymer content in the cell wall plays an important role on the final properties.

Nanomechanical properties of cell walls. Mechanical properties of reference, tosylated (Ts2) and modified (St3) cell walls were investigated by nanoindentation. Both hardness and indentation modulus showed a significant (P < 0.001, U-test) increase of about 17% and 12% respectively from the unmodified cell walls to modified cell walls (Fig. 8). Further, the tosylated cell walls show the highest increase in hardness and indentation modulus, with values of about 30% and 13%, respectively. However, we assume that this could be a result of embedding material diffusion inside the cell walls.
image file: c4ra00741g-f8.tif
Fig. 8 (a) Hardness and (b) indentation modulus of unmodified, tosylated (Ts2), and modified cell walls (St3). (c) AFM images of indented cell walls (from top bottom: reference, tosylated, and modified cell walls).

Conclusions

In this work, a series of composites of spruce bulk wood and polystyrene were produced with different pre-treatments (no tosylation, low weight gain tosylation and high weight gain tosylation). We demonstrated that the diffusion of hydrophobic monomers into the cell walls and their polymerization was significantly enhanced with the pre-functionalization of hydroxyl groups, resulting in an efficient cell wall bulking. The method uses mild conditions (i.e. the wood retains its mechanical properties) and yields new wood materials with limited weight gain and improved properties: both dimensional stability and hydrophobicity are increased. Such improvements are highly desirable and will help promoting the use of wood as a material from renewable resources with more reliable properties.

Acknowledgements

We thank the Max Planck Society, Germany as well as the Bundesamt für Umwelt (BAFU) and Lignum, Switzerland for providing financial support. The study is embedded in the SNF NRP66 project: Improved wood materials for structures.

Notes and references

  1. D. Feldman, J. Polym. Sci., Polym. Lett. Ed., 1985, 23, 601–602 Search PubMed .
  2. C. A. S. Hill, Wood Modification: Chemical, Thermal and Other Processes, John Wiley & Sons Ltd., Chichester, 2006 Search PubMed .
  3. R. M. Rowell, Handbook of Wood Chemistry and Wood Composites, CRC Press, Boca Raton, 2nd edn, 2012 Search PubMed .
  4. S. Lande, M. Eikenes, M. Westin and H. Schneider Marc, in Development of Commercial Wood Preservatives, American Chemical Society, 2008, vol. 982, pp. 337–355 Search PubMed .
  5. C. Mai and H. Militz, Wood Sci. Technol., 2004, 37, 339–348 CrossRef CAS PubMed .
  6. C. Mai and H. Militz, Wood Sci. Technol., 2004, 37, 453–461 CAS .
  7. C. Zollfrank, Wood Sci. Technol., 2001, 35, 183–189 CrossRef CAS .
  8. R. M. Rowell, A.-M. Tillman and R. Simonson, J. Wood Chem. Technol., 1986, 6, 427–448 CrossRef CAS .
  9. R. M. Rowell, For. Prod. J., 2006, 56, 4–12 CAS .
  10. J. Stamm Alfred, in Wood Technology: Chemical Aspects, American Chemical Society, 1977, vol. 43, pp. 115–140 Search PubMed .
  11. E. L. Ellwood, R. C. Gilmore and A. J. Stamm, Wood Sci. Technol., 1972, 4, 137–141 CAS .
  12. A. J. Stamm, Wood and cellulose science, Ronald Press Co., New York, 1964 Search PubMed .
  13. S. Bach, M. N. Belgacem and A. Gandini, Holzforschung, 2005, 59, 389 CrossRef CAS .
  14. R. Devi and T. Maji, Wood Sci. Technol., 2012, 46, 299–315 CAS .
  15. W. Gindl, F. Zargar-Yaghubi and R. Wimmer, Bioresour. Technol., 2003, 87, 325–330 CrossRef CAS .
  16. R. E. Ibach and R. M. Rowell, Holzforschung, 2001, 55, 358 CAS .
  17. W. L. E. Magalhães and R. R. da Silva, J. Appl. Polym. Sci., 2004, 91, 1763–1769 Search PubMed .
  18. Y. Zhang, S. Y. Zhang, D. Q. Yang and H. Wan, J. Appl. Polym. Sci., 2006, 102, 5085–5094 CrossRef CAS .
  19. M. G. S. Yap, L. H. L. Chia and S. H. Teoh, J. Wood Chem. Technol., 1990, 10, 1–19 CrossRef CAS .
  20. M. A. Ermeydan, E. Cabane, A. Masic, J. Koetz and I. Burgert, ACS Appl. Mater. Interfaces, 2012, 4, 5782–5789 CAS .
  21. R. Rowell and W. Ellis, Wood Fiber Sci., 1978, 10, 104–111 CAS .
  22. G. I. Mantanis, R. A. Young and R. M. Rowell, Wood Sci. Technol., 1994, 28, 119–134 CAS .
  23. T. Furuno, Y. Imamura and H. Kajita, Wood Sci. Technol., 2003, 37, 349–361 Search PubMed .
  24. M. Morita and I. Sakata, Wood Sci. Technol., 1991, 25, 215–224 CAS .
  25. N. Gierlinger, C. Hansmann, T. Röder, H. Sixta, W. Gindl and R. Wimmer, Holzforschung, 2005, 59, 210–213 CrossRef CAS .
  26. N. Gierlinger, T. Keplinger and M. Harrington, Nat. Protoc., 2012, 7, 1694–1708 CAS .
  27. N. Gierlinger and M. Schwanninger, Spectroscopy, 2007, 21, 69–89 CAS .
  28. W. H. Tsai, F. J. Boerio, S. J. Clarson, E. E. Parsonage and M. Tirrell, Macromolecules, 1991, 24, 2538–2545 CrossRef CAS .
  29. N. S. Ham and A. N. Hambly, Aust. J. Chem., 1953, 6, 135–142 CrossRef CAS .
  30. E. Baysal, A. Sonmez, M. Colak and H. Toker, Bioresour. Technol., 2006, 97, 2271–2279 CAS .
  31. R. R. Devi, I. Ali and T. K. Maji, Bioresour. Technol., 2003, 88, 185–188 CrossRef CAS .
  32. M. H. Schneider, K. I. Brebner and I. D. Hartley, Wood Fiber Sci., 1991, 23, 165–172 CAS .
  33. J. Rieger, J. Therm. Anal., 1996, 46, 965–972 CrossRef CAS .

Footnote

Electronic supplementary information (ESI) available: Additional data and graphics, methods. See DOI: 10.1039/c4ra00741g

This journal is © The Royal Society of Chemistry 2014
Click here to see how this site uses Cookies. View our privacy policy here.