Lithium storage improvement from hierarchical double-shelled SnO2 hollow spheres

Shilong Jinga, Feng Gu*ab, Junhua Kongb, Chunrong Maa, Pooi See Lee*b and Chunzhong Li*a
aKey Laboratory for Ultrafine Materials of Ministry of Education, School of Materials Science and Engineering, East China University of Science and Technology, 130 Meilong Road, Shanghai 200237, China. E-mail: czli@ecust.edu.cn; Fax: +86 21 64250624; Tel: +86 21 64252055
bSchool of Materials Science and Engineering, Nanyang Technological University, 50 Nanyang Avenue, Singapore 639798. E-mail: pslee@ntu.edu.sg; gufeng@ecust.edu.cn

Received 23rd January 2014 , Accepted 3rd February 2014

First published on 11th February 2014


Abstract

We have developed hierarchical double-shelled SnO2 hollow spheres by a sequential template-engaged method, in which the loosened SnO2 floccules are well-grown on the inside wall of the hollow spheres. The unique hierarchical structure could provide more active sites for Li–Sn alloying–dealloying reaction and fast insertion/extraction of Li+ ion with superb conductivity, helping to store more lithium (2578 mA h g−1) with great cycling stability.

Li-ion batteries (LIB) have attracted considerable interest as one of the dominant power sources for portable electronic devices due to their superior properties such as high energy density, long cycle life, no memory effect and environmental friendliness. To meet the growing need for higher capacity, tremendous efforts have been focused on developing alternative high-performance electrode materials for next generation LIBs, especially metal oxides due to their high theoretical capacitance, natural abundance and low cost.

SnO2 has a high theoretical capacity of 782 mA h g−1, more than twice that of the current used graphite (370 mA h g−1).1,2 However, upon lithium insertion/extraction within SnO2, large and uneven volume change would result in electrode pulverization and electrical connectivity failure.3 Hollow structures have been exploited to effectively to mitigate this problem due to the enhanced kinetics and structural stability for lithium storage.4–16 The interior space allows volume variation upon insertion/extraction of lithium ions to be better accommodated and thus leads to improved cycling stability. Recently, considerable efforts have been devoted to the fabrication of SnO2 hollow structures such as hollow nanospheres and nanoboxes based on the soft-/hard-template methods.17–21 The shell of the hollow structures has been constructed precisely, hoping to form permeable thin walls to make lithium ion diffusion much easier by shortening the diffusion length. It should be noted that the interior space is particularly worthy to being further explored by filling with appropriate active materials to improve Li+ ion storage capacity without impairing the electrode stability. For example, hollow core–shell mesospheres of crystalline SnO2 nanoparticles developed by Deng et al. demonstrated very high Li+ storage capacities and improved electrochemical characteristics when used as the anode material in lithium ion test batteries.22 The experimental values for the first-cycle discharge and charge capacities were 2358 and 1303 mA h g−1, respectively, and kept nearly 800 mA h g−1 at the end of the 30th cycle. It has been reported that SnO2 particles with mesoporous structure exhibit enhanced electrochemical properties in comparison with its bulk counterpart.23 It can be expected that mesoporous SnO2 would be particularly beneficial for the overall lithium storage capacity after being sealed inside. Herein, we described a facile template-engaged method to grow SnO2 loose floccules (LAs) on the inner surface of SnO2 hollow spheres (CH–SnO2) to form hierarchical double-shelled SnO2 hollow spheres to further improve the overall lithium storage capacity without impairing the structural stability. Due to their larger surface areas and larger number of lithium-storage sites, CH–SnO2 exhibits improved electrochemical properties when evaluated as anode materials in LIBs.

Scheme 1 illustrates the typical sequential template-engaged procedures for the synthesis of CH–SnO2 hierarchical structures. SnO2 nano-size floccules were firstly formed inside the channels of mesoporous silica (MS) based on hydrolysis of potassium stannate. Subsequently, SnO2-filled MS was used as template for the further deposition of SnO2 layer on the outer surface of MS by further hydrolysis process. After the silica removal process, hierarchical loose floccules-encapsulated spherical SnO2 hollow structure was obtained. Corresponding TEM images (Fig. S1) and more experimental details are provided in ESI.


image file: c4ra00690a-s1.tif
Scheme 1 Schematic illustration of the experimental procedure for the hierarchical double-shelled SnO2 hollow spheres.

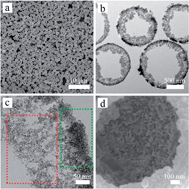
The charged surface of MS determines the initial nucleation and confined growth owing to the electrostatic adsorption and the homogeneous nucleation could be suppressed totally during the hydrolysis reaction. The first hydrothermal process would lead to the formation of SnO2 nano-size floccules within the channels with a very small size of the crystalline domains of ∼2 nm, as derived from the HRTEM and the peak broadening in the XRD patterns shown in Fig. S2. After the secondly hydrolysis and template removal processes, electron microscopy demonstrates obvious evidence that the hollow structure is highly hierarchical with mesoporous network that attaching to the inner surface of the dense shell (Fig. 1b and c). The shell was constructed by small nanoparticles and the shell thickness is about 100 nm. In virtue of the unique hollow structure and small crystallite size, the CH–SnO2 particles possess a relatively large Brunauer–Emmett–Teller (BET) surface area of around 134 m2 g−1. From a broken CH–SnO2 particle chosen randomly (Fig. 1d), it is clear that a fluffy layer could be observed on the inner surface of the shell. For comparison, hollow SnO2 spheres without loose layer inside (H–SnO2) derived directly from hydrolysis reaction taken solid silica sphere as template showed a rather smooth inner surface (Fig. S3).24 Due to this special configuration, much better structural stability will be granted with consequently buffering the pulverization while increasing specific capacity of electrode when used as anode materials in LIBs.


image file: c4ra00690a-f1.tif
Fig. 1 (a and b) SEM and cross-sectional TEM image of CH–SnO2 particles. (c) HRTEM image showing the hierarchical double-shelled structure. (d) Selected SEM image of a broken CH–SnO2.

Under the secondary hydrolysis process, the MS templates may act as the aggregation centers for the primary SnO2 nanocrystals in view of the minimization of interfacial energy. However, excessive fast hydrolysis will be expected to cause formation of abundant irregular impurities inevitably and the secondary hydrolysis processes have to be controlled precisely when allowing the structure and morphology of the CH–SnO2 particle being rationally controlled. Therefore, a proper concentration of precursor (potassium stannate) solution should be introduced into the reaction system to slow down the hydrolysis of Sn4+ so that nanoscale deposition can occur preferentially on the accessible surface of templates to construct conformal shells. In this work, the tin precursor concentration is optimized to be 8 mM in case of templates concentration of 4.2 mg ml−1, ensuring the precipitation of SnO2 to take place at an appropriate rate. When the precursor concentration is insufficient (4 mM) or excessive (16 mM), aggregated SnO2 particles and nodules-decorated spherical structures instead of conformal shells would be formed (Fig. S4). The latter could be attributed to the occurrence of homogeneous nucleation with the formation of SnO2 nanocrystals in the system due to the excess precursor. Driven by energy minimization, the formed primary SnO2 crystals may aggregate into bigger nanoparticles of ∼200 nm, and then attached to SnO2 shells through rotations caused by various interactions such as Brownian motion.

The electrochemical performances were evaluated by galvanostatic measurement. Fig. 2a shows the first and second cycle charge–discharge voltage profiles for the CH–SnO2 and H–SnO2 samples at 100 mA g−1 within a cutoff window of 0.005–2 V. Two slope regions can be identified in the discharge process of the first cycle, which are in good agreement with those of SnO2-based anodes, indicating the same electrochemical pathway. For CH–SnO2, the discharge and charge capacities for the first cycle were estimated to be 1885 and 1028 mA h g−1, respectively (Fig. 2a). Such a high initial lithium storage capacity might be associated with the unique hierarchical structure with mesoporous network comprised by nano-size floccules. Compared with other hollow structures such as SnO2 hollow nanosphere reported by Ding et al. and hollow core–shell mesospheres of crystalline SnO2 nanoparticles by Deng et al., our results show better performance.18,22 The apparently large disparity between charge and discharge capacities in the first cycle mainly ascribes to the initial irreversible formation of Li2O, and other irreversible processes such as trapping of some Li+ in SnO2 LAs inside of the shells and electrolyte decomposition.2,25–28


image file: c4ra00690a-f2.tif
Fig. 2 (a) Charge–discharge profiles of HC–SnO2 and H–SnO2. (b) The discharge capacities as a function of cycle numbers for CH–SnO2 and H–SnO2 at 100 mA g−1 and 5 mV–2 V.

Compared to H–SnO2, CH–SnO2 showed a sharp increase in Coulombic efficiency, from 52.4% to 94.5% after 3 cycles. From the second cycle onward, the capacity fades gradually to about 500 mA h g−1 over 50 cycles (Fig. 2b), which is much higher than the theoretical capacity of graphite. At the same discharge/charge rate (100 mA g−1), it is clear that the initial discharge and charge capacities of H–SnO2 are 1192 mA h g−1 and 739 mA h g−1, respectively, much lower than the performance of CH–SnO2. The specific discharge capacity at the end of the 50th cycle is 347 mA h g−1, nearly 70% to the value of CH–SnO2. Due to the equal mass of loose floccules network inside and SnO2 shell, the first-time discharge and charge capacities derived from the SnO2 LAs network are estimated to be as high as 2578 and 1317 mA h g−1, respectively (calculation section in ESI). Such high capacity improvement could be ascribed to the contribution of the mesoporous structure of the filled loose floccules: size in nanometer scale enables more active sites and solid attachment for super conductivity. The filled SnO2 LAs could accommodate Li+ more easily, and this would be strengthened after resistance was decreased more over by converting semiconducting SnO2 into metallic Sn and forming LixSn alloys with Li. To further investigate stability of the hierarchical double-shelled structure, the electrode (without any removing of carbon black or PVDF) after 50 cycles has been examined. Although most of the CH–SnO2 had expanded and some of them had collapsed with noticeable aggregation of SnO2 nanoparticle floccules (Fig. S3-c), there were still unbroken spheres retained. The extended shadow (Fig. S3-d), compared to TEM images before cycles (Fig. S1-d), has clearly showed how intense was the electrochemical process during cycles.

The lithium insertion/extraction process in the CH–SnO2 samples were further analyzed through cyclic voltammograms (CVs) at a scan rate of 5 mV s−1 in the potential range from 2.5 V to 0.005 V. As shown in Fig. 3a, three reduction peaks can be observed around 1.67, 1.23, 0.67 V, respectively, in the initial cathodic side. These peaks can be ascribed to the formation of the solid electrolyte interphase (SEI), the decomposition of SnO2 to Sn and Li2O nanocomposites, and finally the alloying reaction between Sn and Li, respectively. The first two reactions are irreversible and responsible for the large irreversible capacity of the first cycle. In the anodic side, one peak is observed at 0.68 V, indicating the highly reversible dealloying reaction of Li–Sn alloys. Another oxidation peak around 1.54 V is also observed for the CH–SnO2, which is most likely due to the partial deformation of Li2O.29,30 Moreover, the CV curves increase in peak intensities in the first few cycles, suggesting the alloying of Li with Sn is gradual.


image file: c4ra00690a-f3.tif
Fig. 3 (a) Cyclic voltammograms of HC–SnO2 at the first 3 cycles. (b) Nyquist plots obtained from the impedance spectroscopy of HC–SnO2 before and after cycling for 50 cycles. AC voltage, 5 mV amplitude. Frequency range, 10 mHz to 100 kHz.

As the EIS results shown in Fig. 3b, the resistance of HC–SnO2 was not very large even after 50 cycles. The increase of initial interfacial resistance (first semi-circle at high to middle frequency) and charge transfer resistance (second semi-circle or inclined line at middle to low frequency) could partially result from the formation of solid electrolyte interphase (SEI) and iterative lithium insertion/extraction. This is consistent with other reports.30

In summary, hierarchical loose floccules-encapsulated SnO2 hollow spheres were prepared based on a facile sequential template-engaged method. This novel hierarchical structure exhibits a great improvement in electrochemical performance as an anode material for LIBs, such as higher capacity and good cycle performance in comparison with pure SnO2 hollow spheres. The nano-size loose network inside would provide more active sites for Li–Sn alloying–dealloying reaction and fast insertion/extraction of Li+ ion with superb conductivity, helping the hierarchical structure to store more lithium with great cycling stability, thereby, a prominent Li+ ion storage capacity improvement was exhibited. This loose structure filling strategy has helped to enhance the performance of hollow structure remarkbly. The route could also be extended to prepare other metal oxide materials, which would have various applications in realms like energy storage, sensing and catalysis, to provide great performance.

Notes and references

  1. Y. Idota, T. Kubota, A. Matsufuji, Y. Maekawa and T. Miyasaka, Science, 1997, 276, 1395–1397 CrossRef CAS.
  2. X. Lou, Y. Wang, C. Yuan, J. Lee and L. Archer, Adv. Mater., 2006, 18, 2325–2329 CrossRef CAS.
  3. Y. Xu, J. Guo and C. Wang, J. Mater. Chem., 2012, 22, 9562–9567 RSC.
  4. V. Juttukonda, R. L. Paddock, J. E. Raymond, D. Denomme, A. E. Richardson, L. E. Slusher and B. D. Fahlman, J. Am. Chem. Soc., 2006, 128, 420–421 CrossRef CAS PubMed.
  5. H.-J. Ahn, H.-C. Choi, K.-W. Park, S.-B. Kim and Y.-E. Sung, J. Phys. Chem. B, 2004, 108, 9815–9820 CrossRef CAS.
  6. J. Ba, J. Polleux, M. Antonietti and M. Niederberger, Adv. Mater., 2005, 17, 2509–2512 CrossRef CAS.
  7. Y. Wang, X. Jiang and Y. Xia, J. Am. Chem. Soc., 2003, 125, 16176–16177 CrossRef CAS PubMed.
  8. B. Cheng, J. M. Russell, W. Shi, L. Zhang and E. T. Samulski, J. Am. Chem. Soc., 2004, 126, 5972–5973 CrossRef CAS PubMed.
  9. L. Vayssieres and M. Graetzel, Angew. Chem., Int. Ed., 2004, 43, 3666–3670 CrossRef CAS PubMed.
  10. Z. W. Pan, Science, 2001, 291, 1947–1949 CrossRef CAS PubMed.
  11. X. Wu, S. Zhang, L. Wang, Z. Du, H. Fang, Y. Ling and Z. Huang, J. Mater. Chem., 2012, 22, 11151–11158 RSC.
  12. L. Zhao, M. Yosef, M. Steinhart, P. Göring, H. Hofmeister, U. Gösele and S. Schlecht, Angew. Chem., Int. Ed., 2006, 45, 311–315 CrossRef CAS PubMed.
  13. Z. R. Dai, Z. W. Pan and Z. L. Wang, J. Am. Chem. Soc., 2002, 124, 8673–8680 CrossRef CAS PubMed.
  14. H. G. Yang and H. C. Zeng, Angew. Chem., Int. Ed., 2004, 43, 5930–5933 CrossRef CAS PubMed.
  15. Z. Zhong, Y.-D. Yin, B. Gates and Y. Xia, Adv. Mater., 2000, 12, 206–209 CrossRef CAS.
  16. W. Shao, Z. Wang, Y. Zhang, J. Cui, W. Yu and Y. Qian, Chem. Lett., 2005, 34, 556–557 CrossRef CAS.
  17. S. Han, B. Jang, T. Kim, S. M. Oh and T. Hyeon, Adv. Funct. Mater., 2005, 15, 1845–1850 CrossRef CAS.
  18. S. Ding, J. S. Chen, G. Qi, X. Duan, Z. Wang, E. P. Giannelis, L. A. Archer and X. W. Lou, J. Am. Chem. Soc., 2010, 133, 21–23 CrossRef PubMed.
  19. P. Wu, N. Du, H. Zhang, C. Zhai and D. Yang, ACS Appl. Mater. Interfaces, 2011, 3, 1946–1952 CAS.
  20. Z. Wang, D. Luan, F. Y. C. Boey and X. W. Lou, J. Am. Chem. Soc., 2011, 133, 4738–4741 CrossRef CAS PubMed.
  21. Y. Liu, J. Dong and M. Liu, Adv. Mater., 2004, 16, 353–356 CrossRef CAS.
  22. D. Deng and J. Y. Lee, Chem. Mater., 2008, 20, 1841–1846 CrossRef CAS.
  23. S. Yang, W. Yue, J. Zhu, Y. Ren and X. Yang, Adv. Funct. Mater., 2013, 23, 3570–3576 CrossRef CAS.
  24. W. Stober, A. Fink and E. Bohn, J. Colloid Interface Sci., 1968, 26, 62–69 CrossRef.
  25. K. T. Lee, Y. S. Jung and S. M. Oh, J. Am. Chem. Soc., 2003, 125, 5652–5653 CrossRef CAS PubMed.
  26. J. Ye, H. Zhang, R. Yang, X. Li and L. Qi, Small, 2010, 6, 296–306 CrossRef CAS PubMed.
  27. Y. Shi, B. Guo, S. A. Corr, Q. Shi, Y.-S. Hu, K. R. Heier, L. Chen, R. Seshadri and G. D. Stucky, Nano Lett., 2009, 9, 4215–4220 CrossRef CAS PubMed.
  28. M.-S. Park, G.-X. Wang, Y.-M. Kang, D. Wexler, S.-X. Dou and H.-K. Liu, Angew. Chem., 2007, 119, 764–767 CrossRef.
  29. G. Xia, N. Li, D. Li, R. Liu, N. Xiao and D. Tian, Mater. Lett., 2011, 65, 3377–3379 CrossRef CAS PubMed.
  30. J. Kong, Z. Liu, Z. Yang, H. R. Tan, S. Xiong, S. Y. Wong, X. Li and X. Lu, Nanoscale, 2012, 4, 525–530 RSC.

Footnote

Electronic supplementary information (ESI) available: Experimental procedures, BET, EDS patterns, XRD patterns, TEM images and SEM images. See DOI: 10.1039/c4ra00690a

This journal is © The Royal Society of Chemistry 2014
Click here to see how this site uses Cookies. View our privacy policy here.