Xiao-Hui Guana,
Peng Qua,
Xin Guanb and
Guang-Sheng Wang*b
aSchool of Chemical Engineering, Northeast Dianli University, Jilin 132000, PR China
bKey Laboratory of Bio-Inspired Smart Interfacial Science and Technology of Ministry of Education, School of Chemistry and Environment, Beihang University, Beijing 100191, PR China. E-mail: wanggsh@buaa.edu.cn
First published on 17th March 2014
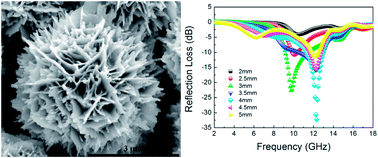
A series of CuS/ZnS nanocomposites (CZS) with a novel 3D hierarchical structure were obtained by a simple hydrothermal method. The effects of Zn2+ content, surfactant, reaction temperature and time on the morphology of the samples was studied. The products were characterized in detail and their photocatalytic performance in the degradation of methylene blue (MB) and microwave absorption properties as an absorber were also investigated. The results indicate that CZS0.4 presented an outstanding photocatalytic degradation rate of more than 97% for MB in the first twenty minutes, and MB was degraded almost completely in the presence of each of the six samples alone 70 minutes after photocatalytic reaction. CZS0.3 exhibited excellent microwave absorption properties, presenting a reflection loss as much as −22.6 dB at 9.7 GHz with a thickness of 3 mm, which is much better than that of pure CuS.
Scarcity and misuse of fresh water pose a serious and growing threat to sustainable global industrial development and protection of ecosystems and the environment in the 21st century, requiring more effective management of water and land resources. Waste water from industrial and agricultural sectors contains many toxic compounds such as dyes from textiles, humin and fatty acids from oil seed pressing and insecticides such as cypermethrin from the seafood industry, which lead to vast quantities of persistent chemical pollutants in the environment.4 Photocatalytic water depollution is considered as an attractive eco-friendly method to remove such organic contamination,32,33 which would facilitate a cost-effective technology for water treatment within sectors such as the seafood industry if operated under solar radiation. However, the design of efficient photocatalysts that absorb with high efficiency over the this energy range remains challenging. Recently, metal sulfides have been extensively studied in photocatalysis due to their suitable bandgap and catalytic function. In particular, ZnS is generally recognized as an effective photocatalyst due to its rapid generation and separation of electron–hole pairs upon photoexcitation, thus presenting dramatic photocatalytic efficiency,5,6 but its bandgap (3.66 eV) is too large to utilize visible light that accounts for 43 percent of solar energy.7 In contrast, copper sulfides possess a suitable bandgap (1.2–2.0 eV) for visible light response. There are five stable CuxS phases, and the stoichiometric factor x in CuxS varies in a wide range between 1 and 2, accompanied by diverse bandgaps and structures.8,9 Among them, covellite copper sulfide (CuS) is more intriguing since it presents an extra absorption band in the NIR,9,10 and maintains transmittance in the infrared and exhibits low reflectance in the visible and relatively high reflectance in the near-infrared region. Thus, the combination of ZnS and CuS will provide extensive absorption range and enhanced absorption of the solar spectrum.11 In addition, the heterostructure of composites is beneficial for photocatalysis according to IFCT (interfacial charge transfer) mechanism reported by Zhang.12 Therefore, CuS/ZnS nanocomposites will be a promising option for photocatalysis owing to the enhanced properties.
In addition, electromagnetic wave pollution caused by the extensive utilization of microwave irradiation in modern society leads to the interference of the operation of electric devices and does harm to human health.34–36 Therefore an increasing interest has been given to the materials that can absorb electromagnetic waves.37–40 These materials will bring about promising application in antielectromagnetic interference coatings, microwave darkrooms and stealth technology of aircraft.13 A large number of nanomaterials absorbing microwaves with specific morphology have been reported, including carbon nanotubes,14 Fe, Fe3O4, or TiO2 encapsulated within carbon nanocomposites,15 CdS/Fe2O3 with heterostructures,16 CuS-nanocomposite.3,17,18 Since the integration of heteroatom can enhance the microwave absorption properties,19 CuS/ZnS nanocomposites will be a promising candidate for microwave absorption. However, to the best of our knowledge, there are no reports about the microwave absorption performance of CuS/ZnS nanocomposites.
In this paper, we present a series of CuS/ZnS microspheres with novel hierarchical morphology synthesized by a simple hydrothermal process, and the effect of the preparation conditions on the morphology was studied. The microwave absorption properties and the photocatalytic performance in the decomposition of methylene blue (MB) were investigated based on the Zn2+ content of the nanocomposites. And the enhanced properties were also explained in detail.
The products consisted of Cu, Zn and S element and these elements were homogeneously distributed throughout the microspheres as shown in Fig. 2 and Fig. 3. These further demonstrated the formation of CZS, which was consistent with the XRD patterns. The Zn atom concentration in our samples increased at first, and then dropped with the increase of the molar ratio of Zn2+ to Cu2+ during the synthesis, reaching a maximum of 24.83% for CZS0.4, as listed in Table S1.†
A general SEM overview of the products is shown in Fig. 4. The products were mostly microspheres with hierarchical structure and with an average diameter of about 3 μm. They consisted of nanoplates and crystallized well with a crystal nature similar to that of hexagonal CuS crystals41 as revealed in Fig. 6c. This morphology is novel and far more regular than those of the ZnS/CuS nanocomposites reported by Anuja et al.22 Wei et al.23 Yu,11 Mehdi,20 Zahra,24 Yildirim.21,25 The assembling unit, the nanoplate became thicker and the microspheres seemed more irregular with the increase of Zn2+ content added, indicating that the amount of Zn2+ has a great impact on the morphology of the products.
![]() | ||
Fig. 5 SEM images of CZS0 prepared at different CTAB content and different temperature (a) 0.5 mmol; (b) 1.5 mmol; (c) 2.0 mmol; (d) 180 °C; (e) 130 °C; (f) 100 °C. |
![]() | ||
Fig. 6 SEM images of CZS0 obtained in the presence of (a) ethanol; (b) ethylene glycol; (c) TEM image and SAED pattern of CZS0.3; SEM images of CZS0 prepared at 150 °C for (d) 4 h; (e) 8 h; (f) 12 h. |
CZS0 was synthesized under different preparation conditions to study the relationship between these parameters and morphology. The optimized reaction conditions to synthesize hierarchical microspheres are: Cu(NO3)2·3H2O (3 mmol), CTAB (1 mmol) and thiourea (9 mmol) in 72 mL DI water in a 120 mL Teflon-lined stainless steel autoclave 150 °C for 24 h. Serious agglomeration took place and few microspheres were formed with 0.5 mmol CTAB added as shown in Fig. 5a. A large number of microspheres were formed in the presence of 1.5 mmol and 2.0 mmol CTAB respectively as shown in Fig. 5b and c, indicating that the amount of surfactant is one of the key factors involved in morphology control.
Temperature also plays a significant role in controlling the structure. Fig. 5d–f present the products synthesized at 180 °C, 130 °C and 100 °C respectively with other reaction conditions unchanged. The assembling unites of microspheres-nanoplates grew thicker and larger with the increase of temperature. The hierarchical structures of the products obtained at these temperatures were slightly different. The products prepared at 180 °C were less spherical and on some level agglomerated while those obtained at 130 °C and 100 °C were mostly spherical, but the products synthesized at 130 °C were urchin-like, and those obtained at 100 °C were rose-like.
Solvent led to the biggest morphology difference among the preparation conditions as revealed in Fig. 6a and b. The products synthesized with ethanol as solvent were mainly agglomerated at random and not spheres with hierarchical structure, but those prepared in the presence of ethylene glycol were microspheres assembled by nanoplates. Compared with the products obtained with DI water as solvent (Fig. 4a), the nanoplates that constituted microspheres in Fig. 6b were much thinner and the hierarchical structure was not that compact. It might be ascribed to the difference between the viscosity of the three solvents, which affects the diffusion velocity of the reactants such as Cu2+ and S2−.
CZS0 synthesized at 150 °C for different time are presented in Fig. 6d–f. One can observe that the number of the nanoplates constituting a microsphere and the thickness of a nanoplate grew larger with the increase of temperature.
A possible evolution of the 3D microspheres of CZS is proposed based on the investigation of the effect the reaction parameters have on the morphology of CZS0. CuS was first formed due to the great difference of solubility products (Ksp) of ZnS (1.6 × 10⁻²⁴) and CuS (6.3 × 10−36).11 CuS was formed through a typical Ostwald ripening process: the tiny crystalline nuclei in a supersaturated solution formed, followed by the crystal growth. The further crystal growth for CuS nanoplates was largely related to the hexagonal crystal structure of CuS. Then the nanoplates intersected with each other to form a microsphere. CTAB played an important role in the formation of hierarchical microspheres during the self-assembly process. The surfactant on the protective layer limited the size of the nanoparticles and protected them from further aggregation. And then ZnS was crystallized on the surface of CuS microspheres, which can be seen from the fact that the nanoplates constituting CZS0.4 are thicker and rougher than those of pure CuS (CZS0). The whole process can be described as in Scheme 1.
Fig. 7 shows the nitrogen adsorption–desorption isotherms of CZS0, CZS0.3 and CZS0.4. It can be seen that the adsorption for CZS0 was far higher than that for CZS0.3 and CZS0.4 at high relative pressure range (around 1.0). It indicates that CZS0 possessed a much larger Brunauer–Emmett–Teller (BET) surface area than CZS0.3 and CZS0.4, which is consistent with the results in Table S2.† This might be caused by the fact that as CuS nanoplates assembled into microspheres, ZnS crystallized onto the surface of the hierarchical structure of CuS microspheres, thus reducing the surface areas of CZS0.3 and CZS0.4.
The optical properties of the samples were studied by UV-Visible absorption spectra as shown in Fig. S1.† It can be observed that all the samples had broad absorption bands centered at between 620 nm and 670 nm in the visible light region. No absorption peak was observed for pure CuS (CZS0) in the ultraviolet region while small peaks shorter than 400 nm in the ultraviolet region appeared with the increase of Zn2+ concentration.
The catalytic performance of the products synthesized was evaluated by measuring the degradation of MB in aqueous solution under irradiation (250 nm < λ < 780 nm). The characteristic absorption peak of MB at λ = 663 nm was utilized to monitor the photocatalytic degradation reaction. The suspensions were obtained by adding 0.1 g of each sample we synthesized into MB aqueous solution (100 mL, 30 μg L−1), respectively. The suspension was sonicated for 10 minutes and then stirred for 40 minutes in the dark without any irradiation. 2 mL H2O2 (30%, w/w) was added into the suspension with stirring and irradiation was triggered using a 300 W Xe lamp placed 66 cm away from the reactor at room temperature, initiating the photocatalytic reaction. The absorbance of the mixture was measured at the same interval to evaluate the photocatalytic performance of the products. The whole photocatalytic procedure can be described as in Fig. S2.†
One can observe from Fig. 8 that the MB was almost never decomposed simply with H2O2 added in the first ten minutes, but H2O2 combining with CZS0.2, CZS0.3, CZS0.4 and CZS0.5 respectively exhibited such high MB degradation rates around 80% while the degradation rates of MB in the presence of CZS0.1 and CZS0 were not that high in the first ten minutes. In the first twenty minutes, the MB reacting only with H2O2 was decomposed less than 6% while H2O2 associated with each of the samples respectively except CZS0 led to the degradation rates as high as about 90%, and the highest one was over 97% for CZS0.4, which is far more effective than 81% after 2 h in the presence of CuS/rGO nanocomposites during the photocatalytic process reported by Zhang,26 demonstrating the outstanding photocatalytic performance. In contrast, the degradation rates of MB treated with the six samples we prepared without any irradiation were no more than 15% in the first ten minutes and less than 26% in the first twenty minutes as shown in Fig. S3,† indicating that the degradation of MB is basically photocatalytic. The MB was almost decomposed completely by photocatalysis, using each of the six as-synthesized products alone respectively as catalyst after 70 minutes. The MB solutions treated with H2O2 alone and treated with the combination of H2O2 and CZS0.4 after 70 minutes are presented in Fig. S4† respectively, which demonstrated the almost complete degradation of MB in the presence of CZS0.4.
![]() | ||
Fig. 8 Degradation rate for MB in the presence of only H2O2, CZS0 and H2O2, CZS0.1 and H2O2, CZS0.2 and H2O2, CZS0.3 and H2O2, CZS0.4 and H2O2, CZS0.5 and H2O2 respectively. |
As a whole, the samples presented better photocatalytic performance on MB with the increase of Zn content in the sample. CZS0.4, which possessed the largest Zn atom concentration among the samples as demonstrated in Table S1,† showed the best photocatalytic performance, indicating that the amount of Zn contained in the sample influenced the photocatalytic activity of the samples significantly, which might be attributed to the IFCT mechanism reported by Zhang12 and the hierarchical structure of the samples, which provides large quantities of active sites.
To the best of our knowledge, the microwave absorption properties of CZS have rarely been studied. Therefore, the microwave absorption properties of CZS were investigated. The specimens were prepared by uniformly mixing the samples (20 wt%) in a paraffin matrix. Fig. 9 shows the frequency dependence on the complex permittivity – the real part (ε′) and the imaginary part (ε′′) – of the mixture of CZS and paraffin wax. ε′ and ε′′ with several peaks for all samples can be observed. CZS0 possessed the highest ε′ among the samples. The ε′ and ε′′ for CZS0.3 exhibited obvious changes in the frequency range of 7–14 GHz compared with other five samples, indicating that the ε′ and ε′′ for CZS0.3 were sensitive to the frequency in this range.
![]() | ||
Fig. 9 (a) Real part ε′ (b) imaginary part ε′′ of the complex permittivity of the mixture of CZS and paraffin wax. |
The dielectric loss tangent tanσ (ε′′/ε′) (see Fig. S5†) was calculated based on the data in Fig. 9. One can observe that the dielectric loss for CZS0.3 increased rapidly at 8 GHz, and CZS0.3 exhibited a strong peak at about 11.5 GHz with a corresponding peak value 1.159, which was far higher than those of other samples which showed almost equal dielectric losses in the whole frequency range from 2 to 18 GHz. Since CZS0.3 possessed the largest Zn content among the samples, the increasing loading of Zn in the sample resulted in an enhancement of the dielectric loss, and this high dielectric loss might suggest the potential microwave absorption capacity of the hierarchical microspheres consisting of nanoplates (CZS0.3).
The theoretical reflection loss (RL) of the composite absorber at various thicknesses can be obtained through eqn (1) (ref. 27)
![]() | (1) |
Here, the input impedance (Zin) is given by eqn (2) (ref. 28)
![]() | (2) |
The relationship between the peak frequency, permeability and the thickness can be expressed by eqn (3) (ref. 29)
![]() | (3) |
Reflection losses for each sample with different thicknesses from 2 mm to 5 mm in the frequency range from 2 to 18 GHz were calculated as shown in Fig. S6.† Fig. 10 shows the calculated reflection loss of CZS with a thickness of 3 mm in the frequency range from 2 to 18 GHz. Pure CuS (CZS0) possessed some microwave absorption at 2–18 GHz due to its dielectric loss and a minimum reflection loss, only −12.1 dB at 8.8 GHz. As for CZS0.3, which contained the largest Zn content in the composite among CZS, a minimum of reflection loss as much as −22.6 dB at 9.7 GHz was obtained and the reflection loss exceeding −10 dB is in the range from 9.2 to 11.4 GHz, which was more than as twice as that of zinc oxide particles coated multiwalled carbon nanotubes reported by Song30 and close to that reported by He.17 It demonstrated that the reflection loss characteristics were sensitive to the heteroatom contents. Since all the samples were synthesized under the same conditions, it is reasonable to attribute the enhanced microwave absorption properties to the different chemical composition in microspheres, and the heteroatom integration plays a critical role in enhancing the microwave absorption.19 Moreover, these microspheres with hierarchical structure have large interface areas, which will increase the absorption points, resulting in the fact that microwave can be trapped by the hierarchical structure for long periods when microwave energy is transformed to heat energy or other forms of energy, and finally dissipate.31
![]() | ||
Fig. 10 Reflection loss (RL) curves for CZS with a thickness of 3 mm in the frequency range of 2–18 GHz. |
Footnote |
† Electronic supplementary information (ESI) available. See DOI: 10.1039/c4ra00659c |
This journal is © The Royal Society of Chemistry 2014 |