A high sensitive fluorescence turn-on probe for imaging Zn2+ in aqueous solution and living cells†
Ting-Ting Zhang‡
a,
Xin-Peng Chen‡b,
Jin-Ting Liu*a,
Liang-Zhong Zhanga,
Jia-Ming Chua,
Le Su*b and
Bao-Xiang Zhao*a
aSchool of Chemistry and Chemical Engineering, Shandong University, Jinan 250100, P.R. China. E-mail: jintliu@sdu.edu.cn; bxzhao@sdu.edu.cn
bSchool of Life Science, Shandong University, Jinan 250100, P.R. China. E-mail: sule@sdu.edu.cn
First published on 28th March 2014
Abstract
A new pyrazoline-based fluorescent probe was designed and synthesized. The probe can induce a 60-fold fluorescence enhancement after 5 equiv. of Zn2+ was added, which is superior to a previous report (13-fold), and exhibits high sensitivity and selectivity for response to Zn2+ in aqueous solution. The detection limit and association constant were calculated as 1.23 × 10⁻⁷ M and 3.89 × 10³ M−1 by a fluorescence titration experiment. The 1![[thin space (1/6-em)]](https://www.rsc.org/images/entities/char_2009.gif) :1 binding stoichiometry of L–Zn2+ complex was analysed by Job's plot. The probe showed good reversibility upon addition of EDTA or TPEN. Furthermore, the probe L showed good membrane permeability and can be applied to monitor Zn2+ ions in living HeLa cells.
:1 binding stoichiometry of L–Zn2+ complex was analysed by Job's plot. The probe showed good reversibility upon addition of EDTA or TPEN. Furthermore, the probe L showed good membrane permeability and can be applied to monitor Zn2+ ions in living HeLa cells.
Introduction
Zinc is the second most abundant transition metal in the human body after iron, and it has attracted much attention due to its biological significance. Zinc ion plays vital roles in numerous biological processes, such as muscle contraction,1 cellular metabolism,2 gene transcription, immune function, metallo enzyme function,3 DNA-binding proteins4 and so forth. In addition, the disorder of zinc homeostasis relates to some pathological processes, like Alzheimer's disease, epilepsy, ischemic stroke, and infantile diarrhea.5 Therefore, the quantification and qualification of zinc is of great importance in the biological or environmental systems.Fluorescence probes are powerful tools to monitor metal ions owing to their simplicity and high response speed, and have attracted considerable interest to apply in biological system with high selectivity and sensitivity.6 Up to now, a variety of fluorescent probes based on Schiff bases,7 BODIPY,8 terpyridine,9 quinoline,10 naphthalimide,11 nanoparticles,12 coumarin,13 bipyridine,14 TPEA(N,N,N′-tri(pyridine-2-ylmethyl)-ethane-1,2-diamine)15 and other fluorescein16 have been reported for detecting Zn2+. Although these probes can be used to detect zinc in vitro and in vivo, many fluorescent probes have disadvantages such as poor solubility in water, working in toxic solvents like acetonitrile, complicated preparation process, and have no better sensitivity or reversibility. Recently, pyrazoline derivatives have attracted much attention because of their excellent blue fluorescence property, the high fluorescence quantum yield and electroluminescence fields.17 A number of zinc probes based on pyrazoline have been reported.18
We have been attempting to develop fluorescence probe for monitoring metal ions.18a–d,19 In continuation with our previous work, we report a new and easily synthesized pyrazoline derivative which can induce prominent fluorescence enhancement upon complexation with Zn2+ in aqueous media, which is superior to previous reported.18b,d The excitation wavelength of the probe was 410 nm which is in the visible light region. The probe shows high sensitivity and selectivity for monitoring Zn2+ and can be applied to microscopic imaging Zn2+ in HeLa cells because of its good membrane-permeable property. We also performed the cell viability assay, and found the probe has no cytotoxicity to the cultured cell line under experimental conditions. In contrast with the previous work, present new probe make the test projects more perfect.
Results and discussion
Synthesis of the probe
The general synthetic route of compound 4 (probe L) is given in Scheme 1. The probe was easily synthesized by two steps. Chalcone 3, easily prepared from compound 1 and 2, reacted with hydrazine hydrate to afford the probe. The structure of the probe was characterized by IR, 1H NMR, 13C NMR and HRMS spectra.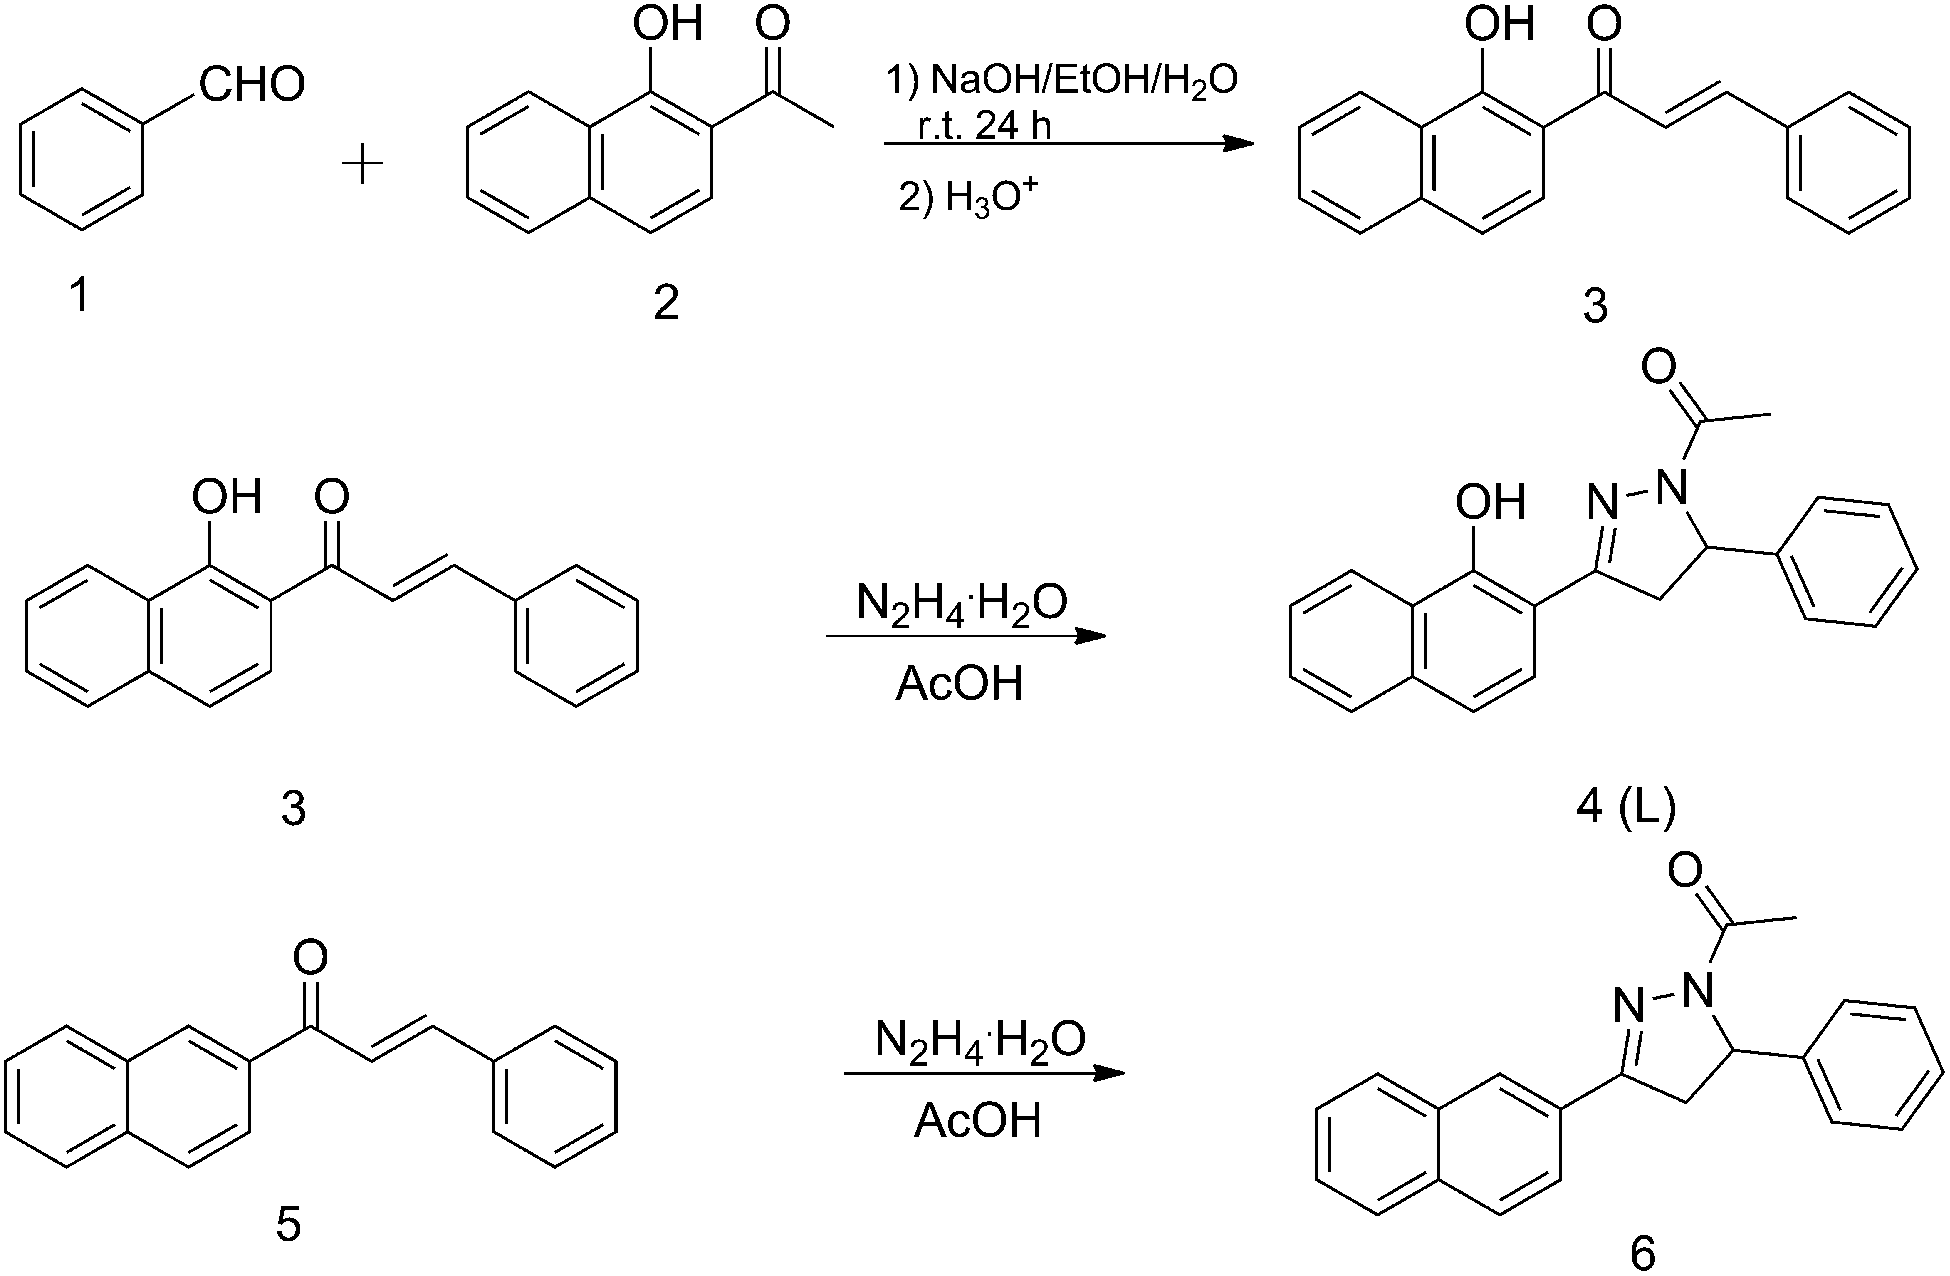 | ||
| Scheme 1 Synthesis of compound 4 (L). | ||
UV-vis absorption studies
To verify the practical applications in biological environment, the absorption spectral property of L toward different metal ions was measured in EtOH–HEPES (1:1, v/v, pH 7.2) solution. As shown in Fig. S1,† L alone (50 μM) exhibits a broad band centered at 320 nm and 355 nm. Upon addition of 5 equiv. metal ions, such as Ag+, Al3+, Fe3+, Ba2+, Ca2+, Cd2+, Cr3+, K+, Mg2+, Na+, Hg2+ did not induce significant changes in absorption curves. In contrast, Pb2+, Co2+, Ni2+, Zn2+, Cu2+, caused a new band at 390–450 nm, accompanied by a decrease of absorbance at 320 nm and 355 nm.
The UV-vis spectra of L with different concentration were also explored (Fig. S2 and S3, ESI†). The absorption maximum shows at 355 nm and the molar extinction coefficient ε is 1.2 × 10⁴ M−1 cm−1. To get more insight on the binding behavior of L and Zn2+, the absorption spectra titration experiment was further investigated. Upon addition of increasing concentration of Zn2+ to the buffered solution of L (50 μM), absorbance at 355 nm gradually decreased and a new absorption band at 410 nm significantly enhanced which indicate a complex L–Zn2+ formed. A distinct isobestic point at 378 nm was observed (Fig. 1). The ratio of absorbance at 354 nm and 410 nm (A354/A410) reached minimum when 5 equiv. Zn2+ was added (Fig. S4, ESI†), so this probe can be used as a ratiometric in colorimetric to detect Zn2+. These phenomena are similar to our previous reports,18d but absorption maximum red shifted (25 nm).
 | ||
| Fig. 1 UV-vis spectra of L (50 μM) upon the titration of Zn2+ (0–10 equiv.) in HEPES buffer solution (20 mM HEPES, pH 7.2, EtOH–H2O = 1:1). The inset shows the titration profile evaluated from the absorption at 410 nm. | ||
Fluorescence property
The fluorescence response behavior of L with respective metal ions was investigated in buffered EtOH–HEPES solution. As shown in Fig. 2, the solution of L displayed a very weak emission, while upon addition of 5 equiv. Zn2+ created a significant fluorescence enhancement almost 60-fold at 475 nm. However, other metal ions like Na+, Mg2+, K+, Ca2+, Al3+, Cu2+, Cr3+, Cd2+, Fe3+, Co2+, Ni2+, Ba2+, Ag+, Pb2+ and Hg2+, did not induce obviously fluorescence changes. | ||
| Fig. 2 Fluorescence spectra of 10 μM L in buffered EtOH–HEPES solution with 5 equiv. of metal ions (excitation wavelength: 410 nm). | ||
Furthermore, competition experiments for Zn2+ in the presence of other ions were carried out in the same condition. As displayed in Fig. 3, Al3+, Co2+, Fe3+, Ni2+, Cr3+ can partly quench fluorescence of L–Zn2+, whereas Cu2+ completely quenched the fluorescence of L–Zn2+. This may be due to that Cu2+ still binds to probe L in the presence of Zn2+. To confirm our speculation, the DFT calculations were performed. After calculated, the sum of electronic and zero-point energies of L with Zn2+ and L with Cu2+ were −1595.407841 and −1725.662761 respectively. So when the two metal ions co-exist, Cu2+ is easier to complex with probe L. Obviously fluorescence quenching was observed while complex with some paramagnetic metal ions, such as Co2+, Fe3+, Ni2+, Cu2+, which is always encountered in the other metal ion probes.7d,11,20 Therefore, probe L possesses good selectivity for response to Zn2+ in EtOH–H2O (1:1, v/v, pH 7.2) solution.
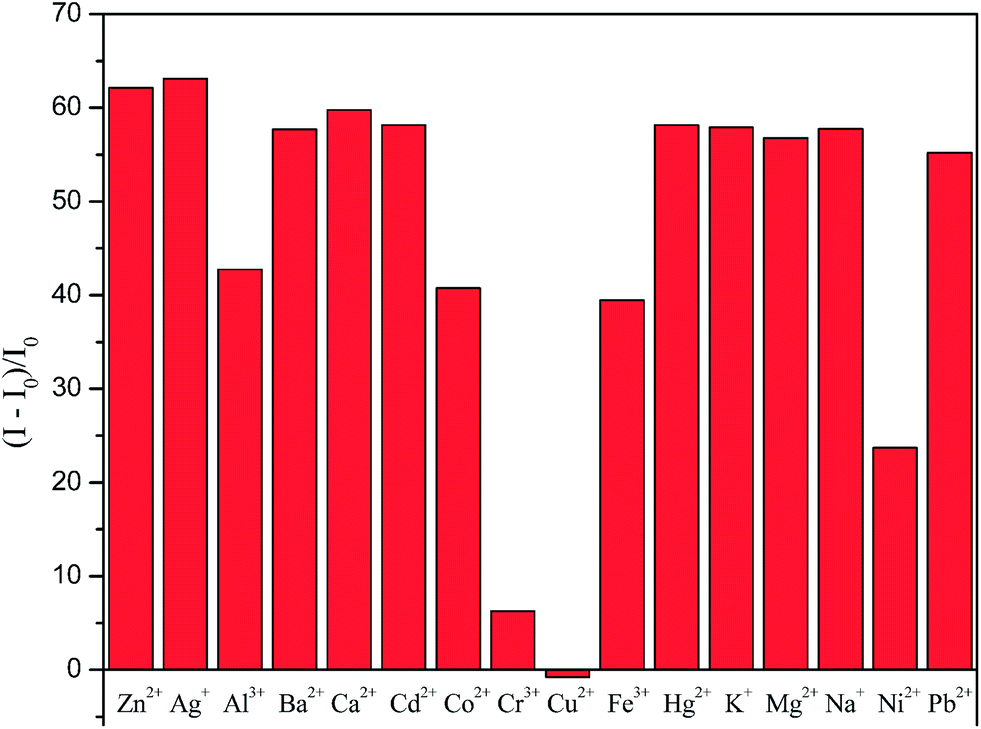 | ||
| Fig. 3 Fluorescence emission spectra of L–Zn(II) (1.0 × 10⁻⁵ M) in the presence of Al3+, Cr3+, Fe3+, Co2+, Cu2+, Ni2+, Ba2+ and Pb2+ (5 × 10⁻⁵ M) and Na+, Mg2+, K+, and Ca2+ (20 × 10−5 M) in the HEPES buffer solution (20 mM HEPES, pH = 7.2, EtOH–H2O = 1:1). | ||
In order to address the sensitivity of L toward Zn2+, the fluorescence titration of L (10 μM) with Zn2+ was carried out in EtOH–H2O (1:1, v/v, pH 7.2) (Fig. 4). With the increase addition of Zn2+ (0–50 equiv.), the fluorescent intensity increased prominent. These changes in the fluorescence spectra became negligible when more Zn2+ was added. The limit of detection (LOD) is evaluated using 3σbi/m,21 the detection limit calculated from the fluorescence titration curves is 1.23 × 10⁻⁷ M (Fig. S5, ESI†). The association constant (Ka) of L with Zn2+ was calculated to be 3.89 × 10³ M−1 (Fig. S6, ESI†). In titration experiments, it reached the maximum value upon addition of 50 equiv. of Zn2+. So we also measured the interference experiment upon addition of 50 equiv. of other anions and found that the interference of other anions at 50 equiv. concentration was similar to that at 5 equiv. concentration (Fig. S7, ESI†).
 | ||
| Fig. 4 Fluorescence emission spectra of L (10 μM) upon the titration of Zn2+ (0–50 equiv.) in HEPES buffer solution (20 mM HEPES, pH 7.2, EtOH–H2O = 1:1). The inset shows fluorescence intensity of Zn2+ concentration at 475 nm (excitation wavelength: 410 nm). | ||
Quantum yield was determined by the relative comparison procedure, using quinine sulfate dehydrate (≥99.0%) in 0.1 N H2SO4 as the main standard.22 And it was calculated by the general equation: Φ = Φs(IAs/IsA)(η2/ηs2).23 The fluorescence quantum yield (Φ) of probe L is 0.0093 and L–Zn2+ complex was measured to be 0.58. Additionally, the effects of anionic ions on the sensing behavior of probe L towards Zn2+ ion was investigated (Fig. S8, ESI†). There were negligibly changes in the fluorescence responses of L to ZnSO4, Zn(AcO)2, ZnCl2, and Zn(NO3)2.
Job plot analysis of the fluorescence data shows that the stoichiometric ratio was 1:1 for the L–Zn2+ complex (Fig. S9, ESI†). A proposed binding mode is shown in Fig. S10 (ESI†), which should be similar to our previous report.18d To further understand the binding mode of L and Zn2+, we also prepared compound 6 without phenolic hydroxyl group. In contrast to L, compound 6 did not induce obviously change in the absence and presence of 5 equiv. of Zn2+ in the HEPES buffer solution (Fig. S11, ESI†). In addition, we also used the MS method to confirm our hypothesis. The [(L–H)/Zn]+ complex was calculated at m/z 393.0581 and found at 393.0567 (Fig. S12, ESI†). To verify the mechanism of L–Zn2+, first-principles density functional theory calculations were performed using the Gaussian 09 program. The exchange and correlation interactions were modelled using the generalized gradient approximation (GGA) with the PW91 functional. The 6-311++G(d,p) (Lanl2dz on Zn) basis set was used for geometric optimization of the complex. And the calculation results support proposed binding mode (Fig. S13, ESI†). To better understand the binding behaviour of the probe L with Zn2+, the 1H NMR experiment was investigated. Upon addition of 5 equiv. of Zn2+, the spectra revealed an upfield or downfield shift of pyrazoline and aryl protons (Fig. S14, ESI†).
To obtain a better understanding of the response of probe L towards Zn2+, the effect of EDTA on the fluorescence behavior of the binding of Zn2+ to L was examined. As depicted in Fig. S15 (ESI†), upon addition of 10 μM EDTA to the mixture of L (10 μM) and Zn2+ (10 μM) the fluorescent intensity was almost quenched to the fluorescent intensity of probe L alone. However, the fluorescence was almost completely recovered when 1 equiv. of Zn2+ was added to the mixture of L–Zn2+–EDTA (10 μM). The results indicated that probe L was reversible for Zn2+.
For practical applications, the effects of pH and time are important factors for the probe. The relative fluorescence intensity for probe L alone was not sensitive to pH from 4.0 to 9.0. However, the fluorescence of L–Zn2+ was strongly dependent on pH, while pH from 6 to 7.6, fluorescence of L–Zn2+ increased sharply and peaked at pH around 7.6, and then decreased with the increase of pH value from 7.6 to 9 (Fig. S16, ESI†). In addition, the time course of L to 5 equiv. of Zn2+ showed that the probe L takes less than 10 min to interact with Zn2+ (Fig. S17, ESI†). The results showed that the probe can fast response Zn2+ in physiological condition.
Cell culture and imaging of intracellular Zn2+
Finally, to investigate the potential biological application of the probe L in living cells, imaging inside HeLa cells was monitored by fluorescence microscopy. The cells showed very faint fluorescence after incubation with 5 μM of the probe for 30 min at 37 °C. However, fluorescence became clearly visible when exogenous Zn2+ (10, 25, 50 μM) was introduced into the cells in the present of zinc-selective ionophore (concentration equivalent of 1/2 added Zn2+), pyrithione(2-mercaptopyridine N-oxide), providing visual evidence of the probe L readily entering cells and information on the intracellular existence of Zn2+ (Fig. 5A). In addition, fluorescence intensity significantly decreased after the addition of N,N,N′,N′-tetrakis (2-pyridylmethy1) ethylenediamine (TPEN, 200 μM) for 30 min (Fig. 5B). The results indicated that probe L should be potential for biological applications. We also analyzed the fluorescence intensity quantitation using the ImageJ image analysis tool and found that the fluorescence intensity increased as the concentration of exogenous Zn2+ (Fig. 5C). | ||
| Fig. 5 (A) Fluorescence microscope images of living HeLa cells. Cells of control groups were incubated with 5 μM probe L for 30 min at 37 °C. Cells were exposed to pyrithione (pyr, concentration equivalent of 1/2 added Zn2+) in the presence of 10, 25 and 50 μM extracellular Zn2+ for 30 min. After rinsed twice with PBS, cells were treated with 5 μM probe L for 30 min at 37 °C. (a) Fluorescent, (b) bright-field, (c) overlay image. (B) Fluorescent image after TPEN treatment. Intensity of fluorescence was significantly diminished after addition of 200 μM TPEN for 30 min. (d) Fluorescent, (e) bright-field, (f) overlay image. (C) Fluorescence intensity quantitation. Results are presented as means ± SE (n = 3; *p < 0.05 vs. control; **p < 0.01 vs. control). | ||
To investigate the biocompatibility of the probe, the cytotoxicity of the probe was evaluated using HeLa cell line by SRB assay, and the results were shown in Fig. S18 (ESI).† The probe showed a cell viability of 100% contrasting to the control group, which clearly demonstrated that the probe had no cytotoxicity to the cultured cell line under experimental conditions at the concentration of 5 μM after treating cells for 6 h.
Conclusions
In summary, we have developed a simple pyrazoline-based fluorescent probe for the detection of Zn2+ in aqueous solution. The probe displayed a 60-fold fluorescence enhancement upon complexation with Zn2+ under physiological conditions. And the addition of EDTA or TPEN can quench the fluorescence of L–Zn2+ which shows that L is a reversible probe. The detection limit of probe L for Zn2+ was calculated to be 1.23 × 10⁻⁷ M and the association constant was 3.89 × 10³ M−1. Additionally, we have demonstrated that the probe can be successfully used to the microscopic imaging for detection of intracellular Zn2+ in HeLa cells.Experimental section
Materials and characterization
Deionized water was used throughout the experiment. All the reagents were purchased from commercial suppliers and used without further purification. The aqueous solutions of metal ions were prepared from KNO3, NaNO3, Ca(NO3)2·4H2O, Mg(NO3)2·6H2O, Fe(NO3)3·9H2O, AgNO3, Co(NO3)2·6H2O, Al(NO3)3·9H2O, Ba(NO3)2, Cr(NO3)3·9H2O, Ni(NO3)2·6H2O, Cd(NO3)2·4H2O, Pb(NO3)2, Cu(NO3)2·3H2O, Zn(NO3)2·6H2O and HgCl2, respectively. All samples were prepared at room temperature, shaken for 10 s and stood for 18 h before UV-vis and fluorescence determination. Thin-layer chromatography (TLC) was conducted on silica gel 60F254 plates (Merck KGaA). HEPES buffer solutions (pH 7.2) were prepared using 20 mM HEPES, and the appropriate amount of aqueous sodium hydroxide using a pH meter. 1H NMR spectra were recorded on a Bruker Avance 300 (300 MHz) spectrometer, using DMSO as solvent. 13C NMR spectra were recorded on a Bruker Avance 300 (75 MHz) spectrometer, using DMSO as solvent, and tetramethylsilane (TMS) as internal standard. Melting points were determined on an XD-4 digital micro melting point apparatus. IR spectra were recorded with an IR spectrophotometer VERTEX 70 FT-IR (Bruker Optics). HRMS spectra were recorded on a QTOF6510 spectrograph (Agilent). UV-vis spectra were recorded on a U-4100 (Hitachi). Fluorescent measurements were recorded on an F-7000 (Hitachi) luminescence spectrophotometer.Cell culture and imaging
HeLa cells were cultured in Dulbecco's modified Eagle's medium (DMEM, Gibco) containing 10% calf bovine serum 50 (HyClone) at 37 °C in humidified air with 5% CO2. For fluorescence imaging, the cells (2 × 10⁴ mL−1) were seeded into 24 well plates overnight, and then experiments to assay Zn2+ uptake were performed in the same media supplemented with different concentrations of zinc nitrate with pyrithione (zinc ionophore, concentration equivalent of 1/2 added Zn2+). The cells were washed twice with PBS buffer and incubated with the probe (5 μM) for 30 min in the incubator. After washing twice with PBS, the cells were imaged under an inverted fluorescence microscope (Nikon TE2000-S) with a 20× objective lens.Cell viability assay
Cells (2 × 10⁴ mL−1) were seeded in 96-well plates. After 24 h, cells were treated with 0.1% DMSO (as control) or the probe at working concentration for 6 h. The probe was dissolved in DMSO as stock solution and applied to cells such that the final concentration of DMSO in the culture medium was below 0.1% (v/v). DMSO at a concentration of 0.1% (v/v) did not affect the viability of the cells. Cell viability was evaluated by sulforhodamine B (SRB) assay. Briefly, the medium was poured off and the cells were fixed by adding 100 μL of cold 10% trichloroacetic acid (TCA) and incubating for 1 h at 4 °C. The supernatant was discarded and then the plates were washed 5 times with deionized water. 50 μL of 0.4% (w/v) SRB solution in 1% acetic acid was added to each well and shaken for 5 min on a titer plate shaker. The plates were washed 5 times with 1% acetic acid and subsequently 100 μL of 10 mM unbuffered Tris base (pH 10.5) was added to dissolve the bound dye. After being mixed for 5 min on a microtiter plate shaker and optical densities were read at the wavelength of 540 nm using a SpectraMAX 190 microplate spectrophotometer (GMI Co., USA).Synthesis of 1-(3-hydroxynaphthalen-2-yl)-5-phenyl-4,5-dihydro-1H-pyrazol-1-yl))ethanone
A mixture of 1-(1-hydroxynaphthalen-2-yl)ethanone (933 mg, 5 mmol), benzaldehyde (540 mg, 5 mmol), 25% sodium hydroxide aqueous solution (15 mL) and ethanol (30 mL) was stirring at room temperature for about 10 h. After then, 80 mL of water was added to the reaction mixture and hydrochloric acid (6 M) was added to adjust pH to 5–6, then a red solid was precipitated. The crude product was obtained by filtration. Desired compound 3 was obtained by recrystallization from ethanol in 71% yield. mp: 124–126 °C. 1H NMR (400 MHz, DMSO-d6): δ = 7.48 (d, 1H, J = 15.4 Hz), δ = 7.49–7.52 (m, 3H), 7.62 (t, 1H, J = 8.0 Hz), 7.75 (t, 1H, J = 7.4 Hz), 7.79–8.00 (m, 4H), 8.20 (d, 1H, J = 15.4 Hz), 8.33 (d, 1H, J = 9.0 Hz), 8.38 (d, 1H, J = 8.3 Hz), 15.03 (s, 1H, OH); 13C NMR (100 MHz, DMSO): δ = 194.1, 163.7, 145.8, 137.6, 135.0, 131.6, 131.0, 129.8 (2C), 129.5 (2C), 128.1, 126.7, 125.5, 124.9, 124.2, 121.5, 118.8, 113.8; HRMS: calcd for C19H13O2− [M − H]− 273.0916, found: 273.1045.A mixture of chalcone 3 (182 mg, 0.66 mmol) and 80% hydrazine hydrate (166 mg, 3.3 mmol) in acetic acid (15 mL) was heated for 6 h at stirred and refluxed temperature. The progress of the reaction was monitored by TLC. After completion, the reaction mixture was allowed to cool to room temperature, and then 20 mL of water was added to the mixture to obtain a yellow precipitates. The crude product was filtered, washed with water and ethanol, and then dried to afford compound 4 as a yellow solid: 146 mg (67%); mp: 184–185 °C. IR (KBr, cm−1): 3451, 3066, 2926, 1661, 1419, 1399, 807, 700; 1H NMR (300 MHz, DMSO-d6): δ = 2.37 (s, 3H, CH3), 3.39 (dd, 1H, J = 4.6, 18.4 Hz, CHH in pyrazoline moiety), 4.09 (dd, 1H, J = 11.8, 18.4 Hz, CHH in pyrazoline moiety), 5.58 (dd, 1H, J = 4.6, 11.8 Hz, CH in pyrazoline moiety), 7.25–7.65 (m, 9H, Ar–H), 7.91 (dd, 1H, J = 2.7, 7.2 Hz, Ar–H), 8.32 (m, 1H, Ar–H), 11.30 (s, 1H, OH) (Fig. S19, ESI†); 13C NMR (75 MHz, DMSO): δ = 166.8, 157.0, 153.8, 142.0, 134.7, 128.7 (2C), 128.1, 127.6, 127.3, 126.0, 125.5 (2C), 125.0, 123.9, 122.6, 119.3, 108.9, 58.1, 43.0, 21.9 (Fig. S20, ESI†); HRMS: calcd for C21H19N2O2+ [M + H]+ 331.1447, found: 331.1439 (Fig. S21, ESI†).
Synthesis of 1-(3-naphthalen-2-yl)-5-phenyl-4,5-dihydro-1H-pyrazol-1-yl))ethanone
Chalcone 5 was easily prepared according to the literature24 with an 86% yield. Compound 6 was prepared in the same method with probe 4. White solid; yield: 70%; mp: 136–138 °C. 1H NMR (400 MHz, DMSO-d6): δ = 2.37 (s, 3H, CH3), 3.27 (dd, 1H, J = 4.6, 17.9 Hz, CHH in pyrazoline moiety), 3.95 (dd, 1H, J = 11.8, 17.9 Hz, CHH in pyrazoline moiety), 5.60 (dd, 1H, J = 4.6, 11.8 Hz, CH in pyrazoline moiety), 7.22–7.35 (m, 5H, Ar–H), 7.55–7.60 (m, 2H, Ar–H), 7.94–8.07 (m, 4H, Ar–H), 8.18 (s, 1H, Ar–H); 13C NMR (100 MHz, DMSO): δ = 167.9, 154.6, 142.9, 134.1, 133.2, 129.1 (3C), 128.9, 128.8, 128.2, 128.0, 127.8, 127.7, 127.3, 125.9 (2C), 123.5, 60.0, 42.6, 22.2; HRMS: calcd for C21H19N2O+ [M + H]+ 315.1497, found: 315.1494.Acknowledgements
This study was supported by 973 Program (2010CB933504) and National Natural Science Foundation of China (91313303).Notes and references
- A. R. Kay, Trends Neurosci., 2006, 29, 200 CrossRef CAS PubMed.
- J. M. Berg and Y. Shi, Science, 1996, 271, 1081 CAS.
- (a) P. J. Jiang and Z. J. Guo, Coord. Chem. Rev., 2004, 248, 205–229 CrossRef CAS PubMed; (b) E. Tomat and S. J. Lippard, Curr. Opin. Biotechnol., 2010, 14, 225 CrossRef CAS PubMed.
- E. L. Que, D. W. Domaille and C. J. Chang, Chem. Rev., 2008, 108, 1517 CrossRef CAS PubMed.
- (a) Z. C. Xu, J. Y. Yoon and D. R. Spring, Chem. Soc. Rev., 2010, 39, 1996 RSC; (b) J. H. Weiss, S. L. Sensi and J. Y. Koh, Trends Pharmacol. Sci., 2000, 21, 395 CrossRef CAS; (c) A. Takeda, BioMetals, 2001, 14, 343 CrossRef CAS; (d) F. Qian, C. L. Zhang, Y. M. Zhang, W. J. He, X. Gao, P. Hu and Z. J. Guo, J. Am. Chem. Soc., 2009, 131, 1460 CrossRef CAS PubMed.
- (a) H. S. Jung, P. S. Kwon, J. W. Lee, J. I. Kim, C. S. Hong, J. W. Kim, S. H. Yan, J. Y. Lee, J. H. Lee, T. Joo and J. S. Kim, J. Am. Chem. Soc., 2009, 131, 2008 CrossRef CAS PubMed; (b) Y. H. Wang, Y. Q. Huang, B. Li, L. M. Zhang, H. Song, H. Jiang and J. Gao, RSC Adv., 2011, 1, 1294 RSC; (c) Z. P. Liu, W. J. He and Z. J. Guo, Chem. Soc. Rev., 2013, 42, 1568 RSC.
- (a) J. Y. Choi, D. Kim and J. Y. Yoon, Dyes Pigm., 2013, 96, 176 CrossRef CAS PubMed; (b) G. Consiglio, S. Failla, I. P. Oliveri, R. Purrello and S. D. Bella, Dalton Trans., 2009, 10426 RSC; (c) Y. Zhou, Z. X. Li, S. Q. Zang, Y. Y. Zhu, H. Y. Zhang, H. W. Hou and T. C. W. Mak, Org. Lett., 2012, 14, 1214 CrossRef CAS PubMed; (d) H. Y. Lin, P. Y. Cheng, C. F. Wan and A. T. Wu, Analyst, 2012, 137, 4415 RSC; (e) M. Hosseini, Z. Vaezi, M. R. Ganjali, F. Faridbod, S. D. Abkenar, K. Alizadeh and M. Salavati-Niasari, Spectrochim. Acta, Part A, 2010, 75, 978 CrossRef PubMed.
- (a) N. Boens, V. Leen and W. Dehaen, Chem. Soc. Rev., 2012, 41, 1130 RSC; (b) A. N. Kursunlu, E. Guler, H. I. Ucan and R. W. Boyle, Dyes Pigm., 2012, 94, 496 CrossRef CAS PubMed; (c) S. Atilgan, T. Ozdemir and E. U. Akkaya, Org. Lett., 2008, 10, 4065 CrossRef CAS PubMed; (d) J. Cao, C. C. Zhao, X. Z. Wang, Y. F. Zhang and W. H. Zhu, Chem. Commun., 2012, 48, 9897 RSC.
- S. C. Yin, J. Zhang, H. K. Feng, Z. J. Zhao, L. W. Xu, H. Y. Qiu and B. Z. Tang, Dyes Pigm., 2012, 95, 174 CrossRef CAS PubMed.
- (a) Y. Zhang, X. F. Guo, L. H. Jia, S. C. Xu, Z. H. Xu, L. B. Zheng and X. H. Qian, Dalton Trans., 2012, 41, 11776 RSC; (b) C. J. Gao, X. J. Jin, X. H. Yan, P. An, Y. Zhang, L. L. Liu, H. Tian, W. S. Liu, X. J. Yao and Y. Tang, Sens. Actuators, B, 2013, 176, 775 CrossRef CAS PubMed; (c) X. M. Meng, S. X. Wang, Y. M. Li, M. Z. Zhu and Q. X. Qian, Chem. Commun., 2012, 48, 4196 RSC; (d) X. Y. Zhou, P. X. Li, Z. H. Shi, X. L. Tang, C. Y. Chen and W. S. Liu, Inorg. Chem., 2012, 51, 9226 CrossRef CAS PubMed.
- (a) S. Lee, J. H. Lee, T. Pradhan, C. S. Lim, B. R. Cho, S. Bhuniya, S. Kim and J. S. Kim, Sens. Actuators, B, 2011, 160, 1489 CrossRef CAS PubMed; (b) A. Misra, M. Shaahid and P. Srivastava, Sens. Actuators, B, 2012, 169, 327 CrossRef CAS PubMed.
- (a) Y. Li, Z. Y. Yang, Z. C. Liu, B. D. Wang and S. L. Li, Sens. Actuators, B, 2011, 160, 1504 CrossRef CAS PubMed; (b) W. Li, Z. Nie, K. Y. He, X. H. Xu, Y. Li, Y. Huang and S. Z. Yao, Chem. Commun., 2011, 47, 4412 RSC.
- (a) H. Woo, Y. You, T. Kim, G. J. Jhon and W. Nam, J. Mater. Chem., 2012, 22, 17100 RSC; (b) D. Maity and T. Govindaraju, Chem. Commun., 2012, 48, 1039 RSC; (c) J. S. Wu, W. M. Liu, X. Q. Zhuang, F. Wang, P. F. Wang, S. L. Tao, X. H. Zhang, S. K. Wu and S. T. Lee, Org. Lett., 2007, 9, 33 CrossRef CAS PubMed; (d) J. Li, C. F. Zhang, Z. Z. Ming, G. F. Hao, W. C. Yang and G. F. Yang, Tetrahedron, 2013, 69, 4743 CrossRef CAS PubMed.
- (a) L. Kong, Y. Chen, W. B. Ye, L. Zhao, B. Song, J. X. Yang, Y. P. Tian and X. T. Tao, Sens. Actuators, B, 2013, 177, 218 CrossRef CAS PubMed; (b) S. Sreejith, K. P. Divya and A. Ajayaghosh, Chem. Commun., 2008, 2903 RSC; (c) D. S. Kopchuk, A. M. Prokhorov, P. A. Slepukhin and D. N. Kozhevnikov, Tetrahedron Lett., 2012, 53, 6265 CrossRef CAS PubMed.
- (a) Z. P. Liu, C. L. Zhang, Y. C. Chen, F. Qian, Y. Bai, W. J. He and Z. J. Guo, Chem. Commun., 2014, 50, 1253 RSC; (b) Z. P. Liu, C. L. Zhang, Y. C. Chen, W. J. He and Z. J. Guo, Chem. Commun., 2012, 48, 8365 RSC.
- (a) L. Jiang, L. Wang, M. Guo, G. Yin and R. Y. Wang, Sens. Actuators, B, 2011, 156, 825 CrossRef CAS PubMed; (b) L. Yuan, W. Y. Lin, K. B. Zheng, L. W. He and W. M. Huang, Chem. Soc. Rev., 2013, 42, 622 RSC; (c) G. K. Tsikalas, P. Lazarou, E. Klontazs, S. A. Pergantis, L. Spanopoulous, P. N. Trikalitis, G. E. Froudakis and H. E. Katerinopoulos, RSC Adv., 2014, 4, 693 RSC.
- (a) G. Bai, J. F. Li, D. X. Li, C. Dong, X. Y. Han and P. H. Lin, Dyes Pigm., 2007, 75, 93 CrossRef CAS PubMed; (b) Z. L. Gong, L. W. Zheng, B. X. Zhao, D. Z. Yang, H. S. Lv, W. Y. Liu and S. Lian, J. Photochem. Photobiol., A, 2010, 209, 49 CrossRef CAS PubMed; (c) S. L. Hu, S. S. Zhang, Y. Hu, Q. Tao and A. X. Wu, Dyes Pigm., 2013, 96, 509 CrossRef CAS PubMed.
- (a) Z. L. Gong, F. Ge and B. X. Zhao, Sens. Actuators, B, 2011, 159, 148 CrossRef CAS PubMed; (b) Z. Zhang, F. W. Wang, S. Q. Wang, F. Ge, B. X. Zhao and J. Y. Miao, Org. Biomol. Chem., 2012, 10, 8640 RSC; (c) Z. L. Gong, B. X. Zhao, W. Y. Liu and H. S. Lv, J. Photochem. Photobiol., A, 2011, 218, 6 CrossRef CAS PubMed; (d) T. T. Zhang, F. W. Wang, M. M. Li, J. T. Liu, J. Y. Miao and B. X. Zhao, Sens. Actuators, B, 2013, 186, 755 CrossRef CAS PubMed; (e) A. Ciupa, M. F. Mahon, P. A. D. Bank and L. Caggiano, Org. Biomol. Chem., 2012, 10, 8753 RSC.
- (a) W. Y. Liu, H. Y. Li, H. S. Lv, B. X. Zhao and J. Y. Miao, Spectrochim. Acta, Part A, 2012, 95, 658 CrossRef CAS PubMed; (b) H. Ye, F. Ge, X. C. Chen, Y. Li, H. Zhang, B. X. Zhao and J. Y. Miao, Sens. Actuators, B, 2013, 182, 273 CrossRef CAS PubMed.
- (a) C. H. Hung, G. F. Chang, A. Kumar, G. F. Lin, L. Y. Luo, W. M. Ching and E. W. G. Diau, Chem. Commun., 2008, 978 RSC; (b) H. L. Chen, W. Gao, M. L. Zhu, H. F. Gao, J. F.Xue and Y. Q. Li, Chem. Commun., 2010, 46, 8389 RSC; (c) L. Xue, C. Liu and H. Jiang, Org. Lett., 2009, 11, 1655 CrossRef CAS PubMed.
- B. P. Joshi, J. Park, W. I. Lee and K. H. Lee, Talanta, 2009, 78, 903 CrossRef CAS PubMed.
- R. A. Velapoldi and K. D. Mielenz, A fluorescence standard reference material: quinine sulfate dehydrate, National Bureau of Standards (now the National Institute of Standards and Technology, NIST) Special Publication, Washington, DC, 1980, p. 260 Search PubMed.
- S. M. Song, D. Ju, J. F. Li, D. X. Li, Y. L.Wei, C. Dong, P. H. Lin and S. M. Shuang, Talanta, 2009, 77, 1707 CrossRef CAS PubMed.
- K. Juvale, V. F. S. Pape and M. Wiese, Bioorg. Med. Chem., 2012, 20, 346 CrossRef CAS PubMed.
Footnotes |
| † Electronic supplementary information (ESI) available: Supplementary Fig. S1–S21. See DOI: 10.1039/c4ra00584h |
| ‡ Equal contribution. |
| This journal is © The Royal Society of Chemistry 2014 |